3D front-face fluorescence spectroscopy for characterization of
olive oil
Lourdes Lleó
*1, Natalia Hernández-Sánchez
1, Faten Ammari
2, Jean Michel Roger
2 (1.Physical Properties Laboratory and Advanced Technologies in Agrifood, LPF-Tagralia, ETSIAAB, Universidad Politécnica de Madrid,Av. de la Complutense s/n, 28040 Madrid, Spain
2. Irstea, UMR ITAP, 361 Rue J.F. Breton, 34196 Montpellier Cedex 5, France)
Abstract: 3D front-face fluorescence spectroscopy and principal component analysis (PCA) were used to differentiate between Extra Virgin Olive (EVOO) and Olive Oil (OO). The results showed that 3D front-face fluorescence could be an effective tool to characterize EVOO and OO. Fourteen samples of olive oils were acquired directly from producers and from retail markets and their 3D fluorescence spectra were measured and analyzed. The first principal component of the PCA model retained the most important variability as a combination of freshness due to the presence of antioxidant compounds and chlorophyll; and of oxidation stage due to the presence of oxidation products. Olive oil samples presented different spectral patterns providing different scores for EVOO and OO in the PCA model. EVOO samples selected according to the differences in their scores in the PCA were exposed to indirect light. The evolution of their emission spectra was monitored with a right-angle set-up showing differences in concordance with their scores. This technique, the 3D front-face, is useful for characterization of olive oil samples according to their fluorescent compounds. The combination with other techniques (1H HR-NMR, HPLC, NIR spectrometry, etc.) may also be useful in protocols devoted to decision making processes with regard to olive oil quality specifications.
Keywords: fluorescence spectroscopy, olive oil, front-face, oxidation stage
Citation: Lleó, L., N. Hernández-Sánchez, F. Ammari, and J. M. Roger. 2016. 3D front-face fluorescence spectroscopy for characterization of extra virgin olive oil. Agricultural Engineering International: CIGR Journal, 18(4):190-199.
1 Introduction
1Olive oil trade has spread all over the world due to
its beneficial effect on human health which is related to
the characteristic fatty acid composition, the presence of
certain minor components and the antioxidant properties
of phenolic compounds (García-González et al., 2008).
In addition, the regulated designations (EEC No
2568/91) extra virgin olive oil (EVOO) and virgin olive
oil (VOO) present a high resistance to oxidative
deterioration due to the triacylglycerol composition with
high content of monoinsaturated fatty acids (oleic acid),
and to a group of phenolic antioxidants, mainly
polyphenols and tocopherols. However, for virgin olive
Received date: 2016-02-16 Accepted date: 2016-10-23 *Corresponding author: Lourdes Lleó, Departmento of Ingeniería Agroforestal, Escuela Técnica Superior de Ingeniería Agronómica, Alimentaria y de Biosistemas ETSIAAB, Avda. Complutense s/n,Universidad Politécnica de Madrid (UPM), CEI Moncloa,28040 Madrid, Spain. Tel: 34-91-3365444. Email: [email protected].
oil (EVOO, VOO and Lampante) such compounds are
drastically reduced during storage and refining process,
where new products appear due to oxidation (Velasco and
Dobarganes, 2002).
In fact, in many retail markets, olive oils are stored
for long periods without any control of the storage
conditions, which can induce their oxidation and can
possibly cause the development of undesirable flavours
(Frankel, 2010).
The oxidation leads to the formation of primary
oxidation products such as hydroperoxides that can be
decomposed to secondary oxidation products like
aldehydes, alcohols and ketones (Velasco and
Dobarganes, 2002). These latter compounds are
responsible for the characteristic off-flavour of degraded
edible oils. Oxidation depends on light exposure, heat,
endogenous metals, pigments, phospholipids and
antioxidants content (Choe and Min, 2006). Moreover,
poly- unsaturated fatty acids strongly affects the oxidative
process (Poulli et al., 2009).
The guarantee of authentication of EVOO is one of
the most challenging issues of the olive oil sector. Among
others, high resolution nuclear magnetic resonance 1H
HR-NMR (Hernández-Sánchez et al., 2014),
high-performance liquid chromatography HPLC, Fourier
Transform Infrared FT-IR, visible VIS, near infrared NIR,
mid infrared MIR spectroscopy methods have been applied
to adulteration detection, geographical origin determination
and oxidation status characterization (Frankel, 2010;
Aparicio et al., 2013). Currently, there is a need to improve
and harmonize the existing normative and regulations
concerning olive oil. Several international institutions (e.g.
International Olive Council, IOC) are actively involved in
the developing of normative for olive oil products, labeling
regulations, and rapid, easy and accurate instrumental
techniques and analytical methodologies.
Different types of fluorescence spectroscopy
methods have been used for analysis of EVOO quality
because they are less time-consuming and more
cost-efficient compared to other analytical procedures
(Karoui and Blecker, 2011).
In addition, fluorescence spectroscopy is a
noninvasive, highly selective and sensitive technique.
Other outstanding advantages are the absence of solvents
and reagents, and the requirement of small amounts of
sample. Classic fluorescence spectroscopy, front-face
fluorescence spectroscopy, synchronous scanning
fluorescence spectroscopy have provided chemists with a
sensitive approach to determine the oil quality for
soybean, corn, sunflower, and olive oils (Ammari et al.,
2012a; Kyriakidis and Skarkalis, 2000; Sikorska et al.,
2004; Sikorska et al., 2005; Sikorska et al., 2008).
Application of these methods to EVOO has a high
potential because most of the interesting components,
chlorophyll, antioxidants compounds such as polyphenols and α-tocopherol, and primary and secondary oxidation
products are fluorescent molecules.
The front-face approach provided accurate
measurements for edible oils in non-diluted samples
(Ammari, 2012a; Ammari et al., 2012b, 2012c).
Despite the interpretation of fluorescence spectral
data is complex due to the presence of many fluorophores,
different multivariate analysis methods (Independent
Component Analysis –ICA-, Principal Component
Analysis –PCA–, Partial Least Square –PLS– regression,
PLS Discriminant Analysis) could successfully facilitate
the interpretation and of olive oils (Kassouf et al, 2014;
Ammari et al., 2012b, 2012c; Valderrama et al., 2011;
Sádecká J., Tóthová J., 2007).
The objective of the present work is to study the
characteristic spectral pattern of EVOO and OO on the basis
of the differences between signal patterns and intensities
arising from different fluorescent compounds. 3D front-face
fluorescence spectroscopy was used to identify the spectral
regions of interest for EVOO and OO samples. PCA was
applied to facilitate the interpretation of the fluorescence
data and the characterization of the samples.
Finally, two EVOO samples selected according to
the PCA model were exposed to indirect light during five
months. Their emission spectra were monitored with a
right-angle set-up in order to evaluate the relationship
between the PCA model characterization and the further
evolution of the spectra.
2 Materials and methods
2.1 Materials
Fourteen samples of olive oils were acquired directly
from producers and from retail markets. These samples
were grouped according to the indications of producers
and of commercial labelling: seven EVOO samples (E1 to
E7) and seven OO samples (O1 to O7).
Analytical analyses were carried out at an external
laboratory according to European Regulations, EEC No
2568/91 and amendments.
Table 1 summarizes the relevant characteristics of
these samples. Note that K232 values are not available for
The two groups of oils, EVOO and OO,
accomplished the limits for K232 and K270 according to
EEC No 2568/91 (K232 ≤ 2.5 and K270 ≤ 0.22 for EVOO;
K270 ≤ 0.9 for non-EVOO). However, the K232 value of
E1 sample is higher than the limit; note that this sample
has been obtained from a retail market, where it could
have undergone uncontrolled oxidation.
2.2 3D front-face fluorescence spectroscopy and
chemometric analysis
3D front-face fluorescence spectra were measured
directly on the oil samples without prior preparation using
a spectrofluorometer (LS45, Perkin-Elmer) equipped with
a xenon lamp source, excitation and emission
monochromators and a front-face sample-cell holder.
Measurements were carried out using quartz
cuvettes (10 mm × 10 mm × 45 mm). The excitation
wavelengths ranged from 230 to 646 nm (step 4 nm) and
emission wavelengths ranged from 250 to 698.5 nm (step
0.5 nm). Excitation and emission monochromator slit
widths were set at 10 nm. Emission monochromator scan
speed was 800nms-1. A photomultiplier of voltage 650 V
was used.
The data corresponding to each sample were
arranged in a [105 x 898] matrix. All the elementary
matrices of the different samples of olive oil were pooled
in a [14 x 105 x 898] 3-way cubic array (14 spectra from
14 oil samples, 105 excitation wavelengths and 898
emission wavelengths). Data were then unfolded to give a
[14 x 94290] matrix in order to apply the chemometric
analysis.
The unfolded 3D spectra of the seven EVOO
samples were mean centered (with respect to the mean of
these seven spectra) and then submitted to PCA,
obtaining the corresponding loadings and scores. The
loadings were afterwards refolded for further
interpretations.
In addition, the unfolded 3D spectra of the seven OO
samples were also mean centered (considering the mean
of the EVOO spectra) and then, the loadings previously
computed were used to obtain their corresponding scores.
2.3 Right-angle fluorescence spectroscopy
A right-angle set-up prototype devoted to fast
inspection was designed and assembled by
LPF-TAGRALIA.
The fluorescence spectra were obtained using a
photonic multi-channel spectrometer (Hamamatsu, Japan)
with detection wavelengths ranging from 196.9 nm to
958.8 nm (step 0.75 nm, 1024 wavelengths). A UV-VIS
Table 1 Description and analytical measurements of the olive oil samples
Sample Quality Variety Commercial Origin K232 K270 α-tocopherol, mg / kg
Total Polyphenols, mg /kg
E1 EVOO Arbequina Market 2.8 0.12 181.3 122.2 E2 EVOO
Blend: Hojiblanca Arbequina Picual Cornicabra
light source (L10290, Hamamatsu, Japan) was used with
a deuterium lamp, with spectral range from 200 nm to
400 nm. Two optical filters were coupled to the
right-angle set-up so as to constrain both the excitation
and the emission wavelength ranges. An optical filter
limited the incident light to wavelengths lower than 400
nm. The other optical filter limited detected light to
wavelengths higher than 400 nm. Measurements were
carried out using quartz cuvettes (10 mm × 10 mm × 45
mm).
The two EVOO samples showing the highest and the
lowest PCA scores in the front-face model were exposed
to indirect light in transparent glass bottles. The evolution
of the emission spectra was monthly monitored
throughout five months with this set-up.
The emission spectra were normalized by computing
the ratio of the signal intensity at each wavelength to the
sum of the signal along the whole spectrum.
3 Results and discussion
3.1 3D front-face fluorescence spectra
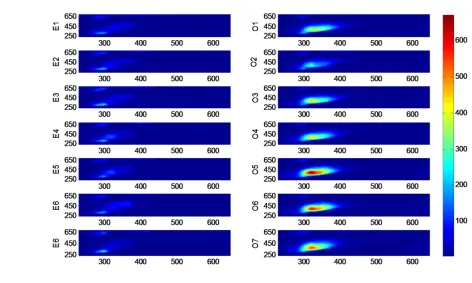
The 3D fluorescence spectra exhibited several
well-defined regions of intense fluorescence. Figure 1
shows the 3D spectra for the 14 samples of olive oils
depicted with comparable color scale. The left column
corresponds to EVOO group and the right one to OO
group. In a first approach, both types of olive oil samples
present different 3D fluorescence patterns.
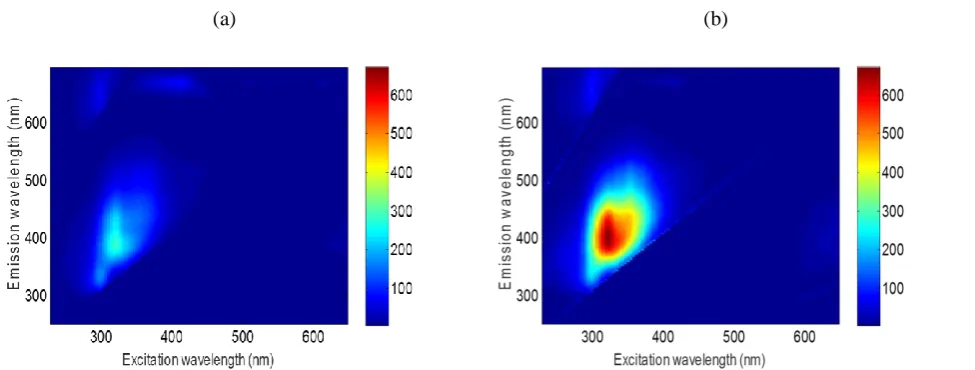
Two examples corresponding to an EVOO (E6) and
to an OO (O5) samples have been considered for the
detailed description of the most important regions
comprising the characteristic spectral patterns, as
illustrated in Figure 2a and 2b respectively.
Figure 1 3D front-face fluorescence spectra, left column corresponds to the seven EVOO samples (E1 to E7) and
right column to the seven OO (O1 to O7). Y axes: wavelengths of emission from 250 to 698.5 nm. X axes:
The spectral emission is the result of different
signals emitted by the corresponding different
fluorophores present in the sample. Previous researches
provide ranges of excitation and emission wavelengths
for the main fluorophores of olive oils that are related to
freshness and oxidation conditions. Table 2 summarizes
these emission and excitation bands as well as the
corresponding references.
In the EVOO samples, five regions of interest are
revealed. The area of the highest intensity emission signal
(region 1, R1) ranges approximately from 300 to 370 nm,
corresponding to an excitation band from 270 to 310 nm
(Figure 2a). This emission area is ascribed to tocopherols
and polyphenols according to literature summarized in
Table 2. Second area of emission (region 2, R2) ranges
approximately from 615 to 680 nm corresponding to an
excitation band from 270 to 310 nm. These excitation and
emission bands are not referenced in bibliography as
produced by a specific compound of olive oil. However, (a) (b)
Figure 2 (a) Example of a 3D front-face fluorescence spectrum of an EVOO (E6); (b) Example of a 3D
front-face fluorescence spectrum of OO (O6). The regions of high intensity emission are labeled from R1 to R5. Note
the different color scale.
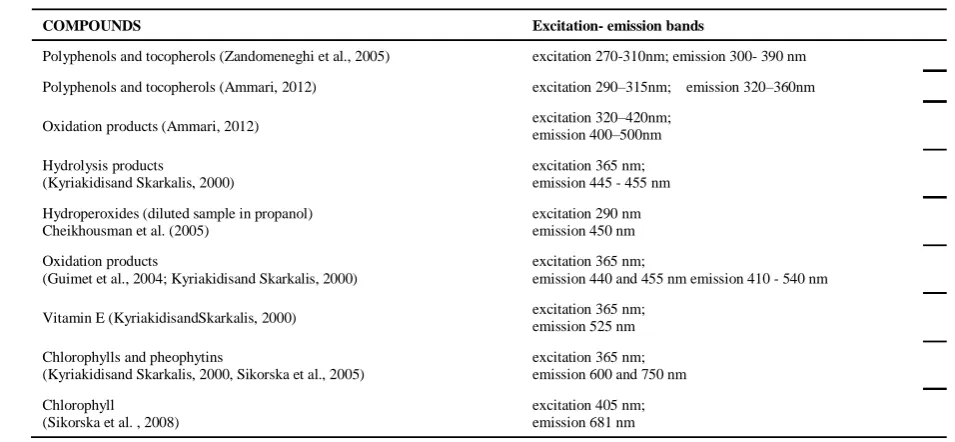
Table 2 Excitation-emission bands corresponding to the main compounds related to freshness and
oxidation conditions in olive oil.
COMPOUNDS Excitation- emission bands
Polyphenols and tocopherols (Zandomeneghi et al., 2005) excitation 270-310nm; emission 300- 390 nm Polyphenols and tocopherols (Ammari, 2012) excitation 290–315nm; emission 320–360nm Oxidation products (Ammari, 2012) excitation 320–420nm;
emission 400–500nm Hydrolysis products
(Kyriakidisand Skarkalis, 2000)
excitation 365 nm; emission 445 - 455 nm Hydroperoxides (diluted sample in propanol)
Cheikhousman et al. (2005)
excitation 290 nm emission 450 nm Oxidation products
(Guimet et al., 2004; Kyriakidisand Skarkalis, 2000)
excitation 365 nm;
emission 440 and 455 nm emission 410 - 540 nm Vitamin E (KyriakidisandSkarkalis, 2000) excitation 365 nm;
emission 525 nm Chlorophylls and pheophytins
(Kyriakidisand Skarkalis, 2000, Sikorska et al., 2005)
excitation 365 nm; emission 600 and 750 nm Chlorophyll
(Sikorska et al. , 2008)
it could be attributed to antioxidant compounds according
to the loadings in the PCA computation (see below).
The third area of emission (region 3, R3) ranges
approximately from 665 to 680 nm corresponding to an
excitation band from 380 to 420 nm. This area is related
to chlorophylls a and b and pheophytins a and b
according to literature (Table 2).
A fourth region of emission (region 4, R4) ranges
approximately from 500 to 530 nm for an excitation band
from 325 to 375 nm. This emission is attributed to
vitamin E in the literature (Table 2). Finally, a weak area
of fluorescence (region 5, R5) ranges from 360 to 480 nm
corresponding to an excitation band from 318 to 400 nm.
This region has been attributed to oxidation products
(Table 2). Specifically this spectral emission may be
produced by hydroperoxides as indicated by
Cheikhousman et al. (2005).
3D spectra of OO samples are characterized by a
single and wide high intensity emission region ranging
from 360 to 480 nm, for an excitation band from 318 to
400 nm (Figure 2b). This broad region could arise from
the partial merging of the fluorescence bands
corresponding to primary and secondary oxidation
products.
Three rather less intense regions appear in
concordance to R1, R2 and R3 described for EVOO
samples. Such signals of these regions may arise from the
fraction of virgin olive oil (either extra or non-extra)
contained in the OO samples, which are blends of refined
and virgin olive oils.
In view of these results, the 3D front-face
fluorescence spectroscopy may be useful, by itself or in
combination with other techniques (1H HR-NMR, HPLC,
NIR spectrometry, etc.) in protocols devoted to
decision-making processes with regard to olive oil quality
specification and to the detection of fraudulent blends.
This technique could be used in the pre-classification of
oil samples with significant savings of analytical
measurements specified in the regulations.
3.2. Principal component analysis
A principal component analysis was performed in
order to provide combined information from the different
sources of variability that comprise the 3D spectral
pattern of EVOO.
The first principal component, PC1, retains the 49%
of the total variance, and it captures the variability as a
combination of the presence of antioxidant compounds
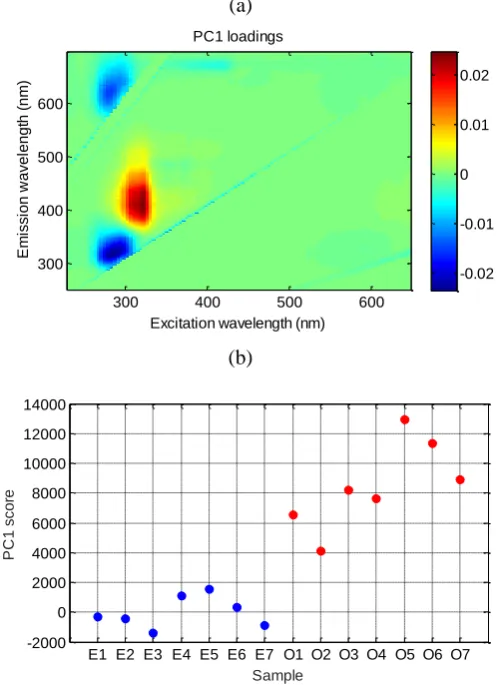
and oxidation products. As illustrated in Figure 3 (a) the
matrix of PC1 loadings shows four main regions.
(a)
(b)
Figure 3 (a) PC1 loadings obtained from PCA on
EVOO samples. (b) PC1 scores computed from PC1
loadings.
Three regions, approximately spatially concordant
with observed R1, R2 and R3 in 3D fluorescence spectra
(Figure 2a), are related to antioxidant compounds, and
present negative loading values. The most important of
these four regions is the R1, which is related to
tocopherols and polyphenols fluorescence. In addition, a
Excitation wavelength (nm)
E m issi o n w a ve le n g th ( n m ) PC1 loadings
300 400 500 600
300 400 500 600 -0.02 -0.01 0 0.01 0.02
fourth region appears with positive loading values, whose
location is concordant with the fluorescence region R5
arising from oxidation products.
The different signs of loadings related to
antioxidants (negative) and oxidation products (positive)
may enhance the identification of the highest quality
EVOO through the computed score. Such EVOO would
be characterized by high antioxidant content with
beneficial effect on human health and on potential olive
oil extended shelf-life.
The PC1 scores are computed for both EVOO and
OO groups (Figure 3b). In the case of the EVOO samples
(from E1 to E7), the scores present the lowest values
derived from their highest fluorescence of antioxidant
compounds. The EVOO sample E3 presents the lowest
score, whereas the sample E5 shows the highest value
(Figure 3b), which reflects the differences in their 3D
spectral patterns (Figure 4 a y b).
The scores of OO group are higher than those of the
EVOO group, in agreement with their higher fluorescence
of the oxidation compounds (Figure 1). Sample O2
presents a score value close to those of the EVOO group
(Figure 3b), whereas O5 shows the farthest score, which
also reflects the differences in their spectral patterns
(Figure 5).
(a) (b)
(c) (d)
Figure 4 (a) 3D front-face fluorescence spectra of the EVOO with the lowest PC1 score (E3) among EVOO
group; (b) 3D front-face fluorescence spectra of the EVOO with the highest PC1 score (E5) among EVOO group;
(c) Evolution of the emission spectra along five months (M0 to M5) of the E3 sample (excitation from 200 to 400
nm); (d) Evolution of the emission spectra along five months (M0 to M5) of the E5 sample (excitation from 200 to
For the EVOO group, the value and the narrow
dispersion of the scores highlight a predominant content
of antioxidant compounds, and a slight rate of
degradation. In contrast, the scores within the OO group
show a much higher value and variability, reflecting
different oxidation status. Such behavior could be
expected as OO samples are blends of refined and virgin
olive oils (either extra or non-extra). The refined olive
oils had undergone a more intense oxidation (Velasco and
Dobarganes, 2002).
According to Table 1, the two groups of samples
EVOO and OO present differences in their analytical
measurements. The observed K270 values are lower for
EVOO samples (ranging from 0.12 to 0.14) than for OO
samples (ranging 0.28 to 0.50), reflecting a higher status
of oxidation in the latter group, as expected. In addition
polyphenols content is usually higher for EVOO group
than for OO group, although some non-EVOO samples
present high values. As for K232, the ranges of the values
are overlapped. The same fact is observed in α-tocopherol content. However, for α-tocopherol, it could be not
necessarily related to the oxidation stage since its addition
to non-extra virgin olive is allowed by the European
regulation.
These analytical measurements summarized in Table
1 are in agreement with the observed fluorescence
features. As illustrated in Figure 3, generally those oils
with high polyphenol content present low value of PC1
scores, such as E3, E6 and E7 samples.
Within OO group, oil sample O2 presented the
highest polyphenol content, whereas those oils with much
lower polyphenol content, presented higher score value,
such as O1, O3, O5 and O6 samples. The K270 value of
O2 sample is the lowest of the OO group (close to the
upper limit of the normative, K270 ≤ 0.22) and the total
content of polyphenols is the maximum value within its
group. In contrast, olive oil O6 appears as the most
degraded sample and shows low polyphenol content and
high K270value (Table 1).
3.3 Eevolution of EVOO samples
The EVOO samples showing the extreme PC1
scores were exposed to indirect light, and the evolution of
the emission spectra was monitored for five months with
a right-angle set-up (Figure 4).
This set-up assures the detection of the chlorophyll
fluorescence signal, which is a major indicator of the oil
evolution under different storage conditions since it acts
as antioxidant under dark and as pro-oxidant under light
conditions. In Figure 4c and 4d the peak at 670 nm is
ascribed to chlorophyll fluorescence. The evolution of the
products of oxidation, from both primary and secondary
processes, can be monitored as well. In Figure 4c and 4d
(a) (b)
Figure 5 (a) 3D front-face fluorescence spectra of the OO with the lowest PC1 score (O2) among OO group; (b) 3D
the region ranging from 400 to 550 nm is ascribed to such
fluorophores.
The evolution of the signal intensity along the time
shows a significant decreasing at the chlorophyll region,
and a significant increasing at the oxidation products
region, when compared to the initial values in the month
zero (M0, Figure 4c and 4d). The major changes are
detected for sample E5 (Figure 4d), which presented the
highest PC1 score derived from a noticeable low
fluorescence signal of the antioxidant compounds and
high signal for oxidation products in 3D front-face
spectra (Figure 4b).
In view of this result, tentatively it could be
expected that the 3D front-face spectra are useful as a
reference to anticipate the subsequent degradation in
EVOO samples.
4 Conclusions
3D front-face fluorescence spectroscopy with
excitation wavelengths ranging from 230 to 646 nm and
emission wavelengths ranging from 250 to 698.5 nm
provides consistent spectral patterns of EVOO and OO
samples. According to literature, antioxidant compounds
such as polyphenols and tocopherols, chlorophylls and
pheophytins and oxidation products give rise to the
characteristic regions of interest.
Further characterization of the oil samples can be
faced by obtaining models that retain simultaneously the
spectral variability of such regions of interest. The
behavior captured is a combination of freshness due to
the presence of antioxidant compounds and of oxidation
conditions due to the presence of oxidation products.
3D front-face fluorescence spectroscopy is a
potential screening tool for characterization of EVOO and
OO samples. This technique may be complementary and
useful in combination with more detailed analytical
measurements.
Tentatively it could be expected that the 3D
front-face spectra are useful as a reference to anticipate
the subsequent degradation in EVOO samples.
Acknowledgements
Authors gratefully acknowledge the Centro
Tecnológico Agroalimentario de Lugo (Spain),
Comunidad de Madrid (S2013/ABI-2747, TAVS-CM,
Spain) and European Structural Funds for financial
support.
In addition authors gratefully acknowledge Juan
Ramón Izquierdo from the Laboratorio Arbitral
Agroalimentario of MAGRAMA (Spain) for expertise
advice on olive oil quality, and for providing the
analytical data.
LPF-TAGRALIA is part of the CEI Moncloa
Campus of Excellence, UPM-UCM (Spain).
References
Ammari, F. 2012a. Etude et amélioration de la stabilité des huiles végétale cours du chauffage apport des méthodes chimiométriques dans l’analyse des données. Thesis. Ammari, F., D. Jouan-Rimbaud-Bouveresse, N. Boughanmi, and D.
N. Rutledge. 2012b. Study of the heat stability of sunflower oil enriched in natural antioxidants by different analytical techniques and front-face fluorescence spectroscopy combined with Independent Components Analysis. Talanta, 99(99):323-329. doi:10.1016/j.talanta.2012.05.059
Ammari, F., C. B. Y. Cordella, N. Boughanmi, and D. N. Rutledge. 2012c. Independent components analysis applied to 3D-front-face fluorescence spectra of edible oils to study the antioxidant effect of Nigella sativa L. extract on the thermal stability of heated oils. Chemometrics and Intelligent Laboratory Systems, 113(3):32-42. doi:10.1016/j.chemolab.2011.06.005
Aparicio, R., M. T. Morales, R. Aparicio-Ruiz, N. Tena, and D. L. García-González. 2013. Authenticity of olive oil: Mapping and comparing official methods and promising alternatives. Food Research International, 54(2):2025–2038. doi:10.1016/j.foodres.2013.07.039
Cheikhousman, R., M. Zude, D. J. R. Bouveresse, C. L. Leger, D. N. Rutledge, and I. Birlouez-Aragon. 2005. Fluorescence spectroscopy for monitoring deterioration of extra virgin olive oil during heating. Analytical and Bioanalytical Chemistry, 382(6):1438-1443.
http://link.springer.com/article/10.1007%2Fs00216-005-32 86-1
and Food Safety, 5(4):169-186. http://onlinelibrary.wiley.com/doi/10.1111/j.1541-4337.200 6.00009.x/full 5
Frankel, E. N. 2010. Chemistry of Extra Virgin Olive Oil: Adulteration, Oxidative Stability, and Antioxidants. Journal of Agricultural and Food Chemistry, 58(10): 5991-6006. http://pubs.acs.org/doi/pdf/10.1021/jf1007677 García-González, D. L., R. Aparicio-Ruiz, and R. Aparicio. 2008.
Virgin olive oil - Chemical implications on quality and health. Eurpean Journal of Lipid Science & Technology, 110(7): 602–607.
http://onlinelibrary.wiley.com/doi/10.1002/ejlt.200700262/ pdf
Guimet, F., J. Ferré, R. Boqué, and F. X. Rius. 2004. Application of unfold principal component analysis and parallel factor analysis to the exploratory analysis of olive oils by means of excitation-emission matrix fluorescence spectroscopy. Analytica Chimica Acta, 515(1):75-85. doi:10.1016/j.aca.2004.01.008
Guoping, W., D. Quingzhu, and H. Zhenyu. 2008. Independent Component Analysis and its applications in signal processing for analytical chemistry. Trends Anal. Chem., 27(4):368–376. doi:10.1016/j.trac.2008.01.009
Guzmán, E., V. Baeten, J. A. F. Pierna, and J. A. García-Mesa. 2015. Evaluation of the overall quality of olive oil using fluorescence spectroscopy. Food Chemistry, 173:927-34. doi:10.1016/j.foodchem.2014.10.041
Hernández-Sánchez, N., L. Lleó, T. R. Cuadrado, M. D. Molero, and M. Ruiz-Altisent. 2014. HR Nuclear Magnetic Resonance Spectroscopy for authentication of olive oil quality. In Proceedings of International Conference of Agricultural Engineering, pp 1-6 Zurich, Switzerland. http://oa.upm.es/35330/
International Olive Council (IOC). 2013. Trade standards applying to olive oils and olive-pomace oils.COI/T.15/NC No 3/Rev. 7.
Karoui, R., and C. Blecker. 2011. Fluorescence spectroscopy measurement for quality assessment of food systems - a review. Food and Bioprocess Technology, 4(3):364–386 http://link.springer.com/article/10.1007%2Fs11947-010-03 70-0#page-1
Kassouf, A., M. El Rakwe, H. Chebib, V. Ducruet, D.N. Rutledge, and J. Maalouly. 2014. Independent components analysis coupled with 3D-front-face fluorescence spectroscopy to study the interaction between plastic food packaging and
olive oil. Analytica Chimica Acta, 839(10):14–25. doi:10.1016/j.aca.2014.06.035
Kyriakidis, N. B., and P. Skarkalis. 2000. Fluorescence spectra measurement of olive oil and other vegetable oils. Journal of AOAC International, 83(6):1435-1439.
Poulli, K. I., G. A. Mousdis, and C. A. Georgiou. 2009. Monitoring olive oil oxidation under thermal and UV stress through synchronous fluorescence spectroscopy and classical assays. Food Chemistry, 117(3):499-503.
http://www.sciencedirect.com/science/article/pii/S0308814 609004841
Sádecká, J., and J. Tóthová. 2007. Fluorescence spectroscopy and chemometrics in the food classification − a review.Czech
Journal of Food Sciences,25(4):159–173.
Sikorska, E., A. Romaniuk, I. V. Khmelinskii, R. Herance, J. L. Bourdelande, M. Sikorski, and J. Koziol. 2004. Characterization of Edible Oils Using Total Luminescence Spectroscopy. Journal of Fluoresc., 14(1):25-35. http://link.springer.com/article/10.1023%2FB%3AJOFL.00 00014656.75245.62
Sikorska, E., T. Górecki, I. V. Khmelinskii, M. Sikorski, and J. Koziol. 2005. Classification of edible oils using synchronous scanning fluorescence spectroscopy. Food
Chemistry, 89(2):217-225.
doi:10.1016/j.foodchem.2004.02.028
Sikorska, E., I. V. Khmelinskii, M. Sikorski, F. Caponio, M. T. Bilancia, A. Pasqualone, and T. Gomes. 2008. Fluorescence spectroscopy in monitoring of extra virgin olive oil during storage. International Journal of Food Science and Technology, 43(43):52-61.
Valderrama, P., P. H. Março, N. Locquet, F. Ammari, and D. N. Rutledge. 2011. A procedure to facilitate the choice of the number of factors in multi-way data analysis applied to the natural samples: Application to monitoring the thermal degradation of oils using front-face fluorescence spectroscopy. Chemometrics and Intelligent Laboratory Systems, 106(2):166–172.
doi:10.1016/j.chemolab.2010.05.011
Velasco, J., and C. Dobarganes. 2002. Oxidative stability of virgin olive oil. European Journal of Lipid Science and Technology, 104(9-10):661-676.