Vol.8 (2018) No. 4-2
ISSN: 2088-5334
Test Case Minimization Applying Firefly Algorithm
Nor Laily Hashim
#, Yasir Salman Dawood
##
Human-Centered Computing Lab, Universiti Utara Malaysia, School of Computing, Sintok, 06010, Kedah, Malaysia E-mail: [email protected], [email protected]
Abstract— The objective of this study is to propose a test case minimization method performed on UML statechart to produce test cases that are optimal while considering higher coverage criteria. Current test case generation techniques consume a large amount of time and cost with less testing coverage, while generating large number or test cases, what results in difficulties in detecting the faults and errors in the tested systems. Many approaches on test case minimization use genetic algorithms, model checking, or graph search algorithms to reduce the number of generated test cases, also the using of UML diagrams to test the system requirements and design before implementing it in the coding phase. However, these studies lack concentration in achieving higher coverage criteria and minimization in the generated test cases in the same time. The proposed test case minimization method has the following steps: provide weight to the paths, calculate path coverage for each path, transform an immediate graph into an adjacency matrix, which later is used to apply firefly algorithm and generate optimal test cases. A review on of the previous similar research in this domain has been presented and analysed to identify the issues and gaps in this domain. The steps use to perform the test case minimization have been presented together with some example and formula used. Findings from this study shows that this test case minimization has successful covered more types of test coverage which are all state, all transition, all transition pairs and all-one-loop paths. At the same time, it is capable of minimizing the number of test cases.
Keywords— test case minimization; firefly algorithm; UML state chart.
I. INTRODUCTION
Testing consumes a substantial amount of development time. Thus, developing an automatic test case generation algorithm for Model-Based Testing (MBT), which supports the commencement of the software testing process immediately after the design phase of the system lifecycle or as soon as the modelled requirements becomes available, is imperative [1]. Software testing is considered a critical part of the software development lifecycle [2] because software testing is performed during software development through a sequence of instructions of test inputs followed by expected outputs [3]. The quality of the system is evaluated by executing the test cases. To measure the quality of the generated test cases that contain both important and unimportant test cases, which need to be reduced by using some systematic procedure. Test case generations need to be effective in terms of both time and resources [3]. In the generated test cases, the possibility of redundant test cases needs to be reduced and eliminated, which leads to the process of test case minimization.
The purpose of test case minimization is to reduce the number of the test cases using method and technique, while maintaining the coverage criteria [3]. Minimization procedure is applied to maximize coverage, decrease
computational complexity, increase fault detection rate, and minimize running time [3]. Studies were conducted to generate a minimized number of test cases with the same coverage criteria as the original generated test cases[4]–[6] .
Coverage criteria is usually a rule or requirement that test cases need to satisfy [7]. According to [8], many types of coverage criteria can be used with the UML state chart diagram, such as all-states coverage, all-configurations coverage, all-transitions coverage, all-transition-pairs coverage, all-loop-free-paths coverage, all-one-loop-paths coverage, all-round-trips coverage, and all-paths coverage. Therefore, there are advantages in developing such mechanism that increases the coverage and diversity of test cases, while minimize and prioritize the generated test cases [9]. MBT is used to validate requirements, check the requirement’s consistencies, and generate test cases that are focused on the behavioural aspects of the software (Society, 2014). State chart diagrams, activity diagrams, and sequence diagrams, are the most commonly used UML structures to generate test cases [10]. The UML state chart diagram is a better option than other UML diagrams in test case generation because its lifecycle and the changes that it endures upon the delivery of an event are shown. This diagram can also reveal unit-level faults [11].
in efficient prioritization of the generated test cases [12]– [14]. According to [15], the firefly algorithm performed really well in optimizing the results.
Current test case generation techniques consume a large amount of time and cost with less testing coverage [16]. Many approaches, such as genetic algorithms, model checking, or graph search algorithms are used to perform test case minimization and at the same time measure the coverage criteria for UML diagrams [17]. As in [18-19], they applied only one coverage criteria, which is the transaction coverage, and generated a large number of test cases that were not minimized. Moreover, they did not minimize their generated test cases. Therefore, a test generation method that generates minimized test cases with more comprehensive test coverage criteria is highly required.
The objective of this study is to propose a test case minimization method performed on UML state chart to produce test cases that are optimal while considering higher coverage criteria. In this paper the discussion will me more concentrated on minimization and less on prioritization due to limited number of pages. This paper is organized as follows. Section II covers background concept and related work on test cases minimization and their techniques. Section III covers on the steps involve in the proposed test case minimization method, together with example. Finally, section IV concludes the results and provides further research directions.
Generating optimal test sequences and prioritizing the test sequences are still challenging tasks [14]. According to [20], no complete method is able to find optimal test cases up to the present. However, many researchers used a number of methods to reach optimal possible test cases. The most commonly used methods used by researchers to minimize the number of test cases include ant colony optimization, bee colony optimization, genetic algorithm, and firefly algorithm [2, 9, 19–21]. These methods try to generate test data in an automated manner to facilitate the task of software testing [24]. Therefore, numerous studies have been conducted to minimize the test sequences or test cases [27]. These methods are also used in test case prioritization techniques in software product lines [25] and also in other fields such as in monitoring water status of plants [26].
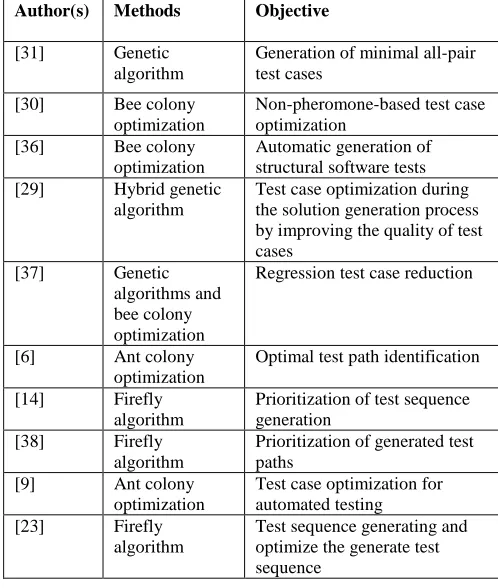
As shown in Table 1, the genetic algorithm is commonly used to minimize the number of test cases. However, the genetic algorithm includes no memorization, delayed convergence, risk of suboptimal solution, and nonlinear optimization [28], [29]. Therefore, a global optimal solution using genetic algorithm has no guarantee of success even when it is reached [30]. In addition, generating optimized test cases requires more time compared to other methods [31]. Bee colony optimization for test case minimization seemed to work effectively for programs with small sizes. However, as the size of software increases, finding paths and test data becomes more difficult [32] because the bee colony optimization method may be trapped in local search space and the number of iterations is quite high [24].
The firefly algorithm, is a new nature-inspired algorithm, it is widely used to solve minimization problems, also results in efficient prioritization of the generated test cases [12]– [14]. In study conducted by [23], they found that the test cases processed by firefly algorithm in compared with
particle swarm optimization (PSO), bat, harmony search, and cuckoo search, reveals optimal result with efficiently in very less time and with more accuracy. Furthermore, compared to the genetic algorithm and PSO techniques, the firefly algorithm reduces the overall computational effort by 86% and 74%, respectively [31-32] In addition, according to a survey by [35], the Meta heuristic approach firefly algorithm has proven to be successful minimization test case generation method. Their results covers each and every vertex of the graph of problem under test. Therefore, this study uses a firefly algorithm to minimize and prioritize test cases.
TABLE 1
TEST CASE MINIMIZATION METHODS
Author(s) Methods Objective
[31] Genetic algorithm
Generation of minimal all-pair test cases
[30] Bee colony optimization
Non-pheromone-based test case optimization
[36] Bee colony optimization
Automatic generation of structural software tests [29] Hybrid genetic
algorithm
Test case optimization during the solution generation process by improving the quality of test cases
[37] Genetic algorithms and bee colony optimization
Regression test case reduction
[6] Ant colony optimization
Optimal test path identification
[14] Firefly algorithm
Prioritization of test sequence generation
[38] Firefly algorithm
Prioritization of generated test paths
[9] Ant colony optimization
Test case optimization for automated testing [23] Firefly
algorithm
Test sequence generating and optimize the generate test sequence
In this section, a review of the techniques listed in Table 1 used for an automatic test case generation with test case minimization and/or prioritization is presented.
the generated test sequences. However, they did not generate the test cases or consider about coverage criterion.
As in [38], they proposed a UML-model-based test paths generated from UML activity diagram using the firefly algorithm. Their approach is based on the complexity of different constructs of the UML activity diagram. They used cyclomatic complexity and information flow metric to prioritize generated test paths. Cyclomatic complexity and information flow metric can be calculated from the adjacency metric of the flow graph of the UML activity graph.
An optimized test case system for the automated testing using ant colony optimization [9]. To improve the performance of the testing process, they used data mining techniques to reduce the size of the test cases. In their study, a technique called parallel early-binding recursive ant colony optimization system was presented with automated testing to provide an efficient way of software testing.
Firefly algorithm to generate test sequence using test data and then optimize the generated test sequence [23]. Test data values are selected based on the fitness function. Their work described how the test sequence are generated using the firefly algorithm and how they are useful in finding the optimal solution to maximize the problem. In their study, they found that the firefly algorithm is more accurate than other methods and the algorithm is able to generate automated test cases with test data efficiently.
The previous studies [9, 14, 23, 24, 36] focused on minimization and prioritization for the test sequence, where they only generate the paths and didn’t generate the test cases. They used many types of methods and techniques to achieve their objectives. However, these studies provide preliminary data on the test cases as test sequence; also, the coverage criteria of the generated sequences were not taken into consideration. The conclusion from these studies describe that the use of firefly algorithm is the optimal selection for minimization and prioritization of the present study generated test cases.
II. MATERIAL AND METHOD
In this section, the step, equation and the example used to present the proposed test case minimization is presented. After generating the test case paths from UML statechart diagram is conducted, test case minimization was conducted to reduce the generation of the test cases paths numbers while maximizing test coverage and generate an effective size of generated test cases.
Test case minimization starts by assuming each visited or amount of visited edge Ei in a specific path as 1 and 0 for
unvisited edge. The generated path was converted to path weight as shown in Table 2. The weight of a path is the summation of the weights of the path traversed [39]. Therefore, this study proposed Equation 1 to calculate weight values to determine each path weight of transactions in the system, as shown in Table 2.
= ==
n i i R i i vf
E
W
00 (1)
where R represents the total number of edges and in this example is equal to 12. fi =1, where n is the number of states.
Table 2 shows the value of Wv for each single path. As an
example, the first path Ei summation is equal to 6 because it
visits six edges, and fi summation equals to 7 because it
contains seven different vertices. Therefore, Wv = 6/7= 0.85.
TABLE II PATH WEIGHT FOR EACH PATH
T P S → 1 1 → 2 1 → 5 2 → 3 2 → 5 2 → E 3 → 4 3 → 5 4 → 5 4 → 3 5 → E
1 1 1 0 1 0 0 1 0 1 0 1 0.85 2 1 0 1 0 0 0 0 0 0 0 1 075 3 1 1 0 0 1 0 0 0 0 0 1 0.8 4 1 1 0 0 0 1 0 0 0 0 0 075 5 1 1 0 1 0 0 0 1 0 0 1 0.83 6 1 1 0 1 0 0 1 0 1 1 1 0.77 7 1 1 0 1 0 0 1 1 0 1 1 0.87
After generating the path weight, the next step starts by calculating the path coverage for each single path, as shown in Table 3. Let the test cases TP be a set of test paths, TP = (T1, T2, T3,…, Tn). If one of the TP achieves full coverage,
then this test case will be selected. If more than one test path achieves full coverage, the path with lower Wv will be
selected. When no test case achieves full coverage, selecting an effective set of test cases that will achieve full coverage by its combination is necessary. Now, this step is presented through an algorithm.
In most cases, one testing path cannot achieve full coverage, as there may be many paths from several decision vertices, as shown in Table 3, where the sixth path achieves all-state and all-one-loop-path coverage, but not achieving all-transition and all-transition-pair coverage. An approach has been proposed in this study to select more than one testing path to increase the testing coverage using the firefly algorithm. Then, the selection continues until it reaches full coverage. The selection method for the next best testing path depends on the firefly algorithm in the edges contained in the best testing path. In other words, the next best testing path should contain various edges as possible compared with the best testing path [40] with the lowest weight possible. The testing paths, which are eliminated, have the largest similarity degree.
TABLE III
COVERAGE CRITERIA FOR EACH PATH
TP No.
All state All transition All-transition pairs All-one-loop paths
1 100% 54% 44% 0%
2 57% 63% 11% 0%
3 71% 27% 22% 0%
4 57% 63% 22% 0%
5 85% 45% 33% 0%
6 100% 63% 55% 100%
7 100% 63% 55% 100%
matrix for the graph. Adjacency matrix is a two-dimensional matrix that indicates the relationship between vertices and edges [24].
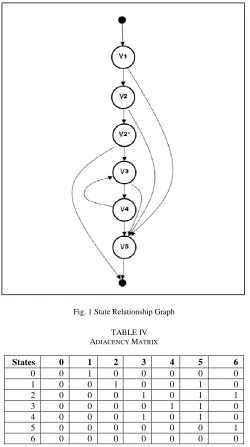
Next, the value of each element of the adjacency matrix is specified. If connectivity between nodes i and j is detected, then the elements aij = 1and aij = 0 otherwise, [41], as shown in Table 4. The following are the steps in creating an adjacency matrix [41] :
Step 1: Construct an n x n null matrix (let it be Adj (i,j)).
Step 2: Check whether an edge exists for all vertices. Step 3: If E(Vi, Vj) == 1
Adj (i,j) = 1;
Step 4: Repeat step 3 for all values of i.
The adjacency matrix in Table 4 was created best on the graph in Fig. 1 as an example. However, vertices 2 and 2` were combined.
Fig. 1 State Relationship Graph TABLE IV ADJACENCY MATRIX
States 0 1 2 3 4 5 6
0 0 1 0 0 0 0 0
1 0 0 1 0 0 1 0
2 0 0 0 1 0 1 1
3 0 0 0 0 1 1 0
4 0 0 0 1 0 1 0
5 0 0 0 0 0 0 1
6 0 0 0 0 0 0 0
Then, the created adjacency matrix is used to generate a guidance matrix. A guidance matrix holds guidance factors
to probe the fireflies in making decisions at predicate vertices in choosing the path [24]. The out degree of a vertex is the total number of edges that move out from a vertex, and a vertex with an out degree greater than 1 is defined as a predicate vertex [24]. It is used for the decision matrix for a given graph. For a firefly at a predicate vertex, the decision to choose a path or not is carried out by referring to the guidance factor in the guidance matrix. It blocks the global view of the domain or graph. The guidance factor GF can be defined as follows [24]:
)
1
.
0
)
(
(
10
−
−
=
CC
V
i
GF
i (2)The guidance value for the final state is usually set to 1,000 or any high value. The cyclomatic complexity (CCi) of the given vertex i can be calculated by the following formula [42]:
2
+
−
=
E
V
CC
(3)where E is the number of edges of the graph and V is the number of vertices of the graph.
Fireflies at a predicate vertex use the guidance factor as discussed above to traverse the vertex. Therefore, the brightness can be defined as follows:
factor
guidance
function
Brightness
_
1
_
=
(4)Thus, a firefly at a predicate vertex follows the guidance factor with a lower value.
In the example in Fig. 2, the number of vertices is 7, and the number of edges is 11; therefore, the Cyclomatic Complexity equal to 6. However, the Cyclomatic Complexity for each vertex should be obtained (using Equation 3) to calculate the guidance value. For example, for the third state, CC3=4-3+2=3, and for the same state, GF3 =10(3((7-4)-0.1)) = 117, as shown in Table 5.
TABLE V GUIDANCE VALUE
States Cyclomatic
Complexity (CC) Guidance value (GF)
0 6 414
1 6 354
2 5 245
3 3 117
4 2 58
5 1 19
6 1,000 [END vertex infinity]
1,000 [finial state]
The guidance matrix (Table 6) is only a look-up/decision table of the adjacency matrix with each guidance factor corresponding to every edge. Table 6 was created based on Table 4 by multiplying each state value by the guidance value from the same state in Table 5.
TABLE VI GUIDANCE MATRIX
States 0 1 2 3 4 5 6
0 0 354 0 0 0 0 0
1 0 0 245 0 0 19 0
2 0 0 0 117 0 19 1000
3 0 0 0 0 58 19 0
4 0 0 0 117 0 19 0
5 0 0 0 0 0 0 1000
6 0 0 0 0 0 0 0
Then, the algorithm will generate the first path = [0, 1, 5, 6] by starting from state 0 and searching the lowest value in the row, and in this case, it is 354 which represents state 1. Therefore, the first sequence (0, 1) is created. Then, from state 1, proceed to the next state with the lowest value. In this case, it is 19. Thereafter, create (1, 5). State 5 will end to state 6 to create (5, 6). Then, all the visited states in Table 4.7 [(0, 1), (1, 5), (5, 6)] will be replaced with zero as in Table 7. The next execution will generate the rest of the paths until all the states are equal to zero. The paths are Path 2 = [1, 2, 5], Path 3 = [2, 3, 5], Path 4 = [2, 6], Path 5 = [3, 4, 5] and Path 6 = [4, 3]. The fifth path starts with 3, and the sixth path ends with 3. Therefore, they will be combined as [4, 3, 4, 5].
TABLE VII
GUIDANCE MATRIX AFTER FIRST PATH
States 0 1 2 3 4 5 6
0 0 0 0 0 0 0 0
1 0 0 245 0 0 0 0
2 0 0 0 117 0 19 1000
3 0 0 0 0 58 19 0
4 0 0 0 117 0 19 0
5 0 0 0 0 0 0 0
6 0 0 0 0 0 0 0
The algorithm will match each optimal path sequence with the test paths in Fig. 3 to optimize the test cases, and the matched path is chosen. When more than one matched path is present, choose the lowest path weight Wvfrom Table 8 between the selected match paths.
TP 1: [S→1→2→3→4→5→E] TP 2: [S→1→5→E ]
TP 3: [S→1→2→5→E] TP 4: [S→1→2→E] TP 5: [S→1→2→3→5→E]
TP 6: [S→1→2→3→4→3→4→5→E] TP 7: [S→1→2→3→4→3→5→E]
Fig. 3 All Possible Test Paths Using
TP 2: [S→1→5→E ] TP 3: [S→1→2→5→E] TP 5: [S→1→2→3→5→E] TP 4: [S→1→2→E]
TP 6: [S→1→2→3→4→3→4→5→E]
Fig. 4 Optimized Test Paths
III.RESULT AND DISCUSSION
The highest coverage percentage of a testing path that can cover a system is the best path. However, the highest percentage does not mean the largest number of vertices. Each path has its own coverage, as illustrated in Table 3.
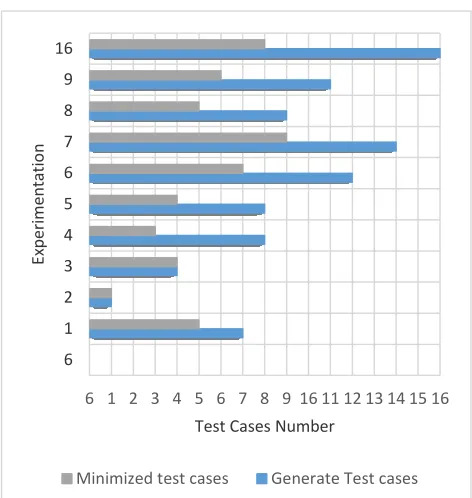
This method minimized the number of test paths to five (see Fig. 4) from the seven test paths, as shown in Fig. 3, where the first and seventh paths have been deleted. However, the experiment shows that the minimization method depends on the complexity of the inputted graph, especially on the numbers of the loop in it.
The combination of these five paths leads to achieving all-state coverage, all-transition coverage, all-transition-pair coverage, and all-one-loop coverage, as shown in Table 8.
0 1 2 3 4 5 6 7 8 9 10 11 12 13 14 15 16 0
1 2 3 4 5 6 7 8 9 10
Test Cases Number
E
xp
e
ri
m
e
n
ta
ti
o
n
Minimized test cases Generate Test cases
TABLE VIII
COVERAGE CRITERIA PERCENTAGE FOR MINIMIZED PATHS
TP No All
state All transit ion
All-transition pairs
All-one-loop paths
2, 3, 5, 4, 6 100% 100% 100% 100%
Fig. 5 shows the test case minimization from 10 UML state chart diagram examples where the total minimization achieved from the total number is 31%. With reduction in the total number of test cases, this approach also managed to achieve high coverage in four type of coverage as shown in Table 8. As mentioned earlier in Section I, similar to this work which are [18-19], they only apply transition coverage and are not focusing on minimizing the number of test cases. In this study, the state chart examples used are having different complexities such as from ATM system, university library, online shop, airline check-in, and retail point of sale.
IV.CONCLUSIONS
In this paper, methods used for test case minimization in general or the one applied on UML state chart have been analyzed. In particular, the highlight is more on identifying what algorithm were used and how the test case minimization was conducted. The proposed algorithm has been presented by providing the steps taken and the equation used together with some sample data. To summarize the finding, the proposed minimization approach has successfully covered more types of test coverage and at the same time able to minimize the number of test cases.
The work presented in this paper, is a subset of a larger research, which was to produce a framework for test case generation for UML state chart. The procedure on how to convert a state chart diagram to test paths, test prioritization and automatic test case generation are not included in this paper. For future work, a comparison with similar test case generation and minimization methods with be explored and compare them in terms of their test coverage and minimization level.
ACKNOWLEDGMENT
We would like to thank Ministry of Education for providing us with FRGS grant Code SO 13183.
REFERENCES
[1] H. Oluwagbemi, O., & Asmuni, “Development of a robust parser for extracting artifacts during model-based testing from UML diagrams.,” Int. J. Softw. Eng. Technol., vol. 1, no. 2, pp. 43–50, 2014.
[2] J. Gulia, P., & Chugh, “Comparative analysis of traditional and object-oriented software testing,” ACM SIGSOFT Softw. Eng. Notes, vol. 40, no. 2, pp. 1–4, 2015.
[3] G. S. V. P. Sumalath, V. & Raji, “Model Based Test Case Optimization of UML Activity Diagrams using Evolutionary Algorithms,” Int. J. Comput. Sci. Mob. Appl., vol. 2, no. 11, pp. 131–142, 2014.
[4] B. S. Ahmed, “Test case minimization approach using fault detection and combinatorial optimization techniques for configuration-aware structural testing.,” Int. J. Eng. Sci. Technol., vol. 19, no. 2, p. 737– 753., 2016.
[5] A. Belli, F., & Hollmann, “Test generation and minimization with basic statecharts,” in of the 2008 ACM symposium on Applied Computing.
[6] G. Srivastava, P. R., Baby, K., & Raghurama, “An approach of optimal path generation using ant colony optimization,” in TENCON 2009-2009 IEEE Region 10 Conference.
[7] O. Paul, A. & Jeff, Introduction to Software Testing. New York, NY, USA: Cambridge University Press., 2008.
[8] B. Utting, M., & Legeard, Practical model-based testing: a tools approach. Morgan Kaufmann, 2010.
[9] A. Dubey, Y., Singh, D., & Singh, “A parallel early binding recursive Ant Colony optimization (PEB-RAC) approach for generating optimized auto test cases from programming inputs.,” Int. J. Comput. Appl., vol. 136, no. 3, pp. 11–17, 2016.
[10] R. Shirole, M., & Kumar, “A hybrid genetic algorithm based test case generation using sequence diagrams,” Contemp. Comput., pp. 53–63, 2010.
[11] A. Abdurazik, A., Offutt, J., & Baldini, “A controlled experimental evaluation of test cases generated from UML diagrams.Technical Report, ISE-TR-04-03,” 2004.
[12] K. Choudhary, Y. Gigras, Shilpa, and P. Rani, “Cuckoo Search in Test Case Generation and Conforming Optimality Using Firefly Algorithm,” in Proceedings of the Second International Conference on Computer and Communication Technologies, 2016, pp. 781–791. [13] B. Kwiecień, J., & Filipowicz, “Firefly algorithm in optimization of
queueing systems.,” Bull. Polish Acad. Sci. Tech. Sci., vol. 60, no. 2, pp. 363–368, 2012.
[14] D. Panthi, V., & Mohapatra, “Generating prioritized test sequences using Firefly optimization technique,” Comput. Intell. Data Min., vol. 2, pp. 627–635, 2015.
[15] A. Hashmi, N. Goel, S. Goel, and D. Gupta, “Firefly Algorithm for Unconstrained Optimization,” IOSR J. Comput. Eng., vol. 11, no. 1, pp. 75–78, 2013.
[16] J. Kosindrdecha, N., & Daengdej, “A test generation method based on state diagram,” JATIT, p. 28–44., 2010.
[17] S. Weißleder, Test models and coverage criteria for automatic model-based test generation with UML state machines. Humboldt University of Berlin., 2010.
[18] F. Chimisliu, V., & Wotawa, “Using dependency relations to improve test case generation from UML statecharts,” in Software and Applications Conference Workshops (COMPSACW), 2013. [19] F. Chimisliu, V., & Wotawa, “Model based test case generation for
distributed embedded systems.,” in Industrial Technology (ICIT), 2012 IEEE International Conference on., 2012.
[20] P. Tomar, A., & Singh, “Software testing with different optimization techniques,” Int. J. Emerg. Technol. Adv. Eng., vol. 6, no. 6, pp. 169–171, 2016.
[21] P. R. (2011). T. case optimization using artificial bee colony algorithm. 570-579. Kulkarni, N. J., Naveen, K. V., Singh, P., & Srivastava, “Test case optimization using artificial bee colony algorithm.,” Adv. Comput. Commun., pp. 570–579, 2011.
[22] V. Mala, D. J., Kamalapriya, M., Shobana, R., & Mohan, “A non-pheromone based intelligent swarm optimization technique in software test suite optimization,” in International Conference on Intelligent Agent & Multi-Agent System, 2009.
[23] M. R. Sahoo, R. K., Ojha, D., Mohapatra, D. P., & Patra, “Automated test case generation and optimization: a comparative review.,” Int. J. Comput. Sci. Inf. Technol., vol. 8, no. 5, pp. 19–32, 2016.
[24] X.-S. Srivatsava, P. R., Mallikarjun, B., & Yang, “Optimal test sequence generation using firefly algorithm,” Swarm Evol. Comput., vol. 8, pp. 44–53, 2013.
[25] M. Sahak, S. Abd Halim, D. N. Abang Jawawi, and M. A. Isa, “Evaluation of Software Product Line Test Case Prioritization Technique,” Int. J. Adv. Sci. Eng. Inf. Technol., vol. 7, no. 4–2, p. 1601, 2017.
[26] Y. Hendrawan and D. F. Al Riza, “Machine Vision Optimization using Nature-Inspired Algorithms to Model Sunagoke Moss Water Status,” Int. J. Adv. Sci. Eng. Inf. Technol., vol. 6, no. 1, p. 45, 2016. [27] K. Srividhya, J., & Alagarsamy, “A synthesized overview of test case optimization techniques.,” J. Recent Res. Eng. Technol., vol. 1, no. 2, 2014.
[29] V. Mala, D. J., Ruby, E., & Mohan, “A Hybrid Test Optimization Framework - Coupling Genetic Algorithm With Local Search Technique,” Comput. INFORMATICS, vol. 29, no. 1, 2010. [30] V. Dharmalingam, Jeya Mala and Mohan, “ABC Tester - Artificial
Bee Colony Based Software Test Suite Optimization Approach ABC Tester - Artificial Bee Colony Based Software,” Int.J. Softw. Eng. IJSE, vol. 2, no. June, 2009.
[31] J. D. McCaffrey, “Generation of pairwise test sets using a simulated bee colony algorithm,” in 2009 IEEE International Conference on Information Reuse Integration, 2009, pp. 115–119.
[32] P. R. Lam, S. S. B., Raju, M. H. P., Ch, S., & Srivastav, . “(2012). Automated generation of independent paths and test suite optimization using artificial bee colony.,” Procedia Eng., vol. 30, pp. 191–200, 2012.
[33] V. Panthi and D. P. Mohapatra, “Generating Prioritized Test Sequences Using Firefly Optimization Technique,” in Computational Intelligence in Data Mining - Volume 2, 2015, pp. 627–635. [34] X. Yang, X.-S., & He, “Firefly algorithm: recent advances and
applications.,” Int. J. Swarm Intell., vol. 1, no. 1, pp. 36–50, 2013. [35] A. Choudhary, K., Gigras, Y., Shilpa, Rani, P. & Grover, “A Survey
Paper on Test Case Generation and Optimization: Cuckoo Search and Firefly Algorithm,” Int. J. Eng. Dev. Res., vol. 3, no. 2, pp. 584–589, 2015.
[36] S. Dahiya, S. S., Chhabra, J. K., & Kumar, “Application of artificial bee colony algorithm to software testing.,” in 21st Australian Software Engineering Conference (ASWEC), 2010.
[37] V. Suri, B., Mangal, I., & Srivastava, “Regression test suite reduction using an hybrid technique based on BCO and genetic algorithm.,” Spec. Issue Int. J. Comput. Sci. Informatics.
[38] V. Rhmann, W., & Saxena, “Optimized and prioritized test paths generation from UML activity diagram using firefly algorithm.,” Int. J. Comput. Appl., vol. 145, no. 6, pp. 16–22, 2016.
[39] K. Ruohonen, “Graph theory,” 2013. [Online]. Available: http://math.tut.fi/~ruohonen/GT_English.pdf.
[40] A. Alhroob, “Best Test Cases Selection Approach.,” in Scientific Cooperations International Workshops on Electrical and Computer Engineering Subfields., 2014.
[41] J. Das, “Bengali digit recognition using adjacency matrix.,” 2014. [42] R. L. Kaner, C., & Fiedler, Foundations of Software Testing.