Innovation – Globalization – Growth (Selected Relations)
Jiri Kraft
1, Ivana Kraftova
21Technical University in Liberec
Studentska 2, 461 17 Liberec, the Czech Republic e-mail: [email protected]
2
University of Pardubice
Studentska 95, 532 10 Pardubice, the Czech Republic e-mail: [email protected]
http://dx.doi.org/10.5755/j01.ee.23.4.2568
Both types of socio-economic processes are strongly influenced by dynamics of technical and technological progress connected with science, research and innovation. It is undisputed that all of these aspects are affected not only by market forces, but they also are significantly influenced by political and other microeconomic parameters including so-called soft factors of growth. On the whole, it influences directly or indirectly behaviour of individual economic actors, especially private businesses which can cause government interference by return and all together provoke the macroeconomic impact sui generis.
However, national economies are not isolated economic islands, but they are part of geographically defined economic units, as well as they may be part of institutionalized economic groupings.
This article focuses on the development of investment efficiency in the globalized world including the role of technical and technological progress.
The aim of the article is to capture differences in the development of wealth creation and allocated investments on continents with higher intensity of globalization processes i.e. after 1970. It will also assess the context of the sector structure of economies, particularly the global impact of intensive development of the tertiary sector and especially by continents. Particular attention is devoted to comparing the situation of two relatively small open economies the Czech Republic and Japan. They differ from each other by their relationship to integration groupings. The Czech economy is a small open economy and a part of the integration grouping - the European Union - since spring 2004. Japan is an island country, open in particular "way out", but still outside the integration grouping with a strong focus on its historical and cultural traditions. The authors are trying to answer the question to what extent and whether the integration of national economy affects positively its integration into higher integration units in the reality of the globalized world. Furthermore, they are trying to answer the question to what extent the dynamics of economic growth is affected by the ability of creation and use of science, research and innovation outcomes.
Both of these two main streams of reasoning are interconnected in a subsequent assessment of the effect of economic growth and competitiveness of both countries. Each country is related to other continent with different expected characteristics of sector structures and investment activities, while there also is a perception of non-economic factors affecting the achievement of prosperity in the background.
The fundamental basis is the holistic approach, which enables to perceive economic issues from taking a bird's-eye view, look away from specific details and enable them to subsequent return, especially since they affect the integrity in the result. It is possible to draw useful conclusions for potential acceleration of economic growth from these relevant facts. As a tool to achieve goals is the application of standard methods of economic research - abstraction, induction, deduction, comparison, analysis, synthesis, as well as appropriate statistical methods and graphical analysis.
Keywords: Integration, Globalization, Capital formation, Investment efficiency, Technical and technological progress.
Introduction
The phenomenon of globalization has deep historical roots related to the development of international trade and discovering new continents by the part of the world, whose products had the form of proprietary products. Globalization finds its theoretical background already in the first economic theory of mercantilism. The real theoretical basis is represented by the ideas of economists from the classical school of political economy (Smith, 1950).
At present, there has been increasing connection between economic growth and competitiveness of national
economies and innovative processes (OECD, 2005), (Nurmukhanova, 2008). Testimony is, for example, the Global Competitiveness Report published annually since 1979 by the World Economic Forum, together with Harvard University, and likewise the World Competitiveness Yearbook published by IMD1 in Lausanne, Switzerland.
Innovation performance of the economy (Nikolaev et
al., 2010) is usually evaluated by using input and output parameters (such as the European Innovation Scoreboard).
1
International Institute for Management Development
In the evaluation of the World Bank (CSO, 2006) technological advancement, cost of research and development, higher education, students in technical and natural sciences, patent applications per 1000 inhabitants, cooperation between universities and companies, access to capital for innovative business, administrative conditions for the establishment of new companies thus hard and soft factors are considered in terms of innovative potential of economies. Science, technology and innovation are often considered as the main driving forces of development and economic growth (Sirucek, 2005), (Daugeliene, 2008), (EK, 2010). At least since 2000 - along with the announcement of the Lisbon strategy aimed at transforming the EU until 2010 on 'the most competitive and dynamic knowledge-based economy in the world, capable of sustainable economic growth with more and better jobs and greater social cohesion' – is an integral part of EU policy (Eurostat, 2011).2
The basis of the current global economy can be truly considered TIT Technology (Kraft & Kraftova, 2009), (i.e. Transport - Informatics - Telecommunications). It not only allows globalization but also encourages its development as well as processes of internationalization, transnationalization and integration. After reaching a certain quantity of development of these processes and their consequences, it comes to a qualitative change (Watkins, 1963); (Kraft, 2003). Globalization, as a process, acquires new features. Initially it was working particularly with hard factors (technique, technology, capital resources) but soft factors begin to affect significantly the growth and competitiveness (Fric & Potucek, 2004). They are tax rates, tax regulation method, the level of bureaucracy, politics, government instability (Porter & Schwab, 2008), i.e. those which retard formation of the economic environment for business, more precisely for innovative
business (Alac et al., 2009). The consequences of
globalization are contradictory: on the one hand, a positive growth rate of market competition and increasing efficiency, on the other hand there is market failure and reducing efficiency.3
The novelty of the study is concerned with the evaluation of the investment effectiveness and the
2
2002 In Barcelona, a further aim was added, namely to spend by 2010 at least 3 % of GDP on research, two thirds of which should be financed by the business sector. 2005 The Lisbon Strategy was re-launched with the initiative 'Working together for growth and jobs'. 2006 At a Council meeting in Brussels, it was recognised that Europe should invest more in knowledge and growth. 2006-07 At the Spring European Councils, one of the four priority areas agreed upon by the Member States was more investment in knowledge and innovation. 2007 The European Commission launched the Green Paper 'The European Research Area: New Perspectives', a 'broad institutional and public debate on what should be done to create unified and attractive European Research Area'. (Eurostat, 2011)
3
Moreover, it sounds somewhat contradictory outcome of the representatives of the G20 in Seoul in this context, which did not bring the expected agreement on exchange rates and global trade. Robert Skidelsky likens the current situation to even the early 1930s of the last century, when monetary war resulted in the abandonment of the gold standard first British pound (1931), then the U.S. dollar (1933). U.S. is currently trying to devalue the dollar to boost exports at the expense of Chinese, Japanese and European producers. R. Skidelsky now sees the euro overestimated as the gold bloc in the 1930s and as one possible reaction of countries in euro zone countries to incline to protectionism. (Skidelsky 2010)
sensitivity of the wealth creation around the investment activities according to the continents in the reality of deepening globalization with the emphasis on the change of the pro-innovation industries within the tertiary sector and also with the comparison of the relationship between the innovation support and the economic growth in two economies with different attitudes towards the integration processes.
The main scientific problem is the reasoning about the convergence of the rate of investment effectiveness in all countries of individual continents due to impact of spill-over effects under globalization that is intensified by the dynamic growth of the transportation, informatics and telecommunication. This generates a question whether the economic integration can induce a change in the level of support for innovation and growth.
The aim of the paper is:
a) to evaluate the relation between the wealth and investment accumulation on individual continents, the position of which is constantly changing under globalization;
b) to capture the impacts of economic growth on the change of the tertiary sector share and onto the position of the pro-innovation industries (transportation, ICT), at the same time;
c) investigating whether the participation in the integration process can capture the change in the support for innovation and economic growth by using an example of the Czech Republic and Japan.
The object of the research is evaluation of the relationship between chosen indicators, the level of innovation (Technology Index, Gross Expenditure, R&D) and the level of economic growth (Growth Competitiveness Index, Gross Domestic Product) within a group of developed countries. It is expected that under the process of globalization there is a convergence of the rate of investment effectiveness and the sensitivity of wealth creation onto the investment activities across continents. Special indicators have been derived for the purpose of the analysis and these were monitored during the period of 1970 - 2009 and divided into four decades. The analysis follows with the evaluation of increasing share of the tertiary sector in the creation of the total value added as an impact of economic growth with the role of transport and ICT. The comparison of the Czech Republic and Japan is used to evaluate the development of the absolute value of GERD and the GERD relationship with GDP while analysing the impacts of the participation in the integration process on the support for innovation and economic growth. The level of success and growth is defined by the level of high tech exports share on one hand and on the other hand by the increase in the number of internet users as the effect of the innovation processes.
The applied holistic approach makes a significant contribution to fulfil the aim of this paper. It allows to ignore some specific details, but to return to them if necessary, especially since they affect ultimately the integrity then.
- 397 - synthesis, statistical and graphical analysis), the attention is focused on:
review of the links of selected indicators capturing the support and the consequences of TTE progress, respectively R&D and innovation,4
development efficiency of investment capital
resources allocated in total. It is measured by both the efficiency of investments (e), and sensitivity of wealth creation to the investment rate (s);
parallel to the inter-sectoral shift, respectively the development of the tertiary sector share in wealth creation.
Particular attention is paid to the assessment of selected parameters in Japan and the Czech Republic.
Influence of technical-technological-economic progress on processes of globalization and integration
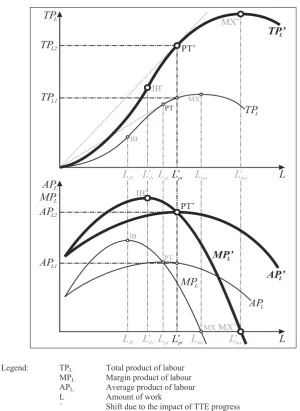
TTE is an important moment of progress in economic growth. Production functions capture this fact. Paradoxically, it is interesting to compare the facts of short run production functions It is meant two short terms going right after the other than one long run production function.
When comparing two consecutive short periods then it is apparent, that the same number of randomly chosen variable input is needed to create a much larger product in a second short term (where a progress in comparison with the first TTE progress has been demonstrated). However, this fact should be adequately reflected also in the marginal and average product (see Figure 1).
The product growth of companies has positive macroeconomic impact if quantity of inputs is constant and TTE progress is used. Macroeconomic impact projects primarily into GDP growth, which is generated from the growth in consumption, and therefore the purpose of economic activity is fulfilled. The important fact is that the phenomenon of globalization accelerates the progress of TTE. There is no doubt that globalization and integration processes influence development of national economies. It increases levels of competition between them thereby they place a greater emphasis on the development of factors which should affect positively the competitiveness of individual countries.
On the basis of development of selected indicators (GERD, GCI, TI and GDP)5,6 in 2004 and 2005 (i.e. years untouched by global financial and economic recession) in
EU countries7, Japan, USA and Norway, the relationship
4
Not only the technical-technological, but also economic types of innovations should be noted - such as financial innovation – which influence economic development because it allows the interconnection of economic entities in the allocation of available resources, see e.g. (Prášilová, 2010).
5
These indicators are included into the Global Competitiveness Report published by the World Economic Forum. GCI = Growth Competitiveness Index, is a general growth competitiveness index, which allows three sub-indices: the technological level of the economy, the level of public institutions and macroeconomic level. TI = Technology Index is a sub-index, which is composed of the three components: Innovation (6 criteria), information and communication technology (10 criteria), technology transfer (2 criteria). (SÚ, 2006)
6
GERD = Gross Expenditure on R&D, gross domestic expenditure on R&D are total internal expenditure on R&D performed in the national territory in a given period of time.(OECD, 1993)
7
Without Malta because lack of data.
was studied between GERD on the one hand, and GCI and TI on the other side. Furthermore, the sample was considered whether the direction and intensity of development of GERD correlates with the dynamics of growth of GDP. Depending on GERD size in % GDP, countries are divided into three groups:
I. GERD in the interval <3.62; 2.10> % of GDP report (in descending order): Sweden, Finland, Japan, USA, Germany, Denmark, Austria a France;
II. GERD in the interval <1.87; 1.06> % of GDP report (in descending order): Belgium, Netherlands, UK, Luxembourg, Norway, Slovenia, Czech Republic8, Ireland, Spain, Italy;
III. GERD in the interval <0.94; 0.37> % of GDP report: Hungary, Estonia, Portugal, Lithuania, Greece, Poland, Latvia, Slovakia, Bulgaria, Romania, Cyprus.
Given the structural link between the GCI and IT, the high degree of positive correlation between the two indices (more than 0.90) seem to be understandable More interesting, however, is that a higher degree of correlation exists between the Growth Competitiveness Index and GERD as % of GDP (0.83) than GERD in % of GDP and Technology Index (0.79). In contrast, the degree of correlation measured between relative increase GERD as % of GDP and the relative increase in GDP appears to be insignificant (less than 0.15). It is clear that this result reflects the absolute volume of GERD because there is undoubtedly critical amount of allocated funds that are needed to implement the TTE progress (innovation) on the basis of science and research. It is necessary to assess the efficiency and not only with the regard on wealth increasing, but also to change the structure of the economy, which can both contribute to the dynamics of growth of wealth and community development, so it can decelerate also.
The development’s effectiveness of investments and changes in sectoral structure
TTE progress, whose outcomes evidence in the individual economic entities through innovation from first to seventh order9, causes changes in their competitiveness, develops new products, new requirements to be met, and thus causes the overall changes in the intersectoral and sectoral structure of national economies, hence global economy.
8
The draft of National Reform Programme in November 2010 set a national target of the share of investment in R&D and innovation of 2.7% of GDP, of which 1% of national public resources in 2020.
9
Figure 1. Production fiction, average and marginal product of two consecutive short-term progresses and impact of TTE Source: own elaboration
Increasing productivity in the secondary and primary sector, whose outputs are tangible products, leads to the release of resources to services that meet the needs of their course and are associated mostly with higher labour. It is often based on specific knowledge, i.e. increased demand of the growth of human capital (Mateja, 2009). The socio-economic impact of investments into the infrastructure is also significant (Snieska & Simkunaite, 2009). The severity of the problem highlight the sectoral composition of the negotiations which are currently undertaken in preparation for the focus on the EU strategy for the planning period 2014-2020 (MMR, 2010).
Increase of the share of tertiary sector in wealth creation is indeed an expression of mature economies, but ultimately it delivers the same time reducing labour productivity.
The question is how the efficiency of allocated capital resources develops. It is measured both by the effectiveness of investments, and sensitivity of wealth to the level of
investment and to what intersectoral shift occurred, specifically how to change the share of tertiary sector in wealth creation.
Observed period 1970-2009 is divided into four decades, in which values of gross domestic product (GDP) and value gross capital formation (GCF) are counted. The effectiveness of the investment is assessed as a ratio of GDP totals and totals in each GCF decades (t).
݁ ൌ σ ீ
σ ீி (1)
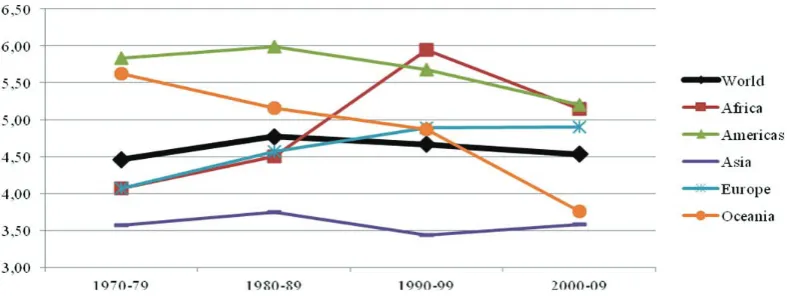
This indicator reflects the number of units per unit of GDP falls embedded gross investment (GCF). The development of efficiency of investments in different decades in the world and continents is shown in Figure 2.
Legend: TPL Total product of labour
MPL Margin product of labour
APL Average product of labour
L Amount of work
Figure 2. The development of efficiency of investment in the period 1970-2009 in the world and on the continents
Source: own elaboration (UNSTAT-c, 2011)
Figure 2 shows that the efficiency of investment was increasing worldwide only in the 1970s. There is a slight decline reported in the next decades, the world gets almost to its initial level. Africa shows a similar trend as in the whole world (on an upper level), the efficiency of investments in the Americas is growing in the first 3 decades, a significant decrease occurs in the first decade of the new century. Relatively Europe is the best, even if it is below the level of the Americas, but it has not been affected by fall in the last decade, but stagnation in terms of efficiency of investments. The worst situation is in the Pacific, where the efficiency of investment has been declining steadily and the decrease can be described as rapid in recent decades. The lowest level of investment is accompanied by the development of Asia, but excluding the third observed decade which is resulting in a decrease. It seems like positive development, although the mentioned decline was as a brake on further growth, so that the fourth decade of efficiency of investments has not overtaken the most successful 1980s.
Besides the degree of efficiency of investments in the creation of wealth, it is desirable to pay attention to the sensitivity of the response of wealth creation for investment activities. Analysis of the sensitivity degree was performed in the period 1970-2009 using the indicators:
ݏ ൌοீ ீοீி ீிΤΤ (2)
It expresses the extent to alter the relative increase in GDP to changes in the relative increase in investment (GCF) of the unit.
It was eliminated 20 outliers from 228 calculated values of sensitivity degree for needs of graphic design. 11 cases from the remaining 218 represent values in which the relative gains of the two compared variables (GDP and GCF) were negative. In 33 cases, the decline in investment (GCF) was accompanied by an increase in GDP, i.e. indicator of susceptibility reached a negative value.
Figure 3. Levels and trends of the sensitivity of growing wealth on investment growth - the world and continents Source: own elaboration
-3.00 -2.50 -2.00 -1.50 -1.00 -0.50 0.00 0.50 1.00 1.50 2.00 2.50 3.00
1970 1980 1990 2000 2010
World Africa Americas Asia
Europe Oceania Linear (World) Linear (Africa)
Linear (Americas) Linear (Asia) Linear (Europe) Linear (Oceania)
Figure 3 shows very interesting trends in the seemingly chaotic vibration of sensitivity parameters. There are seen significant positive developments in Africa in sensitivity indicators, but in Asia, which is also permanently close to 1 (from a unit increase in investment is obtained by a unit increase in wealth) and almost stable, but with some negative trend while a half-rate sensitivity than Asia are in America. In contrast, there is a significantly decreasing trend indicator of sensitivity apparent in Europe, where despite the above-mentioned positive development in the investment efficiency (compared to absolute values) is decreasing incremental effect of increases of inputs. A similar situation is in Oceania but in a much milder version, although the change is associated with a constant rate of descent of the
investment efficiency. The world as a resultant values shows a decreasing trend in the sensitivity of GDP growth on the growth of GCF. It is also a very interesting fact that at the end of 1990s of the last century, it comes to a moment that could be described as a "clash of trends" - on the one hand, Africa and Asia (increase), on the other hand continents, including the rest of the world as a whole (decrease).
In parallel with changes in investment efficiency and sensitivity of wealth creation to investment rate, there were going and still are ongoing changes in the share of tertiary sector in wealth creation measured by total value added (TVA). There are even changes in the tertiary sector, which is linked to TIT technologies i.e. statistically capturing group ISIC I. This is illustrated in Table 1.
Table 1
Share of tertiary sector of the economy on the face of the world and continents between 1970 and 2008
Share 3S in TVA (%) index 2008/1970
Share TSC in TVA (%) index 2008/1970
1970 2008 1970 2008
Africa 42 48 1.14 6 9 1.53
Americas 62 70 1.13 5 8 1.59
Asia 47 54 1.13 7 8 1.14
Oceania 62 71 1.14 7 12 1.82
Europe 56 66 1.17 6 9 1.53
World 56 63 1.12 6 8 1.46
Source: own elaboration based on data processing (UNSTAT-d, 2009)
Note: 3S = tertiary sector; TSC = Transport, storage and communication (ISIC I)
Share of tertiary sector in TVA increased in all continents between 1970 and 2008. While two continents (Africa, Asia) were below 50 % of the share in 1970 and none of the continents reached the 2/3 share, Africa was missing only 2 % to 50 % of share in 2008. The 2/3 share was reached or exceeded by 3 continents. The dynamic development was in Europe. Although the share of transport, storage and communications is high (in 1970 around 6 % and in 2008 around 9 % TVA), it is necessary to mention the dynamics of their growth period. It exceeds greatly the dynamic growth of the tertiary sector in all continents, with the exception of Asia, where both growth rates roughly the same.
Comparison of innovation and economic growth in the Czech Republic and Japan
When comparing rates of economic growth in the Czech Republic Japan measured by chain index of GDP, it is seen that the rate of economic growth is strongly influenced by economic cycles. The average growth index of GDP in 1993-2009 is 0.7 % in Japan. In the Czech Republic it is 2.7 % with respect to the lower level of economic development. The highest values of the growth index in Japan were measured between 2000 and 2004 and it was 1.028 and 1.027 respectively. The most successful years for rates of economic growth in the Czech Republic were years 2006 and 1995 with growth index 1.068 and 1059 respectively. Conversely, the biggest decrease was recorded in both countries in 2009 (Japan – 0.948, Czech
Republic – 0.959). It is interesting that the second largest decline in the period occurred in both countries at the same year and it was in 1998 (Japan – 0.980; Czech Republic – 0.992) but it does not reach the intensity of decrease in 2009.
- 401 - Figure 4a. The sensitivity of GDP on investment rates in the
Czech Republic and Japan in 1970-2010
Figure 4b. Share development of tertiary sector in the TVA in the Czech Republic and Japan in years 1993-2008 Source: own elaboration based on data processing (UNSTAT-C, 2011) Source: own elaboration based on data processing (WB, 2009)
Promotion of research which has been led by innovation and development indicates the level of expenditure allocated in this sector. In this regard Japan belongs to the top of the world with its share of GERD to GDP (e.g. between 2004 and 2005, the third highest
proportion in the world behind Sweden and Finland, the U.S. took 4th rank). The level of GERD in Japan and the Czech Republic of relative and absolute terms at the beginning of the new century is captured in Table 2.
Table 2
Comparison of GERD development in Japan and in the Czech Republic
If the period is divided into two parts (before joining the EU in 2004 and after), then you can compare the development of both countries and answer the question whether it would be this moment (ceteris paribus) to be considered as a pulse of change in the development of GERD. When comparing the average percentage of GERD to GDP, it is seen a higher value in the period of 2004-2007 in both countries (Czech Republic - 1.44; Japan – 3.33) compared to the values of the years 2000-2003 (Czech Republic – 1.22; Japan – 3.13). In both cases, a shift points by 20 %. With regard to the development of
GDP, it is a different situation when comparing the GERD growth index in PPP USD in both countries. In 2003/2000, growth index of this indicator in reached values of 1.23 in the Czech Republic, while in Japan, 1.14. Index in the following period, i.e. the Czech Republic in 2007/2004 amounts to 1.55, but in Japan only to 1.26. In terms of percentage points of the index in the Czech Republic rose by 32 percentage points, Japan's index of only 12 percentage points. This fact is also illustrated in Figure 5, which shows the evolution of the relationship (ratio) achieved values of the two countries in both relative and -1.5
-1 -0.5 0 0.5 1 1.5 2
1970 1980 1990 2000 2010
Japan CSSR/CR
Linear (Japan) Linear (CSSR/CR)
50 52 54 56 58 60 62 64 66 68 70
20
08
20
07
20
06
20
05
20
04
20
03
20
02
20
01
20
00
19
99
19
98
19
97
19
96
19
95
19
94
19
93
R Japan
R Japan
year GERD as % GDP GERD in PPP USD GERD as % GDP GERD in PPP USD
2008 1.47 3 767 938 . .
2007 1.54 3 803 030 3.44 147 938 883
2006 1.55 3 470 140 3.40 138 918 092
2005 1,41 2 947 590 3.32 128 694 314
2004 1.25 2 455 373 3.17 117 452 728
2003 1.25 2 296 384 3.20 112 275 339
2002 1.20 2 063 863 3.17 108 166 135
2001 1.20 1 992 429 3.12 103 992 393
2000 1.21 1 863 615 3.04 98 895 839
1999 . 1 672 503 3.02 92 773 977
absolute terms in GERD between 1999 and 2007. It sounds favourably for the Czech Republic, because Japan has been improving it in comparison with the value of this indicator
of development in, even it might be said that significantly after 2004.
Figure 5. Development of the relationship of GERD in Japan and in the Czech Republic in 1999-2007 Source: own elaboration based on data processing (UNSTAT-b, 2011)
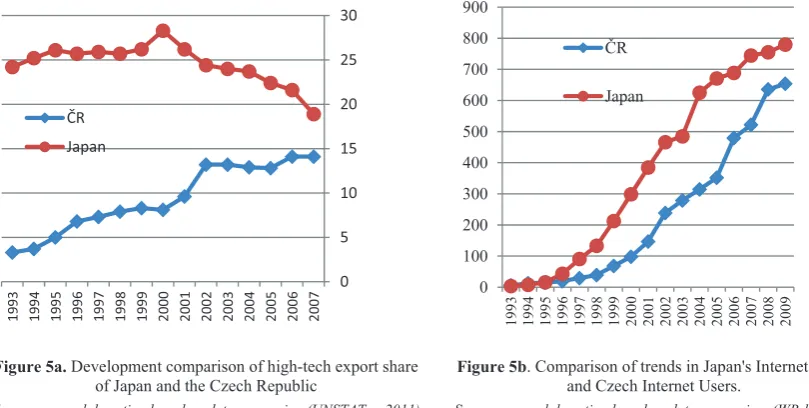
High-tech share of production exported is an important indicator of innovation performance for both compared open economies. Development of the share of such exports in total exports of the industrial sector is reflected in Figure 5a. Figure 5bshows an indicator of the number of Internet users, which can be seen not only as a result of innovative processes, but also as their default condition.
The proportion of high-tech production in industrial exports recorded trend changes around 2000 in both countries. It is a reversal from growth to decline in Japan. In the Czech Republic, the growth of this export segment continues over a short period of two years of high growth which is substituted by (noted with some simplification trend) stagnation.
Figure 5a. Development comparison of high-tech export share of Japan and the Czech Republic
Figure 5b. Comparison of trends in Japan's Internet users, and Czech Internet Users.
Source: own elaboration based on data processing (UNSTAT-e, 2011) Source: own elaboration based on data processing (WB-b, 2009)
Note: The comparison of the estimated number of Internet users is based on a comparison of statistical data to the middle class population for 1.7.2001. The number in the Czech Republic is counted from 16 + age cohort and in Japan from the 6 + age cohort. The number of Internet
users in the Czech Republic is counted per 100 inhabitants in Japan to 1000 inhabitants.
As regards the number of Internet users, the trend is very similar, but there is some loss of the Czech growth dynamics in 2009. It is estimated that the Czech Republic with its 10 million inhabitants have approximately 6.7 million Internet users (65 %). In Japan, which has
population of 127 million, it is estimated that over 99 million are Internet users (78 %). Certainly, this development has influenced both, the development of ICT and the linking of economies in the deepening integration and globalization process. For example, it can be observed
10.00 15.00 20.00 25.00 30.00 35.00 40.00 45.00 50.00 55.00 60.00
19
99
20
00
20
01
20
02
20
03
20
04
20
05
20
06
20
07
JP/R GERD in % GDP (*10) JP/R GERD in PPP USD
0 5 10 15 20 25 30
20
07
20
06
20
05
20
04
20
03
20
02
20
01
20
00
19
99
19
98
19
97
19
96
19
95
19
94
19
93
R Japan
0 100 200 300 400 500 600 700 800 900
1993 1994 1995 1996 1997 1998 1999 2000 2001 2002 2003 2004 2005 2006 2007 2008 2009
R
- 403 - in the Czech Republic the acceleration of growth in the number of Internet users just after 2004, which could have also been affected by a higher degree of interaction in the common European market.
Conclusions
It is obvious that the globalization and integration processes influence the development of national economies and increase the level of competition; thereby they place a greater emphasis on development factors, which should increase their competitiveness. It is essential that the influence of globalization and TTE progress is double-sided: globalization accelerates TTE progress; TTE progress accelerates processes of globalization.
In the longer term, initially increasing investment
efficiency changes to a decline. This development is not identical in all parts of the world; Europe is relatively the best in this respect. The lowest level of investment is in Asia but development trend is positive.
The world as resultant values of each continent represents a downward trend in the sensitivity of GDP growth on the growth of GCF (positive development in Asia and Africa, negative in Americas but also in Europe and Oceania). In the late 1990s, there was even a conflict of trends in this sense.
Proportion of tertiary sector, which along with its job nature brings lower labour productivity, has been increasing on all continents in the reference period of 40 years. Moreover, its share of the transport dynamics, storage and communications has also been increasing.
From the comparison of Japan and the Czech Republic, it is indicated that both countries have analogous development (but not in terms of level) in the GDP
indicator of sensitivity to the rate of investment, development of the share of tertiary sector in the TVA and the number of Internet users. The position of the Czech Republic has been improving in the development of GERD as % of GDP, so USD PPP (with a lower starting base in the period 1970 to 2007). The relationship between the evolution of the share of high tech exports has been changing similarly, e.g. for the benefit of assessment of development in the Czech Republic.
It is obvious that for the upcoming season it is needed to count with declining investment efficiency, the problematic GDP sensitivity on the level of investment, the sectoral and intersectoral changes, which will also lead to pressure on the quality and focus on innovation, innovation processes, but also a claim on the orientation of R&D.
In an effort to success in a globalized world, there will be an increased emphasis on strengthening high-tech industries and disciplines. This trend will express itself generally, but we can expect more intense competition, which should lead to higher efficiency of economic activities and wealth growth. The opposite effects would provide an economic irrationality, or even a system error.
Acknowledgements
This article was prepared with the support of the Grant Agency of the Czech Republic in connection with performing the research project No. 402/09/0592 „Development of economic theory in the context of economic integration and globalization“.
References
Alas, R., Ramanauskiene, J., & Martinkus, B. (2009). China and Estonia in Flux: is this a Valid Basis for Comparison of
their Approaches to Change Management? Inzinerine Ekonomika-Engineering Economics(2), 18-27.
Aroche-Reyes F (2003) A Qualitative Input-Output Method to Find Basic Economic Structure. Papers in Regional
Science, 82, 581-590. DOI: 10.1007/s10110-003-0149-z http://dx.doi.org/10.1007/s10110-003-0149-z
CSU (2006). Statisticka rocenka Veda a Technologie. Available from Internet: http://www.czso.cz/csu/2006edicniplan. nsf/publ/1005-06-2006
Daugeliene, R. (2008). The Streamline of Research and Experimental Development´s Infrastructure in Lithuanian National Innovation System. Inzinerine Ekonomika-Engineering Economics(2), 61-69.
EC (2010). Evropa 2020. Strategie pro Inteligentni a Udrzitelny rust Podporujici Zacleneni. Sdeleni Komise KOM, Brusel 3.3.2010
Eurostat (2011). Science, Technology and Innovation. Available from Internet: http://epp.eurostat.ec.europa.eu/
portal/page/portal/science_technology_innovation/introduction
Fric, P., & Potucek, M. (2004). Model Vyvoje Ceske Spolecnsoti a Jeji Modernizace v Globalnim Kontextu. Sociologicky casopis, 40(4), 415-431.
Kraft, J. (2003). Firma Vmakroekonomickem Prostredi. Usti nad Labem: Acta Universitatis Purkynianae.
Kraft, J., & Kraftova, I. (2009). The Influence of Globalization on Market Structure and Competitive Advantage of Selected Economies. Conference proceedings: 3th Central European Conference in Regional Science (CERS), October 7th-9th, Kosice, Slovak Rebuplic, 531-546.
Mateja, Z. (2009). Meeting of the Mission of Universities in Regions: Forms and Impact. Conference proceedings: 3th Central European Conference in Regional Science (CERS), October 7th-9th, 2009, KoSice, Slovak Rebuplic, 1191-1198. MMR: „CR a Budoucnost Kohezni Politiky“. Zapis zjednani 29. 11. 2010.
Nikolajev, S. D., Zajcev, A. V., Baranov, V. V., & Kraft, J. (2010). Intelekt Sovremennogo Predprijatija. Moskva: Komsomolskaja Pravda.
Nurmukhanova, G. (2008). Competitivness of National Economy: Problems of Regulation. E+M Economics and
Management, 4(11), 35-39.
OECD. (1993). Prirucka Frascati 1993. Praha : MSMT, 1998, str. 113.
OECD. (2005) Oslo Manual. The Measurement of Scientific and Technological Activities. Final Draft of the Third
Edition.
Porter, M., & Schwab, K.(2008). Global Competitiveness Report 2008-2009. Geneva: World Economic Forum. Available from Internet: http://www.gcr.weforum.org/documents/GCR0809/index.html
Prasilova, P. (2010). Rizikovy Kapital jako Hnaci sila Inovaci v Evropskych Zemich s Akcentem na Financni a
Ekonomickou Krizi. In The 10th International Conference IMEA 2010. Pardubice: University of Pardubice. 85.
Sirucek, P. (2005). Theory of Innovations by J. A. Schumpeter and its Elaboration by F. Valenta. E+M Economics and
Management, 3(8), 6-13.
Skidelsky, R. (2010). Nez povstane novy Hitler…Project Syndicate 2010. Ekonom, 4(48), 52.
Smith,A. (1950). An Inquiry into the Nature and Causes ot the Wealth of Nations (6th edition), Methuen & Co., Ltd., London 1950. Cesky preklad: Pojednani o podstate a puvodu bohatstvi národu. Praha : Liberalni institut, 2001.
Snieska, V., & Simkunaite, I. (2009). Socio-Economic Impact of Infrastructure Investments. Inzinerine
Ekonomika-Engineering Economics(3), 16-25.
UNSTAT. (1993). System of National Accounts 1993. Paragraphs: 16.82. Available from Internet: http://data.un.org
UNSTAT-a. (2011). Gross Domestic Expenditure on Research and Development (GERD), as a Percentage of GDP.
Available from Internet: http://data.un.org/Data.aspx?q=gerd&d= UNESCO&f=series%3aSTSCGERDGDP
UNSTAT-b. (2011). Gross Domestic Expenditure on Research and Development (GERD) in PPP. Available from
Internet: http://data.un.org/Data.aspx?q=gerd&d=UNESCO&f=series%3aST_SCGERDPPP
UNSTAT-c. (2011). GDP/Breakdown at Constant 2005 prices in US Dollars (all countries and regions). Available from
Internet: http://unstats.un.org/unsd/snaama/dnllist.asp
UNSTAT-d. (2011). GDP/Breakdown at Constant 1990 Prices in US Dollars (all countries and regions). Available from
Internet: http://unstats.un.org/unsd/snaama/dnlList.asp
UNSTAT-e. (2011). Estimated Internet Users. Available from Internet: http://data.un.org/Data.aspx?d
=ITU&f=ind1Code%3aI4212
Valenta, F. (1969). Tvurci Aktivita – Inovace – Efekty. Praha : Nakladatelstvi Svoboda.
World Bank-a. (2009). World Development Indicators 2009. Services, etc., value added (% of GDP). Available from
Internet: http://data.un.org/Data.aspx?d=WDI&f=Indicator_ Code%3aNV.SRV.TETC.ZS
World Bank-b. (2009). World Development Indicators 2009. High-technology exports (% of manufactured exports).
Available from Internet: http://data.un.org/Data.aspx?d=WDI&f= Indicator_Code%3a TX.VAL.TECH.MF.ZS
Watkins, M. H. (1963). A Staple Theory of Econoomic Growth. The Canadian Journal of Economics and Political
Science, 29(2), 141- 158. http://dx.doi.org/10.2307/139461
Kraft Jií, Kraftová Ivana
Inovacija – Globalizacija – Augimas (atrinkti ryšiai)
Santrauka
Apie globalizacijos procesus, jo reikšm pasaulyje jau užsimenama pirmojoje ekonominje merkantilizmo teorijoje. Tikr j teorin pagrind sudaro politins ekonomikos klasikins mokyklos ekonomist idjos. Šiuo metu vis labiau stiprja ryšys tarp ekonominio augimo ir konkurencijos, kuris atsiranda vykstant inovaciniams ekonominiams procesams tarp šali. Globalizacijos pasekms yra prieštaringos. Iš vienos puss: teigiamas rinkos konkurencingumo augimo tempas ir didjantis našumas, iš kitos puss: rinkos žlugimas ir efektyvumo mažjimas.
Šio darbo tikslas yra vertinti technin-technologin-ekonomin progres ir jo tak investicijoms bei pltrai vykstant globalizacijai pasaulyje; nustatyti ir vertinti gerovei kurti skirt investicij pltros skirtumus tam tikr žemyn, per gan intensyv globalizacijos proces laikotarp (t. y. po 1970), išsiaiškinti skirting šali sektori struktros pokyius, ypa tretinio sektoriaus intensyvios pltros tak ; palyginti situacij ekijos respublikoje ir Japonijoje, kurios abi yra santykinai mažos ir atviros ekonomikos, taiau tarp kit jos išsiskiria savo ryšiais su integracijos grupmis.
Taikytas holistinis metodas labai padeda pasiekti šio darbo tiksl . Ypatingas dmesys yra skiriamas tam atrinktiems parametrams Japonijoje ir ekijos respublikoje vertinti.
- 405 -
Tretinio sektoriaus, kuris pagal savo darbo prigimt duoda mažesn darbo našum , dalis gerokai padidjo visuose žemynuose per pastar j 40 met laikotarp. Taip pat padidjo jo gabenimo, sandliavimo ir komunikacij dalis.
Atliktoje Japonijos ir ekijos respublikos palyginimo analizje nustatyta, kad abiejose šalyse BVP rodiklio jautrumo investavimo norma, tretinio sektoriaus dalis, vertinant bendrai pridtin vert ir interneto vartotoj gaus , yra analogiški. Taiau ateityje reikia atsižvelgti mažjant investavimo efektyvum , problemišk BVP jautrum investavimo lygiui, pokyius sektoriuose ir tarp sektori, kurie taip pat susij su kokybe ir dmesiu inovaciniams procesams. Neatsiejami ir svarbs dalykai išlieka mokslini tyrim ir projektavimo konstravimo darbai.
Norint skmingai konkuruoti pasaulyje, ypating dmes reikia skirti aukštj technologij pramons ir disciplin stiprinimui. Ši kryptis dažniausiai pasireiškia pati, taiau reikia ne tik tiktis daug stipresns konkurencijos, bet ir numatyti bdus jai stiprinti, nes tai turi tak ekonomins veiklos efektyvumui ir gerovs augimui.
Raktažodžiai: integracija, globalizacija, kapitalo formavimas, investicij efektyvumas, techninis ir technologinis progresas.
The article has been reviewed.