USE
OF
THE
CONCEPT
OF
IVE
’S
FILTERABILITY
NUMBER
(F)
TO
DETERMINE
THE
EFFECTS
OF
VACUUM
SLUDGE
FILTRATION
PROCESS
J. Ademiluyi
1and J. I. Onwe
2,*1,2,
D
EPARTMENT OFC
IVILE
NGINEERING,
U
NIVERSITY OFN
IGERIA,
N
SUKKA,
E
NUGUS
TATE.
NIGERIA
E-mail addresses
:
1[email protected],
2[email protected]
ABSTRACT
The study highlights the laboratory use of the concept of Ive’s filterability number, ‘F’, recently formulated for sand filtration of wastewater. Ive,s Filterability Index Equation was modified and used to investigate the performance of
sewage sludge undergoing vacuum filtration process. A simple modified form of Coacklely’s laboratory apparatus has been described for the evaluation of ‘F’. A sludge filtration experiment according to standard procedure suggested by Coackley was mounted. In calculating sludge filterability number and other parameters of the Ive,s equation, vacuum
pressures of 20, 16, 12 and 8cmHg were used with the filter medium area of 23.6cm2. Four (4) sludge samples of
different concentrations obtained from the University of Nigeria, Nsukka treatment plant were prepared. The data generated were used to calculate filterability number F, filtrate volume, Vo and instantaneous velocity ‘Vi’, for each
filtration cycle. The values of ‘F’ for conditioned sludges were also evaluated from the data using regression analysis. On verification using the experimental data, the theorectical prediction of the modified equation was found to be in consonance with previous findings of other researchers. The filterability index from the generatd data was found to increase numerically with the applied vacuum pressures. Moreover, on verification with Alluminium Sulpahate (Al3SO4) on the effects of chemical conditioner on sludge filterability, it was observed that Filterability Index ‘F
decreased with increased chemical dosages with the following results: 0.025g/ml, 0.0188g/ml, 0.0130g/ml of Al3SO4
gave corresponding decrease in values of filterability ‘F as 5.764, 5.970 and 6.134 for 0.00259g/Cm3 sludge sample.
Similarly, sludge filterarbility showed an earlier increase with sludge initial solids content and reduced after the solids content was further increased with time, t. Such factors as pressure, initial solid content of sludge and chemical conditioning known to have effects on specific resistance and Sludge Dewaterability Number (SDN) have been found to have corresponding effects on sludge filterability index. These results further enhance the suitability of Ives filterability number concept as a measure of sludge filterability.
Keywords:Sludge, filterability Number, Vacuum, Specific Resistance
1. INTRODUCTION
The hazards created in our environment as a result of improper disposal of the end products of wastewater treatment need to be checked, managed and handled in a safe way. The sludge generated is a pollutant to our environment; therefore a consistent policy must be made as a safer means of disposing this sludge [1]. The sludge generated as a result of waste-water treatment are difficult to handle and dispose off because of the high percentage of moisture and its compressibility, hence, for proper safety management, it is necessary to dewater the sludge for healthy, easy handling and economic reasons before disposal [2].
Although, the cost of maintenance and operation of sludge treatment plant is very high. According to [3],
sludge handling accounts for 21 to 25 percent. Obviously as the sludge size reduces through dewatering, the transportation cost is reduced. Hence, the high cost of maintaining and operating the plant is minimized. Our environment needs cleaner rivers and streams to promote the health of the people. Hence, the need for intensive and efficient treatment of these sludges cannot be over- emphasized.
As a matter of fact, the issue of environmental pollution through sludge discharge has been overlooked over the years. Often, domestic and industrial wastes are being disposed by methods which create unhealthy environmental conditions like air, water and soil pollution.
Vol. 37, No. 2 April 2018, pp.
548 – 553
Copyright© Faculty of Engineering, University of Nigeria, Nsukka,Print ISSN: 0331-8443, Electronic ISSN: 2467-8821
As highlighted above, , a huge percentage of sludge is generated in the course of wastewater treatment operations [4]. The sludge generated increases due to coagulation processes resulting from the integrated treatment system. These have led to the search for scientific solutions to efficiently manage environmental pollution resulting from sludge generation.
Recent research has revealed that despite the fact that sludge volume is really less than 1% of the total plant influent, sludge handling costs are 21 - 50% of total plant operating and maintenance costs [5]. The Ives Filterability concept was successfully implored in this study to determine the relationship between the parameters of the equation.
The highly varied scope of sludge dewatering coupled with its relatively high capital and maintenance costs necessitates the need for intensive research into the understanding of sludge dewatering processes through the application of Ive,s Concept of Filtration initially
formulated for sand water treatment [6].
2. THE CONCEPT OF IVE’S FILTERABILITY NUMBER EQUATION
Filterability index equation as developed by Ives has over the years been applied in sand water treatment processes unlike Sludge Dewaterability Number (SDN) which finds its application in sludge filtration processes. Sludge characteristics like concentration, source and type, dilution, pressure and chemical conditioning influence sludge filtration process. This classification can be an important tool in waste water management.
The applicability of Ives [7] filtration equation to vacuum sludge filtration process would go a long way in establishing empirical relationship between sludge filterability index and volume of filtrate, pressure, filtration time, solid contents and as well as flow rate.A suspension is considered to be filterable if it can pass rapidly through a porous medium giving a clear filtrate, with no or little clogging on the filter medium. Similarly, a filtration process is considered to be adequate when the filterability number F is low. This is achieved with a low headloss, low permeate concentrations and a high approach velocity.
Ive [7] proposed an equation for the determination of wastewater filterability given as;
)
1
(
1 o fC
t
V
HC
F
Where: ΔH = Change in headloss (CmHg), Co = Sludge
concentration (g/cm3), Cf = Filtrate concentration
(g/cm3), Vi = Instantaneous velocity (cm/s), t =
Filtration time (s)
The parameters Co and Cf imply that cake is formed
during sludge filtration process. Hence, F takes into account the flow rate, headloss, filtrate and sludge concentrations and time.
It is obvious from equation that the lower the F, the more filterable a sludge is and the higher the cake quality. However, since F has not been derived vigorously from filtration theory, it can’t be used at extreme values or under boundary conditions. However, from the equation, negligible values of ΔH would result with very coarse media and could lead to Cf/Co approaching unity, and again preventing further
filtration process.
2.1 Applicability of Ive’s Equation to Vacuum Sludge Filtration Experiment
The study has the sole aim of applying [7] filterability index equation to vacuum sludge filtration process with the specific objectives of high lighting the experimental use of the concept. This is against the applications of the traditional filtration equations suggested by [8] and [9]. It has also been discovered in literature that the traditional equations were embedded with uncertainties in the areas of formulating them. The model developed by [8] was based on non-compressible sludge cakes. In his equation, he stressed that specific resistance is constant throughout the sludge cake thickness and he suggested the need to define minimum and maximum specific resistances as a means of justifying the application of the equation. Hence, in the application of the Ive,s modified equation
as proposed, the effects of sludge characteristics like pressure, initial solid contents, time of filtration and dosages of chemical conditioners on the sludge filterability were investigated and analyzed accordingly. It is important to note that the applicability of the concept to vacuum sludge filtration process would go a long way in establishing the empirical relationship between sludge characteristics outlined above. This classification can be an important tool in wastewater management.
2.2 Modification of Ive’s 1978 equation
In order to investigate and analyze sludge samples undergoing vacuum filtration process properly, Ives equation has to be modified. The filterability index equation is given by Eq. (1). Now,
2 But instantaneous velocity:
Where: V0 is the volume of filtrate (cm3), Q is the flow
rate (cm3/s) and A is the filtration area (cm2).
Combining equations (2) and (3),
4 Inverting equation (4) gives:
5
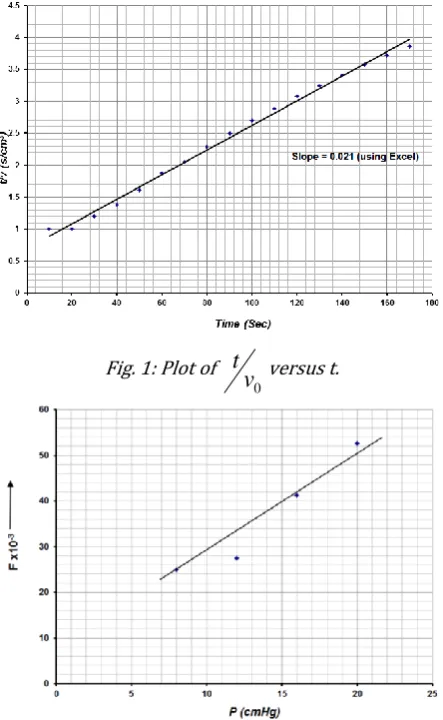
A plot of t/Vo against t gives a straight line with slope,
6 It has been established in the specific resistance equation propsed by [8] and recent work by [9] that the only way through which a sludge filtration theory can be taken to describe sludge dewatering process is when the equation’s plot of t/v against V yields a straight line. Based on the above, Ives equations conformed favorably.
Equation (5) above obeys [10] postulation where he stated that the only way by which a sludge filtration theory can be taken to describe sludge dewatering process is when the equation’s plot of t/v against V yields a straight line. Based on the above, Ives equations conformed favorably. This was also in agreement with the findings of [8] where he found the values of specific resistance from the plot of t/v and v to be a function of the sludge characteristics.
3. MATERIALS AND METHOD
Coakley [11] designed a traditional laboratory filtration apparatus based on Carman's theory. It is commonly known as Buchner funnel apparatus. The following steps were taken in carrying out the experiment;
Samples of digested sludge were obtained from the UNN wastewater treatment plant. Four different volumes of sludge were prepared to obtain concentrations of total solids in the sludge before adding the conditioning agents. Varying amounts of Al3SO4 conditioner were provided and mixed with 50
ml of sludge samples: The Buchner funnel arrangement was prepared as shown in Figure 1. The area of the funnel, the area of the filter paper and that of the woven wire drainage base were recorded. Prior to the filtration process, the filter paper was sealed by moistening it before placing it in the funnel; this was followed by adjusting the vacuum accordingly. Conditioning of sludge sample was then performed prior to filtration by mixing and flocculating for few seconds. Vacuum at zero time was applied and the filtrate volume recorded. Sludge sample was then poured into the funnel and manometer reading taken every ten seconds. Filtration process was continued until the vacuum broke or until almost all filtrate has been collected. Volume of filtrate obtained was recorded. Stop watch was used to measure the time of filtration.
4. PROCESS DESCRIPTION
To evaluate the parameters in equation (1) above, values of Cf, C0, F, V0 and Vi were calculated for each
filtration cycle. This is because F is a function of sludge concentrations, filtration area, and time at any given operating pressure (vacuum). Moreover, rate of filtration was evaluated for a given run using equation (3). For convenience, four (4) sludge samples with different concentrations were used for the analysis.
In calculating sludge filterability number F, and other parameters of the Ives equation, vacuum pressures of 20, 16, 12 and 8cmHg were used with the filter medium area of 23.6cm2.
The data generated were used to calculate filterability number F, filtrate volume and instantaneous velocity ‘Vi’, for each filtration cycle using regression analysis
and equation (5).
5. RESULTS AND DISCUSSION
The plot of versus t/Vo as shown in Figure 1 gives a straight-line hence, obeys [10] postulation where he stated that the only way by which a sludge filtration theory can be taken to describe sludge dewatering process is when the equation’s plot of t/V against V yields a straight line. Based on the above, Ives equations conformed favorably. This was also in agreement with the findings of [8] and [12] where they all found the values of specific resistance from the plot of t/V and V to be a function of the sludge characteristics.
Fig. 1: Plot of
0
v
t
versus t.Fig. 2: Variation of filterability, F with Pressure (p)
5.1 Effects of Pressure on Sludge Filterability, F
The experimental result of the research conducted to investigate the effects of pressure on sludge filterability is shown on figure 2. The graph shows that sludge filterability number, F increases with increasing pressures for different sludge concentrations stated. This was in agreement with results obtained from Carman’s theory and earlier work done by [13] when they respectively observed that specific resistance and sludge Dewaterability Number (SDN) increases with pressure. In other words, filterability decreases with increases in pressure as a result of decrease in cake porosity.
5.2 Effects of Initial Solid Contents on Sludge Filterability, F
Figure 3 shows the effects of initial solid contents (C0)
on F. The graph indicated that F increases with increasing solid contents and falls after a time, t. Filterability can increase or decreases with increasing solid contents according to the Carman’s classical theory. It has been documented in literature that specific resistance of irregular shaped particles increases with the increasing solid contents. This accounts for the increasing trend of F with increasing solid content of sludge samples tested.
Moreover, at the beginning of the experiment, sludge filterability increased linearly with solid content (C0)
until after a time t, when it began to fall with increased Co. The reason for the anomaly may be due to the
digestion of the sludge which enhanced sludge particles breaking to form more fines which eventually blocked the available pores in the cake thereby lowering filterability.
In other words, as filtration progressed, more cakes were deposited which blocked the pores of the filter medium reducing further filtration.
5.3 Effects of pressure on Filtration time
From Figure 4, Pressure does have effects on filtration time. At higher pressures, filtration time tends to decrease while at lower pressure sludge filtration time increases. However, the effects of pressure on filtration time are grossly affected by other parameters of the Ive’s [1] equation. Such parameters included solid contents and filtration area.
Fig. 3: Plot of F against initial solid contents Co
Figure 4. Effect of pressure (p) on filtration time (tf)
Figure 5. Graph showing the effects of chemical conditioners on F at various concentrations (C1 – C3)
5.4 Effects of Chemical Dosages on Sludge Filterability and Time
Figure 6 shows the effects of coagulants on the sludge filterability, F. Generally, there is a fall in F (improved filterability) at initial conditioning until some optimum values were reached. The lowering effects of the
dosages on F may be due to its coagulating effects on the fines. The increased porosity of the cakes is induced by the conglomeration of the lesser particles by the conditioners. The increment was further enhanced by the corresponding increase in the operating conditions such as pressures and the concentrations of the sludge samples as shown in the data generated.
The graph (Figure 5) conformed to the earlier works of Ademiluyi [14] which stated that as the rate of conditioning increases, sludge dewaterability decreases. Based on the above, Ives equation conforms favorably. Moreover, the effectiveness of Al3SO4 in
lowering filterability is in consonance with the previous findings of [14] where he maintained that larger particles formed after coagulation prevents the blocking of the filter medium leading to faster flow rate of filtrate or a decreased filterability index.
Figure 6 shows the effects of chemical conditioners on filtration time. From literature and data generated in this experiment, it was evident that filtration time decreases with increased dosages of the chemical conditioners. At higher dosages, filtration time reduced considerably. This is due to the conglomeration of fines leading to the formation of more porous cake which eventually led to improved filterability and accelerated filtration time.
Figure 6: Variation of Filtration Time tf with Weight of
Conditioners used
6. CONCLUSIONS
Sludge filterability number, F proposed by [7] for use in routine laboratory work is a useful parameter in evaluating and analyzing filterability of different sludge samples as well as sludge characteristics.
chemical conditioning which affect Sludge Dewaterability Number (SDN), specific resistance have been found from this research to have the same profound effects on the Sludge filterability Index (F).
7. RECOMMENDATION
The work is recommended for use in the vacuum/pressure filtration of compressible sludge cake. Further research work, there is need to develop or further modify the equation to account for other sludge parameters such compressibility coeffiecent and viscousity.
8. REFERENCES
[1] Sunil J. K and Ajaygiri K. G. “Characterization, Treatment and Disposal of Sludge: A Review ” International Journal for Research in Applied Science & Engineering Technology. Vol. 2, December, 2014, pp 516.
[2] Ademiluyi, J. O. and Eze, B. I, “FMTLxLyLz Dimensional Equation for Drying Beds”, Nigerian Journal of Technology, Vol. 33, No. 3, July 2014, pp. 363 – 374.
[3] Randal C.W , Turpin J.K And King P.N, Activated sludge dewatering. JWPCF, Vol. 43. No. 1 pp. 102-122, 1971.
[4] Ajah, K.C.. “Studies on the Cracking Time of Sludge Cakes” M. Engr Thesis, UNN. 2010.
[5] Randal, C.W. and King, P.H.. “Activated Sludge Dewatering”. Journal of Water Pollution Control Federation, Randal, C.W. and King, P.H.. “Activated Sludge Dewatering”. Journal of Water Pollution Control Federation. 102, Vol. 43, No. 1, pp. 102 – 122, 1971.
[6] Onosakponome O. R and Onyejekwe, S. C., “Systematic Modeling of Sludge Filtration Process Using Dimensional Analysis Technique”, Int. Journal of Engineering Research and Applications.Vol. 4, Issue 6June 2014, pp.43-53. [7] Ive, K. J., “A new concept of filterability’ Progress in
Water Technology. Vol. 10, pp 123-127, 1978. [8] Carman, P.C. “A Study of Mechanism of filtration
Part II”, Journal of the Society of Chemical Industry, Vol. 53, No.6. 1591-1657, 1934
[9] Afangiden, C. B., Ademiluyi, J. O. and Nnaji, C. C. “LMT Sludge Filtration Equation using Dimensional Analysis” The Pacific Journal of Science and Technology, Vol. 12, No. 2, pp. 572 – 519, Nov. 2011
[10] Ademiluyi, J. O. and Egbuniwe, N. Modified Equation of Sludge Filtration” Proceedings of the Engineering Section of Science Association of Nigeria, pp. 13 – 15, July 1984.
[11] Coackley, P. Laboratory scale filtration experiments and their application to sewage sludge dewatering Biological Treatment of seqage and Industrial Wastes. Edited by McCabe and Eckenfelder, Reinhold pub.Corp. New York, pp 270-290. 1958.
[12] Anthony G. “LMT Dimensional Equations for Drying Bed” University of Nigeria Virtual Libray, pp 48-50, 2014.
[13] Ademiluyi, J. O. and Egbuniwe, N. “Constant Vacuum Cake Filtration Equations for Compressive Sludge” The Nigerian Engineer, Vol. 23, No. 1, pp. 58 – 67, 1988.