Electronic Journal of Plant Breeding, ISSN 0975-928X
DOI: 10.5958/0975-928X.2016.00011.9
http://ejplantbreeding.com 78
Combining ability studies for yield and yield components in groundnut
(
Arachis hypogaea
)
M.Vaithiyalingan
Address for correspondence: Asst .Professor (PBG), Oilseeds Research Station, Tindivanam, Tamil Nadu.
(Received: September 2015; Accepted: December 2015)
Abstract
Combining ability analysis of 20 hybrids developed through line x tester mating design in groundnut. Additive gene action was predominant for all the characters studied except for harvest index and pod yield / plant. The genotypes ICGV 07240 and TVG 0856 recorded significant gca effects along with high mean for plant height, root length, harvest index and pod yield / plant. Hence, these genotypes were categorized as good combiners. Based on the mean and gca effects involving the above parents in crossing programme could result in improvement in pod yield. Among the crosses, ICGV 07240 x JDR 65 registered significant sca effects along with mean. Hence pedigree breeding method could be adopted to isolate desirable recombinants. However, the cross, TVG 0831 x RG 426 involved parents with poor combiners. Hence, biparental mating followed by selection is recommended for the identification of desirable recombinants.
Key word: Groundnut, Combining ability, gca, sca,`
Introduction
Groundnut (Arachis hypogaea L.) is the major oilseed as well as food legume crop in India accounting for 20% of oilseed area and 23% of oilseed production in the country (Anonymous 2013). India is the second largest producer of groundnut in the world with annual production of over 5.5 million tonnes. Gujarat, Tamil Nadu, Andhra Pradesh, Rajasthan and Karnataka are the leading producers in the country and accounts for nearly 85% of the total output. Tamil Nadu is one of the leading groundnut producing state with an area, production and yield of 3.39 lakh hectares, 7.85 lakh tonnes and 2314 kg/hectare, respectively (Anonymous, 2014). Groundnut is grown mostly under the rain-dependent situations during rainy(June-September) season and it accounts for 70% of total groundnut area in the state. Though the groundnut productivity of the state is still the highest among the different groundnut growing states in the country, the groundnut yield realized over the years showed fluctuations because of frequent changes in the rainfall pattern and also owing to long spell of drought experienced during the crop growth period. The groundnut plant is drought tolerant and is grown in many areas of the world where most other food legumes fail to produce a crop. However, insufficient water at the time of flowering and fruiting significantly reduces the pod yield in groundnut (Wright and Nageswara Rao,
1994). Though several agronomic interventions to conserve the soil moisture and enhance the water use efficiency (WUE) (Hebbar et al., 1994) are advocated, identifying groundnut genotypes tolerant to drought offers the best long term and cost effective solution. Drought is the major abiotic stress factor affecting yield and quality of rainfed groundnut worldwide. Yield losses due to drought are highly variable in nature, depending on the timing, intensity and duration of the drought coupled with other specific environmental factors such as high levels of irradiance and high temperatures (Vision 2025, DGR, Junagadh). In order to evolve the high yielding drought tolerant groundnut cultures, the present study was takenup. Various biometrical methods have been successfully employed to assess the genetic makeup of different genotypes for developing suitable breeding methodology. One such method is the line x tester analysis (Kemthorne, 1957) which provides valid information on combining ability effect of phenotypes. Accordingly, the present study was undertaken to estimate the combining ability effects for yield and its component characters in groundnut.
Materials and methods
Electronic Journal of Plant Breeding, ISSN 0975-928X
DOI: 10.5958/0975-928X.2016.00011.9
http://ejplantbreeding.com 79
identified as donor for early stage drought tolerant genotypes viz., JDR 65, JDR 66, R 2001-2 and RG 426 (Anonymous, 2007) are involved in crossing programme. The 20 F1s were evaluated along with their parents in a randomized block design with two replications at Oilseeds Research Station, Tindivanam during Rabi (December – April) 2013-14 with a spacing of 30 x 10cm. The recommended package of practices were followed throughout the growth period. Biometrical observations were recorded on days to 50% flowering, plant height, branches per plant, pods per plant, root length, SPAD chlorophyll meter reading, dry matter production, harvest index and pod yield / plant. The combining ability analysis was carried out following Kempthorne (1947).
Results and discussion
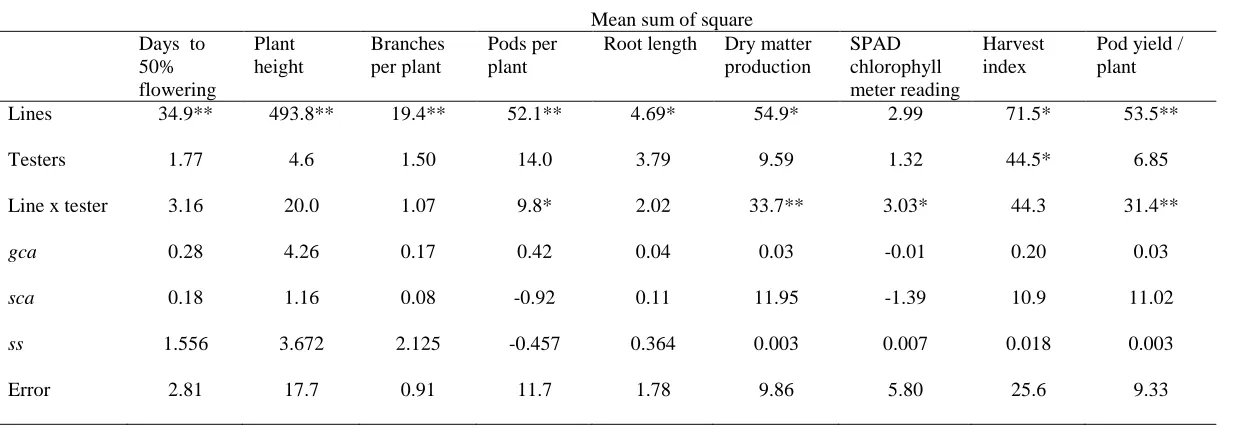
The mean square due to lines and tester were highly significant for the traits indicating the diverse nature of parents studied (Table 1). Due to the diverse nature of lines and testers, the crosses between them are also found to be significant for all the traits. Significant nature of line x tester interaction for pods per plant, dry matter production, SPAD chlorophyll meter reading and pod yield /plant indicated the importance of specific combining ability. The variance due to sca was greater than the gca for harvest index and pod yield / plant which indicated the preponderance of non-additive gene action in expression of these traits. This was in the agreement with the findings of Rekah et al.2009, Mothilal and Ezhil (2010) and Mothilal and Jayaramachandran, (2014).
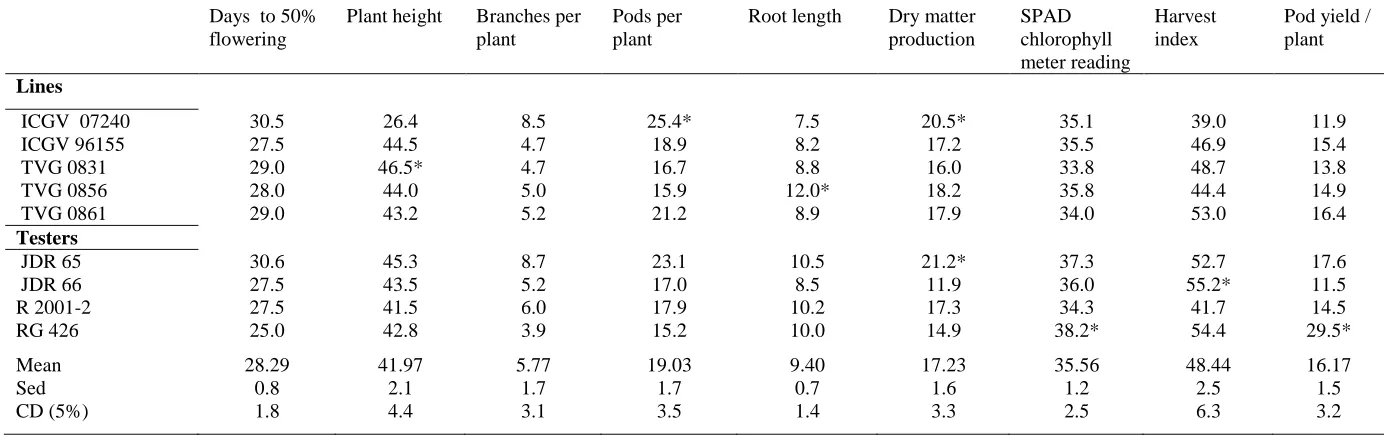
The first criteria for selection of desirable parent is its per se performance for the trait of interest. Among the nine parents evaluated in the present study, the line parent ICGV 07240 recorded significantly superior per se performance of pods per plant, dry matter production. Like wise, TVG 0856 recorded significantly superior mean performance for root length and harvest index (Table 2). Hence the parent may be chosen as a best parent. The tester parent JDR 65 had significantly higher dry matter production and harvest index. The tester parent JDR 66 recorded significantly higher harvest index. The tester RG 426 recorded superior mean performance for SPAD chlorophyll meter reading.
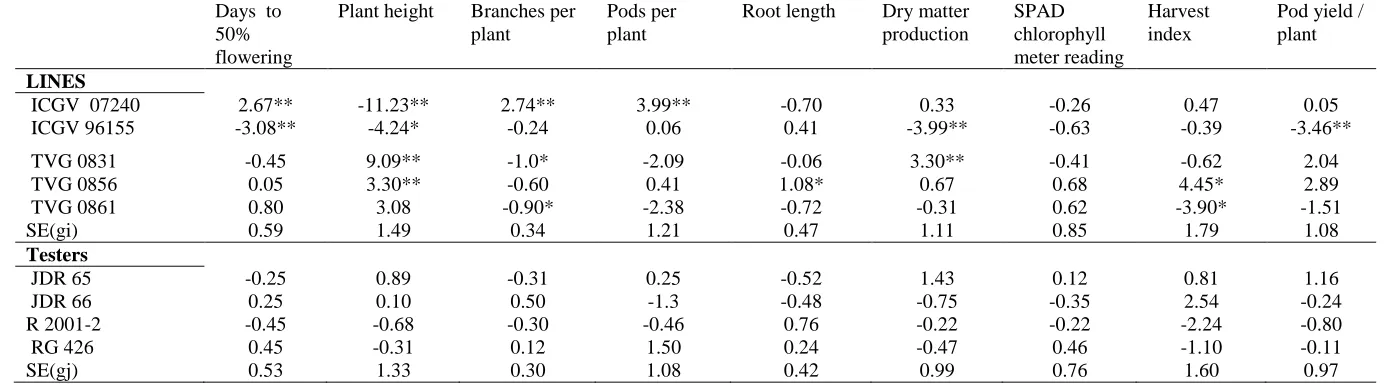
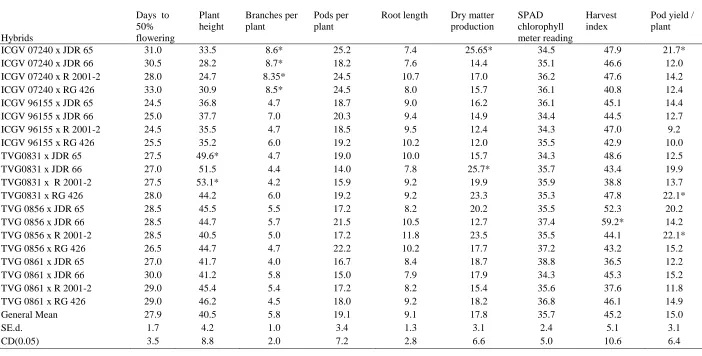
In certain cases, high per se performing parents may not transmit their superior traits to their offsprings. Hence general combining ability effect is considered as the second criteria of selection of superior parents. The line parent ICGV 07240 recorded significant gca effect for days to 50% flowering, plant height, branches per plant, pods per plant (Table 3). Similarly, TVG 0856 recorded superior performance for root length, harvest index and pod yield / plant. Perusal of the per se performance of 20 crosses revealed that the cross ICGV 07240 x JDR 65 registered significantly higher per se performance for pod yield / plant and branches per plant and dry matter production. (Table 4). Among the crosses, TVG 0831 x RG 426 recorded significant per se performance for pod yield / plant, TVS 0831 x JDR 66 for dry matter production and the cross TVG 0856 x JDR 66 for harvest index.
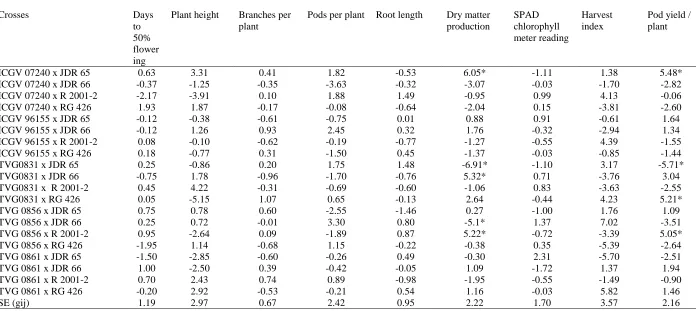
According to Sprague and Tatum (1942), the specific combining ability are contributed by non additive gene action. In contrast to the gca effect being attributed to additive geometric effects, sca effects denote dominance and epistatic effects that are not fixable components of genetic variation. The cross ICGV 07240 x JDR 65 registered significant sca effect for pod yield / plant and dry matter production (Table 5). Appreciably their per se performance for pod yield / plant, dry matter production was also significantly higher. In the cross the parents involved are good combiners for the aforesaid traits. Such cross could be exploited through pedigree breeding which may give superior performing segragants in the later generations. Further cross TVG 0831 x RG 426 exhibited significant sca effects for pod yield / plant. The cross involved parents with poor combiners indicating operation of non additive gene action in controlling these traits. Hence biparental mating followed by selection might be worthwhile for fostering greater recombination in this cross (Francier and Ramalingam, 1999).
Electronic Journal of Plant Breeding, ISSN 0975-928X
DOI: 10.5958/0975-928X.2016.00011.9
http://ejplantbreeding.com 80
Hence pedigree breeding method could be adopted to isolate desirable recombinants. However, the cross TVG 0831 x RG 426 involved parents with poor combiners. biparental mating followed by selection
may be recommended for developing genotypes with desirable attributes.
References
Anonymous 2007 Proceedings of AICRP (G) Kharif 2007 workshop.
Anonymous 2013 Statistical year book, 2013. Ministry of statistics and programme implementation. New Delhi
Anonymous 2014 Statistical hand book of Tamil Nadu, 2014, Department of Economics and statistics, Government of Tamil Nadu
Francies, R. and Ramalingam , R.S. 1999. Combining ability in groundnut. Legume Research, 22 (4): 267 – 269.
Hebbar, K. B., Sashidhar, V. R., Udayakumar, M., Devendra, R. and Nageswara Rao, R. C. 1994. A comparative assessment of water use efficiency in groundnut (Arachis hypogaea) grown in containers and in the field under water-limited conditions. J. Agr. Sci., 122:429–434.
Kempthorne, O. 1957. An introduction to genetic statistics. John Wiley and Sons. Inc. New York.
Mothilal, A. and Jayaramachandran, M. 2014. Combining ability for kernel yield and its component traits in groundnut. J. Oilseeds Res., 31(1): 17-21. Mothilal, A. and Ezhil, A. 2010. Combining ability analysis
for yield and its components in groundnut (Arachis hypogaea L.). Electronic Journal of Plant breeding. 1(2): 162-166.
Rekha, D., Savithrramma D. L, Shankar, A. G. and Marappa, N. 2009. Combining ability studies for growth and yield traits in groundnut Arachis hypogaea). Environment and Ecology. 27(1): 117-120.
Sprague, G. R. and Tatum, A. 1942. General vs specific combining ability in single crosses of cotton. J.Amers. Soc. Agron. 34; 923-932.
Electronic Journal of Plant Breeding, ISSN 0975-928X
DOI: 10.5958/0975-928X.2016.00011.9
http://ejplantbreeding.com 81
Table 1. Analysis of variance for combining ability for yield and yield components in groundnut Mean sum of square Days to
50% flowering
Plant height
Branches per plant
Pods per plant
Root length Dry matter production
SPAD chlorophyll meter reading
Harvest index
Pod yield / plant
Lines 34.9** 493.8** 19.4** 52.1** 4.69* 54.9* 2.99 71.5* 53.5**
Testers 1.77 4.6 1.50 14.0 3.79 9.59 1.32 44.5* 6.85
Line x tester 3.16 20.0 1.07 9.8* 2.02 33.7** 3.03* 44.3 31.4**
gca 0.28 4.26 0.17 0.42 0.04 0.03 -0.01 0.20 0.03
sca 0.18 1.16 0.08 -0.92 0.11 11.95 -1.39 10.9 11.02
ss 1.556 3.672 2.125 -0.457 0.364 0.003 0.007 0.018 0.003
Error 2.81 17.7 0.91 11.7 1.78 9.86 5.80 25.6 9.33
Electronic Journal of Plant Breeding, ISSN 0975-928X
DOI: 10.5958/0975-928X.2016.00011.9
http://ejplantbreeding.com 82
Table 2. Mean performance of parents for different characters in groundnut Days to 50%
flowering
Plant height Branches per plant
Pods per plant
Root length Dry matter production
SPAD chlorophyll meter reading
Harvest index
Pod yield / plant
Lines
ICGV 07240 30.5 26.4 8.5 25.4* 7.5 20.5* 35.1 39.0 11.9
ICGV 96155 27.5 44.5 4.7 18.9 8.2 17.2 35.5 46.9 15.4
TVG 0831 29.0 46.5* 4.7 16.7 8.8 16.0 33.8 48.7 13.8
TVG 0856 28.0 44.0 5.0 15.9 12.0* 18.2 35.8 44.4 14.9
TVG 0861 29.0 43.2 5.2 21.2 8.9 17.9 34.0 53.0 16.4
Testers
JDR 65 30.6 45.3 8.7 23.1 10.5 21.2* 37.3 52.7 17.6
JDR 66 27.5 43.5 5.2 17.0 8.5 11.9 36.0 55.2* 11.5
R 2001-2 27.5 41.5 6.0 17.9 10.2 17.3 34.3 41.7 14.5
RG 426 25.0 42.8 3.9 15.2 10.0 14.9 38.2* 54.4 29.5*
Mean 28.29 41.97 5.77 19.03 9.40 17.23 35.56 48.44 16.17
Sed 0.8 2.1 1.7 1.7 0.7 1.6 1.2 2.5 1.5
CD (5%) 1.8 4.4 3.1 3.5 1.4 3.3 2.5 6.3 3.2
Electronic Journal of Plant Breeding, ISSN 0975-928X
DOI: 10.5958/0975-928X.2016.00011.9
http://ejplantbreeding.com 83
Table 3. General combining ability effects of parent for different characters in groundnut Days to
50% flowering
Plant height Branches per plant
Pods per plant
Root length Dry matter production
SPAD chlorophyll meter reading
Harvest index
Pod yield / plant
LINES
ICGV 07240 2.67** -11.23** 2.74** 3.99** -0.70 0.33 -0.26 0.47 0.05
ICGV 96155 -3.08** -4.24* -0.24 0.06 0.41 -3.99** -0.63 -0.39 -3.46**
TVG 0831 -0.45 9.09** -1.0* -2.09 -0.06 3.30** -0.41 -0.62 2.04
TVG 0856 0.05 3.30** -0.60 0.41 1.08* 0.67 0.68 4.45* 2.89
TVG 0861 0.80 3.08 -0.90* -2.38 -0.72 -0.31 0.62 -3.90* -1.51
SE(gi) 0.59 1.49 0.34 1.21 0.47 1.11 0.85 1.79 1.08
Testers
JDR 65 -0.25 0.89 -0.31 0.25 -0.52 1.43 0.12 0.81 1.16
JDR 66 0.25 0.10 0.50 -1.3 -0.48 -0.75 -0.35 2.54 -0.24
R 2001-2 -0.45 -0.68 -0.30 -0.46 0.76 -0.22 -0.22 -2.24 -0.80
RG 426 0.45 -0.31 0.12 1.50 0.24 -0.47 0.46 -1.10 -0.11
SE(gj) 0.53 1.33 0.30 1.08 0.42 0.99 0.76 1.60 0.97
Electronic Journal of Plant Breeding, ISSN 0975-928X
DOI: 10.5958/0975-928X.2016.00011.9
http://ejplantbreeding.com 84
Table 4. Mean performance of crosses for different characters in groundnut
Hybrids
Days to 50% flowering
Plant height
Branches per plant
Pods per plant
Root length Dry matter production
SPAD chlorophyll meter reading
Harvest index
Pod yield / plant
ICGV 07240 x JDR 65 31.0 33.5 8.6* 25.2 7.4 25.65* 34.5 47.9 21.7*
ICGV 07240 x JDR 66 30.5 28.2 8.7* 18.2 7.6 14.4 35.1 46.6 12.0
ICGV 07240 x R 2001-2 28.0 24.7 8.35* 24.5 10.7 17.0 36.2 47.6 14.2
ICGV 07240 x RG 426 33.0 30.9 8.5* 24.5 8.0 15.7 36.1 40.8 12.4
ICGV 96155 x JDR 65 24.5 36.8 4.7 18.7 9.0 16.2 36.1 45.1 14.4
ICGV 96155 x JDR 66 25.0 37.7 7.0 20.3 9.4 14.9 34.4 44.5 12.7
ICGV 96155 x R 2001-2 24.5 35.5 4.7 18.5 9.5 12.4 34.3 47.0 9.2
ICGV 96155 x RG 426 25.5 35.2 6.0 19.2 10.2 12.0 35.5 42.9 10.0
TVG0831 x JDR 65 27.5 49.6* 4.7 19.0 10.0 15.7 34.3 48.6 12.5
TVG0831 x JDR 66 27.0 51.5 4.4 14.0 7.8 25.7* 35.7 43.4 19.9
TVG0831 x R 2001-2 27.5 53.1* 4.2 15.9 9.2 19.9 35.9 38.8 13.7
TVG0831 x RG 426 28.0 44.2 6.0 19.2 9.2 23.3 35.3 47.8 22.1*
TVG 0856 x JDR 65 28.5 45.5 5.5 17.2 8.2 20.2 35.5 52.3 20.2
TVG 0856 x JDR 66 28.5 44.7 5.7 21.5 10.5 12.7 37.4 59.2* 14.2
TVG 0856 x R 2001-2 28.5 40.5 5.0 17.2 11.8 23.5 35.5 44.1 22.1*
TVG 0856 x RG 426 26.5 44.7 4.7 22.2 10.2 17.7 37.2 43.2 15.2
TVG 0861 x JDR 65 27.0 41.7 4.0 16.7 8.4 18.7 38.8 36.5 12.2
TVG 0861 x JDR 66 30.0 41.2 5.8 15.0 7.9 17.9 34.3 45.3 15.2
TVG 0861 x R 2001-2 29.0 45.4 5.4 17.2 8.2 15.4 35.6 37.6 11.8
TVG 0861 x RG 426 29.0 46.2 4.5 18.0 9.2 18.2 36.8 46.1 14.9
General Mean 27.9 40.5 5.8 19.1 9.1 17.8 35.7 45.2 15.0
SE.d. 1.7 4.2 1.0 3.4 1.3 3.1 2.4 5.1 3.1
Electronic Journal of Plant Breeding, ISSN 0975-928X
DOI: 10.5958/0975-928X.2016.00011.9
http://ejplantbreeding.com 85
Table 5. Specific combining ability effects of crosses for different characters in groundnut
Crosses Days
to 50% flower ing
Plant height Branches per plant
Pods per plant Root length Dry matter production
SPAD chlorophyll meter reading
Harvest index
Pod yield / plant
ICGV 07240 x JDR 65 0.63 3.31 0.41 1.82 -0.53 6.05* -1.11 1.38 5.48*
ICGV 07240 x JDR 66 -0.37 -1.25 -0.35 -3.63 -0.32 -3.07 -0.03 -1.70 -2.82
ICGV 07240 x R 2001-2 -2.17 -3.91 0.10 1.88 1.49 -0.95 0.99 4.13 -0.06
ICGV 07240 x RG 426 1.93 1.87 -0.17 -0.08 -0.64 -2.04 0.15 -3.81 -2.60
ICGV 96155 x JDR 65 -0.12 -0.38 -0.61 -0.75 0.01 0.88 0.91 -0.61 1.64
ICGV 96155 x JDR 66 -0.12 1.26 0.93 2.45 0.32 1.76 -0.32 -2.94 1.34
ICGV 96155 x R 2001-2 0.08 -0.10 -0.62 -0.19 -0.77 -1.27 -0.55 4.39 -1.55
ICGV 96155 x RG 426 0.18 -0.77 0.31 -1.50 0.45 -1.37 -0.03 -0.85 -1.44
TVG0831 x JDR 65 0.25 -0.86 0.20 1.75 1.48 -6.91* -1.10 3.17 -5.71*
TVG0831 x JDR 66 -0.75 1.78 -0.96 -1.70 -0.76 5.32* 0.71 -3.76 3.04
TVG0831 x R 2001-2 0.45 4.22 -0.31 -0.69 -0.60 -1.06 0.83 -3.63 -2.55
TVG0831 x RG 426 0.05 -5.15 1.07 0.65 -0.13 2.64 -0.44 4.23 5.21*
TVG 0856 x JDR 65 0.75 0.78 0.60 -2.55 -1.46 0.27 -1.00 1.76 1.09
TVG 0856 x JDR 66 0.25 0.72 -0.01 3.30 0.80 -5.1* 1.37 7.02 -3.51
TVG 0856 x R 2001-2 0.95 -2.64 0.09 -1.89 0.87 5.22* -0.72 -3.39 5.05*
TVG 0856 x RG 426 -1.95 1.14 -0.68 1.15 -0.22 -0.38 0.35 -5.39 -2.64
TVG 0861 x JDR 65 -1.50 -2.85 -0.60 -0.26 0.49 -0.30 2.31 -5.70 -2.51
TVG 0861 x JDR 66 1.00 -2.50 0.39 -0.42 -0.05 1.09 -1.72 1.37 1.94
TVG 0861 x R 2001-2 0.70 2.43 0.74 0.89 -0.98 -1.95 -0.55 -1.49 -0.90
TVG 0861 x RG 426 -0.20 2.92 -0.53 -0.21 0.54 1.16 -0.03 5.82 1.46
SE (gij) 1.19 2.97 0.67 2.42 0.95 2.22 1.70 3.57 2.16