Vol.7 (2017) No. 4-2
ISSN: 2088-5334
Comparative Analysis of Data Redundancy and Execution Time
between Relational and Object-Oriented Schema Table
Salim Tahir Alakari
#, Mohd Zainuri Saringat
#, Aida Mustapha
#, Ahmad Najmi Amerhaider Nuar
*#
Soft Computing and Data Mining Centre, Faculty of Computer Science and Information Technology, Universiti Tun Hussein Onn Malaysia, 86400 Batu Pahat, Johor, Malaysia
E-mail: [email protected]
*
Tagme Solutions, No 24 -1, Jalan Universiti 1, Taman Universiti 86400 Parit Raja, Batu Pahat Johor, Malaysia
Abstract— Database design is one of the important phases in designing software because the database is where the data is stored in the
system. One of the most popular techniques used in database design is the relational technique, which focuses on entity relationship diagram and normalization. The relational technique is useful for eliminating data redundancy because normalization produces normal forms on the schema tables. The second technique is the object-oriented technique, which focuses on a class diagram and generating schema tables. An advantage of the object-oriented technique is its close implementation to programming languages like C++ or Java. This paper is set to compare the performance of both relational and object-oriented techniques in terms of solving data redundancy during the database design phase as well as measuring query execution time. The experimental results based on a course database case study traced 186 redundant records using the relational technique and 204 redundant records when using the object-oriented technique. The query execution time measured was 46.75ms and 31.75ms for relational and object-object-oriented techniques, respectively.
Keywords— database design; relational technique; object-oriented technique; data redundancy; query execution time
I. INTRODUCTION
A database is a mechanism to store data or information in an organized manner. When data are stored in a database, the information has to be easily accessible and optimized for searching, modifying and removal [1]. A good database design is imperative for two reasons. One, poor design results in unwanted data redundancy. Two, it also generates errors leading to bad decisions. A practical approach to database design is to focus on principles and concepts of database design that will result in effective performance.
At present, database design is supported by many methodologies and techniques that strive for a perfect design [2]. One of the most established methodologies is the relational data model concept introduced by Codd [3]. However, because the core of the model is the collection of tables, this design is prone to redundancy among the tables. Data redundancy is the term used to describe databases that contain data fields are redundant in the database. Data redundancy may occur either when the field is repeated multiple times in a database for a variety of reasons.
Data redundancy is wasteful and inefficient. To solve the redundancy problem, normalization technique has been widely used [1], [4]. Normalization is an important
technique for the design of relational databases. During normalization, the functional dependencies in the tables are first determined to match the normal forms with a breakdown of the tables. The benefits of normalization include as follows.
• It eliminates data redundancy.
• It eliminates to insertion, modification and deletion anomalies.
• It results in the saving of more space in storing. • It allows adding new tables to the database and new
rows to the table without any difficulty. • It ensures data consistency.
• It ensures referential integrity.
Normalization is a technique of breaking down the given relational schemas focused around their functional dependencies and primary keys in an effort to decrease duplication. It focuses on producing a set of relational tables with the least amount of information redundancy by facilitating correct insertion, deletion, and modification. At present, it is very much time-consuming to use an automated technique to do this data analysis, as opposed to manual.
Consequently, this will affect the efficiency of a database since the updating process is more complex apart from the complexity in programming itself [5].
Another approach to solving data redundancy is by designing a relational database system based on the object-oriented methodology. In the object-object-oriented approach, the database system is created by the schema table generated from the class diagrams. The rules applied to adhere to the object-oriented concept, which is based on the relationships among the classes, multiplicity, attributes name, class name, data type and the behaviours of the classes [6].
The objective of this paper is to analyze the redundancy problem by examining two approaches in database design, which are the relational technique and the object-oriented technique. The analysis will measure the total data redundancy based on Structured Query Language (SQL). The important concepts considered in SQL are entities, relationships, and attributes, as well as the data schema while using the SQL query language. Aside from measuring the total data redundancy, the experiment will also measure the query execution time in terms of milliseconds.
II. MATERIAL AND METHOD
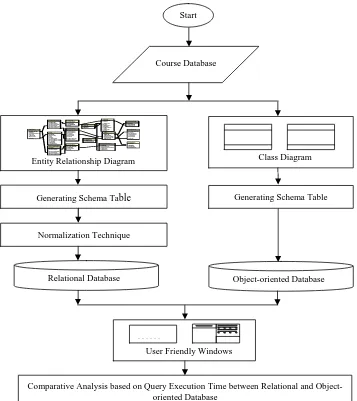
In order to compare the performance of both relational and object-oriented techniques in terms of solving data redundancy, an undergraduate database course at Universiti Tun Hussein Onn Malaysia (UTHM) has been chosen as the case study. Fig. 1 shows the process of applying the relational technique and the object-oriented technique in designing the database course.
In this figure, two different schema tables will be generated based on the Entity Relation Diagram (ERD) from the relational approach and the class diagrams from the object-oriented approach. The schema table from the relational approach will undergo another process called the normalization to produce up to the third normal forms from the tables. Total data redundancy from both schema tables will then calculated and analyzed. Next, a user-friendly window [7] is used to measure the query execution times for both relational and object-oriented database designs.
Start
Course Database
Suppl ierID
Name Cont actName Pho ne Add ress Zi pCode Cit yID Sup plie r
PONumb er
Ord erDate Recei veDat e Suppl ierID Empl oye eID Shipp ingCost Me rchan dise Ord er
OrderID
Ord erDate Recei veDat e Suppl ierID Shipp ingCost Empl oye eID AnimalOrder
OrderID An imalID
Co st Animal Orde rItem
CityID
Zip Co de City State AreaCode Popul ation 1990 Popul ation 1980 Country Lati tude Long itude City
Employee ID
Last Na me FirstNa me Phone Address ZipCode Ci tyID TaxPayerID Da teHired Da teRelea sed Empl oyee
PONumber ItemID
Qua ntity Co st Orde rItem
Cate gory
Reg istr ation Cat egory
Ca tegory Breed
Bre ed
Anima lID
Name Categ ory Breed DateBo rn Gender Regi stere d Col or Li stPri ce Phot o Ani mal
SaleI D
Sal eDate Emp loyeeID Customer ID Sal esTax Sal e
Sa leID I temID
Quan tity Sa lePrice Sa leItem
It emID
Descri ption Quant ityOnHand L istPri ce Cate gory Merchandi se
Sa leID Ani malID
Sa lePrice Sa leAni mal
Cus tomerID
Ph one F irstName L astName Ad dress Z ipCode Ci tyID Customer
Entity Relationship Diagram
……
User Friendly Windows
Class Diagram
Generating Schema Table Generating Schema Table
Normalization Technique
Relational Database Object-oriented Database
Comparative Analysis based on Query Execution Time between Relational and Object-oriented Database
End
A. Relational Technique
In the relational technique, the database was designed based on the Entity Relationship Diagram (ERD), and schema tables were generated from these diagrams. Once the schema tables were ready, they are implemented into a physical database system. The steps to produce the database are as follows.
• Step 1. Create entity relationship diagram based on the Course Database case study using Visual Paradigm program as shown in Fig. 2.
• Step 2. Generate SQL schema table from ER
diagram as shown in Fig. 3.
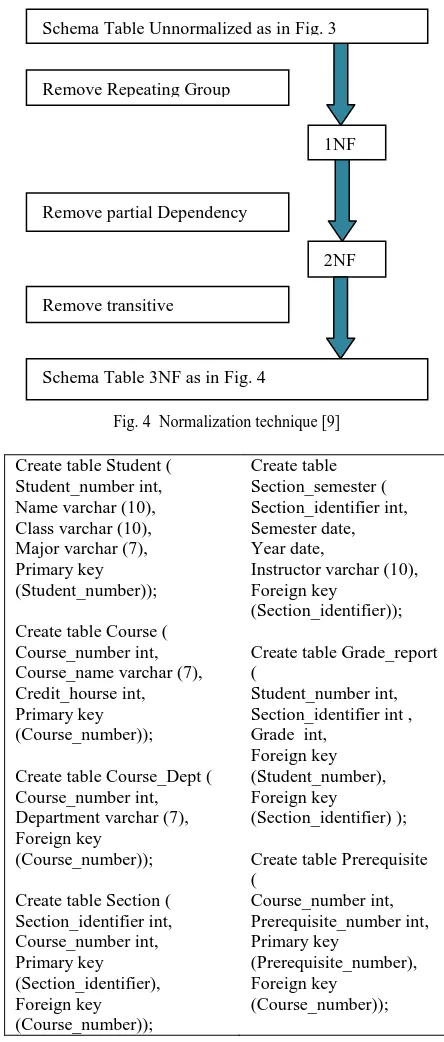
• Step 3. Apply normalization technique until third normal forms as shown in Fig. 4.
• Step 4. Generate schema table from normalization technique until 3NF as shown in Fig. 5.
Fig. 2 Entity relationship diagram database course [8]
Create table Student ( Student_number int, Name varchar (10), Class varchar (10), Major varchar (7), Primary key (Student_number) );
Create table Course ( Course_number int, Course_name varchar (7), Credit_hourseint, Department varchar (7), Primary key
(Course_number) );
Create table Section ( Section_identifier int, Course_number int, Primary key (Section_identifier), Foreign key (Course_number));
Create table Grade_report ( Student_number int, Section_identifier int, Grade int,
Foreign key (Student_number), Foreign key
(Section_identifier) );
Create table Prerequisite ( Course_number int, Prerequisite_number int, Primary key
(Prerequisite_number), Foreign key
(Course_number));
Fig. 3 Generate schema table for database course
Fig. 4 Normalization technique [9]
Create table Student ( Student_number int, Name varchar (10), Class varchar (10), Major varchar (7), Primary key (Student_number));
Create table Course ( Course_number int, Course_name varchar (7), Credit_hourse int, Primary key (Course_number));
Create table Course_Dept ( Course_number int, Department varchar (7), Foreign key
(Course_number));
Create table Section ( Section_identifier int, Course_number int, Primary key (Section_identifier), Foreign key (Course_number));
Create table Section_semester ( Section_identifier int, Semester date, Year date,
Instructor varchar (10), Foreign key
(Section_identifier));
Create table Grade_report (
Student_number int, Section_identifier int , Grade int,
Foreign key (Student_number), Foreign key
(Section_identifier) );
Create table Prerequisite (
Course_number int, Prerequisite_number int, Primary key
(Prerequisite_number), Foreign key
(Course_number));
Fig. 5 Schema tables normalization until 3NF in Database course
B. Object-oriented Technique
The steps in object-oriented technique began by first translating the ER diagram into a class diagram. The Visual Paradigm program [10] supports generating class diagram from existing ER diagrams. This program mapped the entities and relationships into the corresponding classes and associations. In the object-oriented technique, the each class is then translated into schema tables.
• Step 1. Generating Class Diagrams from ERD by
using Synchronize to Class Diagram in Visual Paradigm program as shown in Fig. 6.
Remove Repeating Group
1NF
2NF Remove partial Dependency
Remove transitive
Schema Table Unnormalized as in Fig. 3
• Step 2. Generate SQL schema table from a class diagram by using Object Relational Mapping (ORM) as in Fig. 7.
Fig. 6 Class diagram for Database course
Create table Student ( Student_number int, Name varchar (10), Class varchar (10), Major varchar (7), Primary key (Student_number));
Create table Course ( Course_number int, Course_name varchar (7), Credit_hourse int, Department varchar (7), Primary key
(Course_number));
Create table Section ( Section_identifier int, Course_number int, Primary key (Section_identifier), Foreign key (Course_number));
Create table Grade_report ( Student_number int, Section_identifier int , Grade int,
Foreign key (Student_number), Foreign
key( Section_identifier));
Create table Prerequisite (
Course_number int, Prerequisite_number int, Primary key
(Prerequisite_number), Foreign key
(Course_number));
Fig. 7 Generate schema table for Course class diagram
III.RESULTS AND DISCUSSION
The comparative analysis measured two items; the number of data redundancy produced by each technique and the query execution time for both database designs.
A. Data Redundancy
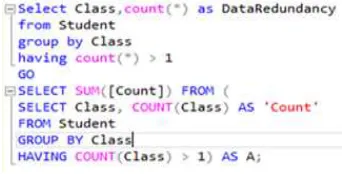
The total data redundancy inside the attributes from both relational and object-oriented schema tables was calculated using the SQL query as shown in Fig. 8.
Fig. 8 SQL Query to calculate data redundancy
Table 1 shows the total data redundancy resulting from the SQL query using both relational and object-oriented techniques. From the table, the database design using object-oriented technique produced higher data redundancy in the Department attribute. This is because the tables in the Database Course were transferred from class diagram [10]. The class diagram in object-oriented refers to the entities in the system requirements.
B. Query Execution Times
The second objective of this paper is to compare query execution times between the two different databases. In measuring the execution time, a user-friendly window using C# was used to calculate the query duration based on four queries each in the case study. Fig. 9 shows the user-friendly window, which displays and calculate query execution time using both relational and object-oriented techniques.
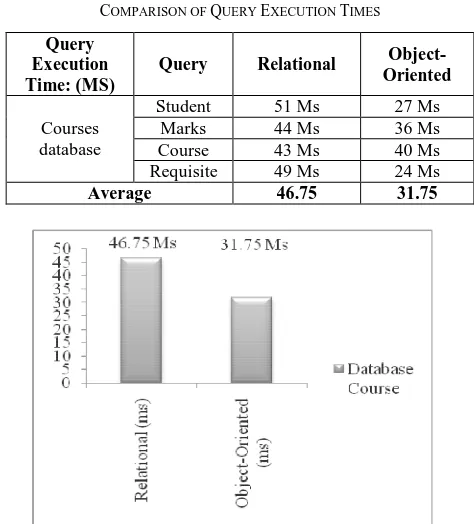
Next, the results of query execution time from running the user-friendly window are shown for four queries using the hospital object-oriented database. The queries were a student, marks, course, and requisite. The result of running these queries is shown in Table 2 where the query execution times are measured in milliseconds (Ms). Finally, Fig. 10 illustrates the average execution times for all queries in the relational and object-oriented database resulting from the case study.
TABLEI
RESULTS OF DATA REDUNDANCY IN DATABASE COURSE
Relational Technique Object-Oriented Technique
Schema Table Attribute Data
Redundancy Schema Table Attribute
Data Redundancy
Student Class 30 Student Class 30
Major 28 Major 28
Course Credit_ hours 17
Course Credit_hours 17
Course_dept Department 0 Department 18
Section_semester
Semester 29
Section
Semester 29
Year 29 Year 29
Instructor 25 Instructor 25
Grade_report Grade 28 Grade_report Grade 28
Fig. 9 User-friendly window
TABLEII
COMPARISON OF QUERY EXECUTION TIMES
Query Execution Time: (MS)
Query Relational Object-Oriented
Courses database
Student 51 Ms 27 Ms
Marks 44 Ms 36 Ms
Course 43 Ms 40 Ms
Requisite 49 Ms 24 Ms
Average 46.75 31.75
Fig. 10 Query execution times forJ both relational and object-oriented database
IV.CONCLUSIONS
The core benefit of adopting a common database in a big data system is reducing the data redundancy, hence reducing the man-hours for maintaining the database, as well as maximizing the database throughput. The basic idea is to reduce the number of associations between objects and to promote object reuse so that the database performance is optimized. This, in turn, will have a positive effect on the size of storage space. The important objective is to reduce data redundancy over databases. This paper focused on considering allotments of the relational and identical classes that share relations. Object-oriented approach detects redundancy more easily and efficiently by using comparable classes.
Data redundancy problem is analysed in this paper when designing the database. The comparative results showed that
the relational database design technique achieved a bigger reduction in data redundancy as compared to the object-oriented technique. This is because the relational technique uses normalization to avoid this problem through the normalization rules. From the case study using the database course, the relational technique produced only 186 data redundancy as opposed to 204 data redundancy from the object-oriented technique. However, in terms of query execution times when performing the SQL queries via the user-friendly window, the object-oriented database produced faster results of 31.75ms as compared to 46.75ms by the relational database.
In conclusion, both techniques are accepted in designing database and applied in current system development in worldwide. However, the database designer must be really understood when the technique should be used. For example, in the big database which is involved with many tables, it not recommended to applied relational technique.
ACKNOWLEDGMENT
This project is sponsored by Universiti Tun Hussein Onn Malaysia and partially supported by Research Gates IT Solution Sdn. Bhd.
REFERENCES
[1] Coronel, C. and Morris, S., “Database Systems: Design, Implementation Management”, Cengage Learning, New York, 2013. [2] Stephens, R. K. and Plew, R. R. “Database design book by Sams
Publishing. SABAU, G. (2007). Comparison of RDBMS, OODBMS and ORDBMS. Revista Informatica Economica (44), 2001. [3] Codd, E. F. “Further Normalization of the Database Relational
Model”, Database System, Englewood Cliffs, N.J.: Prentice Hall, 33:64, 1972.
[4] Connolly, T. and Begg, C., “Database Systems: A Practical Approach to Design, Implementation and Management”, Pearson, England, 2015.
[5] Saringat, M. Z., “Attributes Sanitization in Object-oriented Design to Improve Database Structure”, Ph.D Thesis, Universiti Tun Hussein Onn Malaysia, 2014.
[6] Saringat, M. Z., Herawan, T. and Ibrahim, R., “A Proposal for Constructing Relational Database from Class Diagram”, Canadian Journal: Computer and Information Science, Vol. 3, No. 2, pp. 38-46, 2010.
[7] Voore S. R. and Chavan, V., “A User Friendly Window Based Application for Calculation of Query Execution Time for Relational Databases”, International Journal of Engineering and Advanced Technology (IJEAT), ISSN: 2249 – 8958, Volume-2, Issue-2, 2012. [8] Elmasri, R. and Navathe, S., “Fundamentals of Database Systems”,
Sixth Edition, Singapore: Pearson, 2011.
[9] Connolly, T. and Begg, C., “Database systems: A practical approach to design, implementation and management”, 6th ed. Essex: Addison-Wesley, 2014.
[10] Saringat, M. Z., Ibrahim, R., Ibrahim, N., & Adeshina, A., “Constructing Schema Table from Class Diagram”, 2nd World Conference on Information Technology (WCIT 2011). AWER Procedia Information Technology and Computer Science, Vol. 1, May 2012, pp 699-70, 2012.