ISSN 0975-928X
Research Note
Character association and path analysis studies for yield and its components
in pea (
Pisum sativum
L.)
B. Senthamizh Selvi1*, J. Rajangam2, J. Suresh1 and R. Muthuselvi3
1
Department of Spices and Plantation Crops, Horticultural College and Research Institute, Coimbatore.
2Department of Fruit Crops, Horticultural College and Research Institute, Periyakulam 3
Horticultural Research Station, Kodaikanal, India E-mail:[email protected]
(Received:28 Jul 2015; Accepted:11 Jun 2016)
Abstract
Twenty six varieties of pea were evaluated for morphological characters, yield and its components. Association analysis of various morphological traits through correlation and path coefficient analysis were carried out among the varieties. Statistically significant and positive correlation (genotypic and phenotypic) was observed for days to 50 per cent flowering, pod length, pod girth, number of seeds per pod, individual pod weight, individual seed weight, pod coat weight, number of pods per plant, 100 seed weight and pod yield per plant. Statistically significant negative correlation (genotypic and phenotypic) was registered for plant height, number of leaves, first node bearing tendril, number of tendrils at the terminal end, days to first flowering, plant height at flowering stage, number of branches at flowering stage, first node bearing pod, leaf area, number of pods per plant and shelling percentage. The genotypic and phenotypic path coefficient revealed that plant height, days to 50% flowering, pod girth, individual pod weight, individual seed weight, leaf area, number of pods per plant and shelling percentage had high direct positive effect. Therefore these characters should be considered as the selection criterion to improve the pod yield per plant.
Keywords
Pea, correlation, path analysis, pod yield
Pea (Pisum sativum L.) is one of the commonly
grown, economically important leguminous vegetable in the world. Pea is nutritious vegetable rich in protein, amino acids, carbohydrates and sugar. It is considered to be one of the world’s oldest crops since it was first cultivated with cereals like barley and wheat (McPhee, 2003). Its production ranks second amongst the cool season pulses in the world and the third largest area in pea cultivation is occupied by India with 6.3 lakh hectare with a production of 36.7 lakh tonnes and productivity of 9.6 tonnes per hectare (FAOSTAT, 2009) after Canada and Russia. It is mostly grown in Uttar Pradesh, Madhya Pradesh, Bihar, Assam and Orissa which together accounts for about 95 per cent of the total area of production. An effective breeding programme for developing varieties of improved quality requires preliminary information on the nature and magnitude of genetic variability, degree of transmission of traits and their inter- relationship. Hence, it is important to have knowledge of association of vegetative and floral traits among themselves. Correlation co-efficient studies are useful in choosing superior cultivars from their phenotypic and genotypic expression. As far as pod yield is concerned, it is a complex trait known to be collectively influenced by various polygenically inherited traits. Therefore correlation studies give an idea about the positive and negative associations of different growth and yield characters with number of
pods per plant and also among themselves. However, using correlation co-efficient studies, nature and extent of contribution by these traits towards number of pods per plant is not obtained. This difficulty is overcome by path co-efficient studies, it facilitates partitioning of correlation co-efficients into direct and indirect effects of the different traits on pod yield per plant or any other traits and also helps in finding out how these effect influence a particular character to produce a given positive or negative correlation. The information helps in giving proper weightage to various traits during selection or other breeding programme so that the improvement of desirable trait could be achieved effectively. Keeping these points in view, the present study was carried out to find out
the inter-relationship among the components
responsible for pod yield per plant and the direct and indirect influences of each component traits towards pod yield per plant.
ISSN 0975-928X
indirect effects of the component characters on yield on the basis of which crop improvement programmes can be logically devised. Hence a research programme was undertaken to study the correlation and path coefficients among pod yield and its
component characters in pea (Pisum sativum L.).
A total of twenty six pea (Pisum sativum L.) varieties
were evaluated in randomized block design with three replications conducted at Horticultural Research Station, Kodaikanal, Tamil Nadu during the winter months (sown on 25.11.2010 and 26.11.2011) for growth and yield attributes. The twenty six varieties of pea included five from IIVR, Varansai (Khasi Samrath, Khasi Shakti, Khasi Mukti, Khasi Nandhini & Khasi Utham) ; six from GBPAUT, Lucknow ( PM-2, PSM-3, PSM-4, Azad P-3, VL-7 & Arkel); five from PAU, Ludhiana (Pb-88, PB-89, Mater Ageta-6, Mithi Phali & Arkel); three from IIHR, Bangalore (Arka Ajit, Arka Karthik & Arka Sampoorna) three commercial varieties from Ooty (Ooty-1,GS-10 & Marina) and three from Kodaikanal (Bonneville, local sweet and local samba). Spacing of 20 cm between rows and 10 cm between plants in a row was provided. Ten competitive plants of each genotype from each replication were observed for
twenty three quantitative characters viz., plant height,
number of leaves, number of branches per node, first node bearing tendril, number of tendrils at the terminal end, internodal length, days to first flowering, plant height at flowering stage, number of leaves at flowering stage, number of branches at flowering stage, first node bearing pod, days to 50 per cent flowering, pod length, pod girth, number of seeds per pod, individual pod weight, individual seed weight, pod coat weight, leaf area, number of pods per plant, 100 seed weight, shelling percentage and pod yield per plant. Mean values of 10 plants were used for statistical analysis. Correlation co-efficient among different characters were estimated at phenotypic and genotypic levels using the formula
given by Miller et al. (1958). Phenotypic correlation
was tested by simple t-test. Path analysis as suggested by Dewey and Lu (1959) was used to partition the genotypic correlation coefficients of pod yield into direct and indirect effects.
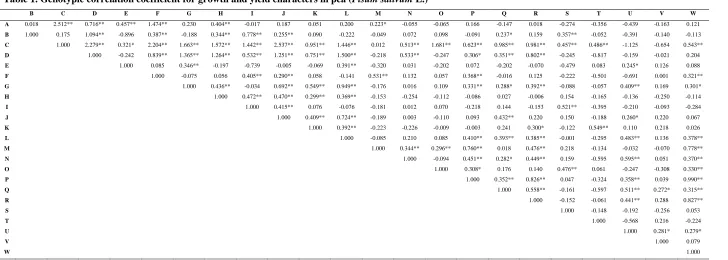
The genotypic and phenotypic correlation
coefficients among the twenty three characters are presented in Table 1&2. Genotypic correlation of pod yield per plant was found to be highly significant and had positive association with number of branches per node (0.543), internodal length (0.321), days to 50 % flowering (0.378), pod length (0.778), pod girth (0.370), number of seeds per pod (0.330), individual pod weight (0.990), individual seed weight (0.315),
pod coat weight (0.827) and 100 seed weight (0.279). Such a kind of positive significant association was quoted by Gupta and Singh, 2006, Kaur et al., 2007 and Kumar et al., 2004. Characters like number of leaves at flowering stage and number of pods per plant showed negative significant association with pod yield per plant. This is in agreement with the findings of Deepa and Balan (2006) in cowpea. The results indicated that one should select for pod yield correlating with these trait concurrently rather than isolation. It was also observed that characters like number of leaves at vegetative stage and plant height at flowering stage showed negative non-significant association with pod yield. This is in agreement with the findings of Sarutayophat, 2012 in soybean. Hence during selection care should be taken to give more weightage on these traits for realising the highest pod yield.
ISSN 0975-928X
and days to 50% flowering; number of leaves at flowering stage number of branches at flowering stage and leaf area; number of branches at flowering stage with first node bearing pod, days to 50% flowering, individual seed weight, pod coat weight, number of pods per plant and shelling percentage; first node bearing pod with days to 50 percent flowering, individual seed weight, pod coat weight, number of pods per plant and shelling percentage; days to 50 percent flowering with individual pod weight, individual seed weight, pod coat weigh and 100 seed weight; pod length with pod girth, number of seeds per pod, individual pod weight, individual seed weight, pod coat weight and leaf area; pod girth with individual pod weight, individual seed weight, pod coat weight and 100 seed weight; number of seeds per pod with individual pod weight and leaf area; individual pod weight with individual seed weight, pod coat weight and 100 seed weight, individual seed weight with pod coat weight, 100 seed weight and shelling percentage; pod coat weight with 100 seed weight and shelling percentage; number of pods per plant with shelling percentage; 100 seed weight with shelling percentage. This
positive correlation confirmed the results of Pundir et
al. (1992).
The association analysis revealed that, number of branches per node, internodal length, days to 50 per cent flowering, pod length, pod girth, number of seeds per pod, individual pod weight, individual seed weight, pod coat weight and 100 seed weight may result in simultaneous improvement for pod yield and could be very well utilized as yield indicator while exercising selection. However selection for traits like number of leaves, plant height at flowering stage, number of leaves at flowering stage and number of pods per plant was negatively associated with pod yield per plant. Hence, intensive selection for these traits will however result in the reduction of pod yield and so a compromise towards selection is required for these traits.
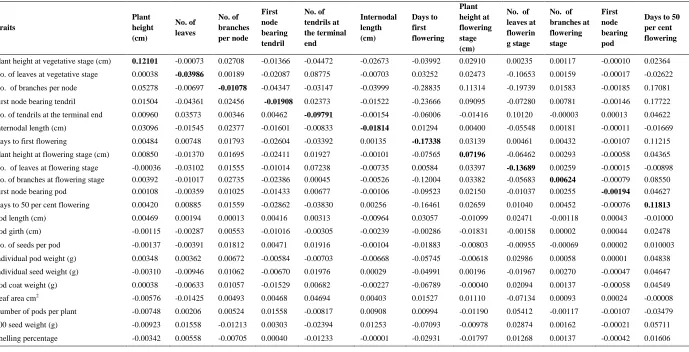
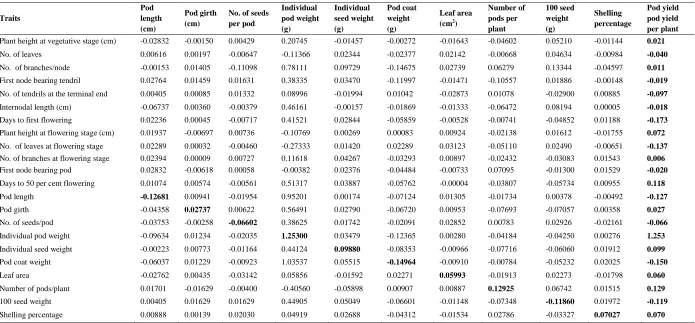
Path analysis for pod yield was carried out at genotypic level and is presented in Table 3.
Characters viz., plant height at vegetative and
flowering stage, number of branches at flowering stage, days to 50 per cent flowering, pod girth, individual pod weight, individual seed weight, leaf area, number of pods per plant and shelling percentage registered positive direct effect on pod yield. Similar results were observed by Kaur et al.
(2007) in pea and Henry et al. (1986) in cluster bean.
The direct selections for these characters would bring an overall improvement of pod yield per plant. Number of leaves, number of branches per node, first
node bearing tendril, number of tendrils at the terminal end, internodal length, days to first flowering, number of leaves at flowering stage, first node bearing pod, pod length, number of seeds per pod, pod coat weight and 100 seed weight had registered negative direct effect on pod yield per
plant. This result is in line with the findings of Ali et
al., 2009 in chickpea for days taken to first flowering.
The present study showed significant positive
correlation for the characters viz., number of branches
per node, internodal length, days to 50 percent flowering, pod length, pod girth, number of seeds per pod, individual pod weight, individual seed weight, pod coat weight and 100 seed weight with pod yield per plant. In addition, these characters also had positive inter correlation among themselves and also with other important traits. Path coefficient analysis revealed that plant height at vegetative and flowering stage, days to 50 percent flowering, pod girth, individual pod weight, individual seed weight, leaf area, number of pods per plant and shelling percentage registered positive direct effect on pod yield. Considering this, it could be inferred that prime importance may be given to these characters, in a selection programme to identify superior plants for the improvement of yield in pea.
References
Ali, M. A., Nawab, N. N., Abbas, A., Zulkiffal, M. and Sajjad, M. 2009. Evaluation of selection criteria in chick pea using correlation co-efficients and path analysis. Australian J. Crop Sci., 3(2):65-70. Deepa, S.N. and Balan, A. 2006. Correlation studies in
cowpea. Madras Agric. J., 93(7-12): 260-262. Dewey, D.R. and Lu, K. H. 1959. A correlation and path
coefficient analysis of components of crested wheat grass seed production. Agron. J., 51: 515-518.
Food and Agriculture Organization of the United Nations. 2009. http://faostat.fao.org
Gupta, J.A. and Singh, Y.V. 2006. Correlation coefficient analysis in garden pea (Pisum sativum L.). Journal of Research, SKUAST-J, 5(2): 198-202. Henry, A., Daulay, H.S. and Krishna, G.V.S.R. 1986.
Correlation, path co-efficient analysis and genetic diversity in cluster bean. Madras Agric. J., 73(1):11-16.
Kaur, H., Singh, M. and Brar, P.S. 2007. Correlation and path analysis in garden pea [Pisum sativum (L.)]. Crop Improv., 34(2): 186-191.
Kumar, P., Partap, P. S. and Rana, M. K. 2004. Correlation studies in garden pea (Pisum sativum L.). Haryana J. Hort. Sci., 33(3&4): 243-245. McPhee, K. 2003. Dry pea production and breeding,a mini
review. J. Food. Agric. Environ., 1: 64-69.
ISSN 0975-928X
environmental variances and co-variances in upland cotton and their implication in selection. Agron. J., 50: 126-131.
Pundir, S.R., Gupta, R. and Singh, V.P. 1992. Studies on correlation co-efficient analysis in mungbean (Vigna radiata). Haryana Agric. J. Res., 22: 256-258.
ISSN 0975-928X
Table 1. Genotypic correlation coefficient for growth and yield characters in pea (Pisum sativum L.)
A=Plant height at vegetative stage, B=Number of leaves at vegetative stage, C=Number of branches per node, D=First node bearing pod, ,E= No. of tendrils at the terminal end, F= Internodal length, G= Days to first flowering, H= Plant height at flowering stage, I= No. of leaves at flowering stage, J= No. of branches at flowering stage, K=First node bearing pod, L=days to 50 per cent flowering, M=Pod length, N=Pod girth, O= Number of seeds per pod , P= Individual pod weight, Q= Individual seed weight, R= Pod coat weight, S= Leaf area, T= No. of pods per plant, U= 100 seed weight, V= Shelling percentage, W= Pod yield per plant
B C D E F G H I J K L M N O P Q R S T U V W
A 0.018 2.512** 0.716** 0.457** 1.474** 0.230 0.404** -0.017 0.187 0.051 0.200 0.223* -0.055 -0.065 0.166 -0.147 0.018 -0.274 -0.356 -0.439 -0.163 0.121
B 1.000 0.175 1.094** -0.896 0.387** -0.188 0.344** 0.778** 0.255** 0.090 -0.222 -0.049 0.072 0.098 -0.091 0.237* 0.159 0.357** -0.052 -0.391 -0.140 -0.113
C 1.000 2.279** 0.321* 2.204** 1.663** 1.572** 1.442** 2.537** 0.951** 1.446** 0.012 0.513** 1.681** 0.623** 0.985** 0.981** 0.457** 0.486** -1.125 -0.654 0.543**
D 1.000 -0.242 0.839** 1.365** 1.264** 0.532** 1.251** 0.751** 1.500** -0.218 0.533** -0.247 0.306* 0.351** 0.802** -0.245 -0.817 -0.159 -0.021 0.204
E 1.000 0.085 0.346** -0.197 -0.739 -0.005 -0.069 0.391** -0.320 0.031 -0.202 0.072 -0.202 -0.070 -0.479 0.083 0.245* 0.126 0.088
F 1.000 -0.075 0.056 0.405** 0.290** 0.058 -0.141 0.531** 0.132 0.057 0.368** -0.016 0.125 -0.222 -0.501 -0.691 0.001 0.321**
G 1.000 0.436** -0.034 0.692** 0.549** 0.949** -0.176 0.016 0.109 0.331** 0.288* 0.392** -0.088 -0.057 0.409** 0.169 0.301*
H 1.000 0.472** 0.470** 0.299** 0.369** -0.153 -0.254 -0.112 -0.086 0.027 -0.006 0.154 -0.165 -0.136 -0.250 -0.114
I 1.000 0.415** 0.076 -0.076 -0.181 0.012 0.070 -0.218 0.144 -0.153 0.521** -0.395 -0.210 -0.093 -0.284
J 1.000 0.409** 0.724** -0.189 0.003 -0.110 0.093 0.432** 0.220 0.150 -0.188 0.260* 0.220 0.067
K 1.000 0.392** -0.223 -0.226 -0.009 -0.003 0.241 0.300* -0.122 0.549** 0.110 0.218 0.026
L 1.000 -0.085 0.210 0.085 0.410** 0.393** 0.385** -0.001 -0.295 0.483** 0.136 0.378**
M 1.000 0.344** 0.296** 0.760** 0.018 0.476** 0.218 -0.134 -0.032 -0.070 0.778**
N 1.000 -0.094 0.451** 0.282* 0.449** 0.159 -0.595 0.595** 0.051 0.370**
O 1.000 0.308* 0.176 0.140 0.476** 0.061 -0.247 -0.308 0.330**
P 1.000 0.352** 0.826** 0.047 -0.324 0.358** 0.039 0.990**
Q 1.000 0.558** -0.161 -0.597 0.511** 0.272* 0.315**
R 1.000 -0.152 -0.061 0.441** 0.288 0.827**
S 1.000 -0.148 -0.192 -0.256 0.053
T 1.000 -0.568 0.216 -0.224
U 1.000 0.281* 0.279*
V 1.000 0.079
ISSN 0975-928X
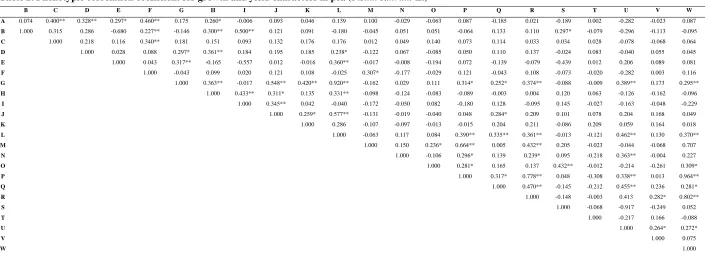
Table 2. Phenotypic correlation coefficient for growth and yield characters in pea (Pisum sativum L.)
A=Plant height at vegetative stage, B=Number of leaves at vegetative stage, C=Number of branches per node, D=First node bearing pod, ,E= No. of tendrils at the terminal end, F= Internodal length, G= Days to first flowering, H= Plant height at flowering stage, I= No. of leaves at flowering stage, J= No. of branches at flowering stage, K=First node bearing pod, L=days to 50 per cent flowering, M=Pod length, N=Pod girth, O= Number of seeds per pod , P= Individual pod weight, Q= Individual seed weight, R= Pod coat weight, S= Leaf area, T= No. of pods per plant, U= 100 seed weight, V= Shelling percentage, W= Pod yield per plant
B C D E F G H I J K L M N O P Q R S T U V W
A 0.074 0.400** 0.328** 0.297* 0.460** 0.175 0.260* -0.006 0.093 0.046 0.139 0.100 -0.029 -0.063 0.087 -0.185 0.021 -0.189 0.002 -0.282 -0.023 0.087
B 1.000 0.315 0.286 -0.680 0.227** -0.146 0.300** 0.500** 0.121 0.091 -0.180 -0.045 0.051 0.051 -0.064 0.133 0.110 0.297* -0.079 -0.296 -0.113 -0.095
C 1.000 0.218 0.116 0.340** 0.181 0.151 0.093 0.132 0.176 0.176 0.012 0.049 0.140 0.073 0.114 0.033 0.034 0.028 -0.078 -0.068 0.064
D 1.000 0.028 0.088 0.297* 0.361** 0.184 0.195 0.185 0.238* -0.122 0.067 -0.085 0.050 0.110 0.137 -0.024 0.083 -0.040 0.055 0.045
E 1.000 0.043 0.317** -0.165 -0.557 0.012 -0.016 0.360** -0.017 -0.008 -0.194 0.072 -0.139 -0.079 -0.439 0.012 0.206 0.089 0.081
F 1.000 -0.043 0.099 0.020 0.121 0.108 -0.025 0.307* -0.177 -0.029 0.121 -0.043 0.108 -0.073 -0.020 -0.282 0.003 0.116
G 1.000 0.363** -0.017 0.548** 0.420** 0.920** -0.162 0.029 0.111 0.314* 0.252* 0.374** -0.088 -0.009 0.389** 0.173 0.295**
H 1.000 0.433** 0.311* 0.135 0.331** -0.098 -0.124 -0.083 -0.089 -0.003 0.004 0.120 0.063 -0.126 -0.162 -0.096
I 1.000 0.345** 0.042 -0.040 -0.172 -0.050 0.082 -0.180 0.128 -0.095 0.145 -0.027 -0.163 -0.048 -0.229
J 1.000 0.259* 0.577** -0.131 -0.019 -0.040 0.048 0.284* 0.209 0.101 0.078 0.204 0.168 0.049
K 1.000 0.286 -0.107 -0.097 -0.013 -0.015 0.204 0.211 -0.086 0.209 0.059 0.164 0.018
L 1.000 -0.063 0.117 0.084 0.390** 0.335** 0.361** -0.013 -0.121 0.462** 0.130 0.370**
M 1.000 0.150 0.236* 0.664** 0.005 0.432** 0.205 -0.023 -0.044 -0.068 0.707
N 1.000 -0.106 0.296* 0.139 0.239* 0.095 -0.218 0.363** -0.004 0.227
O 1.000 0.281* 0.165 0.137 0.432** -0.012 -0.214 -0.261 0.309*
P 1.000 0.317* 0.778** 0.048 -0.308 0.338** 0.013 0.964**
Q 1.000 0.470** -0.145 -0.212 0.455** 0.236 0.281*
R 1.000 -0.148 -0.003 0.413 0.282* 0.802**
S 1.000 -0.068 -0.917 -0.249 0.052
T 1.000 -0.217 0.166 -0.088
U 1.000 0.264* 0.272*
V 1.000 0.075
ISSN 0975-928X
Table 3. Path coefficient analysis for growth and yield in pea (Pisum sativum L.)
Traits
Plant height (cm)
No. of leaves
No. of branches per node
First node bearing tendril
No. of tendrils at the terminal end
Internodal length (cm)
Days to first flowering
Plant height at flowering stage (cm)
No. of leaves at flowerin g stage
No. of branches at flowering stage
First node bearing pod
Days to 50 per cent flowering
Plant height at vegetative stage (cm) 0.12101 -0.00073 0.02708 -0.01366 -0.04472 -0.02673 -0.03992 0.02910 0.00235 0.00117 -0.00010 0.02364 No. of leaves at vegetative stage 0.00038 -0.03986 0.00189 -0.02087 0.08775 -0.00703 0.03252 0.02473 -0.10653 0.00159 -0.00017 -0.02622 No. of branches per node 0.05278 -0.00697 -0.01078 -0.04347 -0.03147 -0.03999 -0.28835 0.11314 -0.19739 0.01583 -0.00185 0.17081 First node bearing tendril 0.01504 -0.04361 0.02456 -0.01908 0.02373 -0.01522 -0.23666 0.09095 -0.07280 0.00781 -0.00146 0.17722 No. of tendrils at the terminal end 0.00960 0.03573 0.00346 0.00462 -0.09791 -0.00154 -0.06006 -0.01416 0.10120 -0.00003 0.00013 0.04622 Internodal length (cm) 0.03096 -0.01545 0.02377 -0.01601 -0.00833 -0.01814 0.01294 0.00400 -0.05548 0.00181 -0.00011 -0.01669 Days to first flowering 0.00484 0.00748 0.01793 -0.02604 -0.03392 0.00135 -0.17338 0.03139 0.00461 0.00432 -0.00107 0.11215 Plant height at flowering stage (cm) 0.00850 -0.01370 0.01695 -0.02411 0.01927 -0.00101 -0.07565 0.07196 -0.06462 0.00293 -0.00058 0.04365 No. of leaves at flowering stage -0.00036 -0.03102 0.01555 -0.01014 0.07238 -0.00735 0.00584 0.03397 -0.13689 0.00259 -0.00015 -0.00898 No. of branches at flowering stage 0.00392 -0.01017 0.02735 -0.02386 0.00045 -0.00526 -0.12004 0.03382 -0.05683 0.00624 -0.00079 0.08550 First node bearing pod 0.00108 -0.00359 0.01025 -0.01433 0.00677 -0.00106 -0.09523 0.02150 -0.01037 0.00255 -0.00194 0.04627 Days to 50 per cent flowering 0.00420 0.00885 0.01559 -0.02862 -0.03830 0.00256 -0.16461 0.02659 0.01040 0.00452 -0.00076 0.11813
Pod length (cm) 0.00469 0.00194 0.00013 0.00416 0.00313 -0.00964 0.03057 -0.01099 0.02471 -0.00118 0.00043 -0.01000
Pod girth (cm) -0.00115 -0.00287 0.00553 -0.01016 -0.00305 -0.00239 -0.00286 -0.01831 -0.00158 0.00002 0.00044 0.02478
No. of seeds per pod -0.00137 -0.00391 0.01812 0.00471 0.01916 -0.00104 -0.01883 -0.00803 -0.00955 -0.00069 0.00002 0.010003 Individual pod weight (g) 0.00348 0.00362 0.00672 -0.00584 -0.00703 -0.00668 -0.05745 -0.00618 0.02986 0.00058 0.00001 0.04838 Individual seed weight (g) -0.00310 -0.00946 0.01062 -0.00670 0.01976 0.00029 -0.04991 0.00196 -0.01967 0.00270 -0.00047 0.04647 Pod coat weight (g) 0.00038 -0.00633 0.01057 -0.01529 0.00682 -0.00227 -0.06789 -0.00040 0.02094 0.00137 -0.00058 0.04549
Leaf area cm2 -0.00576 -0.01425 0.00493 0.00468 0.04694 0.00403 0.01527 0.01110 -0.07134 0.00093 0.00024 -0.00008
Number of pods per plant -0.00748 0.00206 0.00524 0.01558 -0.00817 0.00908 0.00994 -0.01190 0.05412 -0.00117 -0.00107 -0.03479 100 seed weight (g) -0.00923 0.01558 -0.01213 0.00303 -0.02394 0.01253 -0.07093 -0.00978 0.02874 0.00162 -0.00021 0.05711 Shelling percentage -0.00342 0.00558 -0.00705 0.00040 -0.01233 -0.00001 -0.02931 -0.01797 0.01268 0.00137 -0.00042 0.01606
ISSN 0975-928X
Table 3. Contd.,
Traits
Pod length (cm)
Pod girth (cm)
No. of seeds per pod
Individual pod weight (g)
Individual seed weight (g)
Pod coat weight (g)
Leaf area (cm2)
Number of pods per plant
100 seed weight (g)
Shelling percentage
Pod yield pod yield per plant
Plant height at vegetative stage (cm) -0.02832 -0.00150 0.00429 0.20745 -0.01457 -0.00272 -0.01643 -0.04602 0.05210 -0.01144 0.021
No. of leaves 0.00616 0.00197 -0.00647 -0.11366 0.02344 -0.02377 0.02142 -0.00668 0.04634 -0.00984 -0.040
No. of branches/node -0.00153 0.01405 -0.11098 0.78111 0.09729 -0.14675 0.02739 0.06279 0.13344 -0.04597 0.011
First node bearing tendril 0.02764 0.01459 0.01631 0.38335 0.03470 -0.11997 -0.01471 -0.10557 0.01886 -0.00148 -0.019
No. of tendrils at the terminal end 0.00405 0.00085 0.01332 0.08996 -0.01994 0.01042 -0.02873 0.01078 -0.02900 0.00885 -0.097
Internodal length (cm) -0.06737 0.00360 -0.00379 0.46161 -0.00157 -0.01869 -0.01333 -0.06472 0.08194 0.00005 -0.018
Days to first flowering 0.02236 0.00045 -0.00717 0.41521 0.02844 -0.05859 -0.00528 -0.00741 -0.04852 0.01188 -0.173
Plant height at flowering stage (cm) 0.01937 -0.00697 0.00736 -0.10769 0.00269 0.00083 0.00924 -0.02138 0.01612 -0.01755 0.072
No. of leaves at flowering stage 0.02289 0.00032 -0.00460 -0.27333 0.01420 0.02289 0.03123 -0.05110 0.02490 -0.00651 -0.137
No. of branches at flowering stage 0.02394 0.00009 0.00727 0.11618 0.04267 -0.03293 0.00897 -0.02432 -0.03083 0.01543 0.006
First node bearing pod 0.02832 -0.00618 0.00058 -0.00382 0.02376 -0.04484 -0.00733 0.07095 -0.01300 0.01529 -0.020
Days to 50 per cent flowering 0.01074 0.00574 -0.00561 0.51317 0.03887 -0.05762 -0.00004 -0.03807 -0.05734 0.00955 0.118
Pod length -0.12681 0.00941 -0.01954 0.95201 0.00174 -0.07124 0.01305 -0.01734 0.00378 -0.00492 -0.127
Pod girth -0.04358 0.02737 0.00622 0.56491 0.02790 -0.06720 0.00953 -0.07693 -0.07057 0.00358 0.027
No. of seeds/pod -0.03753 -0.00258 -0.06602 0.38625 0.01742 -0.02091 0.02852 0.00783 0.02926 -0.02161 -0.066
Individual pod weight -0.09634 0.01234 -0.02035 1.25300 0.03479 -0.12365 0.00280 -0.04184 -0.04250 0.00276 1.253
Individual seed weight -0.00223 0.00773 -0.01164 0.44124 0.09880 -0.08353 -0.00966 -0.07716 -0.06060 0.01912 0.099
Pod coat weight -0.06037 0.01229 -0.00923 1.03537 0.05515 -0.14964 -0.00910 -0.00784 -0.05232 0.02025 -0.150
Leaf area -0.02762 0.00435 -0.03142 0.05856 -0.01592 0.02271 0.05993 -0.01913 0.02273 -0.01798 0.060
Number of pods/plant 0.01701 -0.01629 -0.00400 -0.40560 -0.05898 0.00907 0.00887 0.12925 0.06742 0.01515 0.129
100 seed weight 0.00405 0.01629 0.01629 0.44905 0.05049 -0.06601 -0.01148 -0.07348 -0.11860 0.01972 -0.119