Conversion and Residence Time Calcula-tion
for Gas-solid Solid Reactions of the
Cylindrical-shaped Particles with Con-stant Size Using
the Shrinking Core Model
Mohammad Reza Talaghat* and Ehsan Zangooei
Department of Chemical Engineering, Oil and Gas, Shiraz University of Technology
(Received 2016.05.29, Accepted 2017.06.09)
Abstract
In this paper, a mathematical model is developed to calculate the con -version and the residence time reaction for plug flow and mixed flow in the reactors filled with cylin-drical particles using the shrinking core model. In this modeling, the size of the particles is un-chamged during the reaction. Also, the reaction rate is controlled by the gas layer re-sistance, the ash layer rere-sistance, and the reaction resistance as well as the combination of them. In addition, it is assumed that the gas dif -fuses radially from the side, whereas the effect of diffusion in the axial direction is neglected. Equations are solved by numerical methods. It can be said that the innovation of this paper is the study of the effect of combination of resistances on the conversion of the reaction. Model evaluation shows that the results of modeling have a good consistency with the experimental data. The results show that at a certain time, when the rate of reaction is controlled by each of the resistances indi-vidually, the conversion rate is greater when the reaction is controlled by the ash layer resistance than when it is controlled by the other two resistance regimes. Finally, the effect of the combination of different controlling regimes on the conversion and residence time of reaction for plug flow and mixed flow of particles is studied and it is found that the overall results are similar to each other.
Keywords
Gas-solid reactions; Shrinking core model; Cylindrical particle;Conversion; Residence time; Combination of resistances.
Introduction
1 * Corresponding Author. Tel./Fax: +987137354520Email address: [email protected] (M.R. Talaghat)
1. Introduction
e should clearly understand that every conceptual picture or model for the progress of reaction comes with its mathematical representation, i.e., its rate equa-tion. Consequently, if we choose a model, we must
accept its rate equation and vice versa. If a model corresponds closely to what really takes place, then its rate expression will closely predict and describe the actual kinetics; if a model differs widely from reality, then its kinetic expressions will be useless. We must remember that the most elegant and high-power mathematical analysis based on a model which does not match reality is worthless for the engineer who must make design
predictions. The requirement for a good engi-neering model is that it should be the closest rep-resentation of reality, which can be treated with-out too many mathematical complexities. For the non-catalytic reaction of particles with surround-ing fluid, we consider two simple idealized mod-els, the progressive-conversionmodel (PCM) and the shrinking unreacted-core model (SCM) [1-3]. In progressive conversion model, gas enters and reacts throughout the particle at all times, most likely at different rates and at different locations within the particle. Thus, solid reactant is con-verted continuously and progressively through-out the particle as shown in Fig. (1).
Figure 1. Cylindrical particle shape
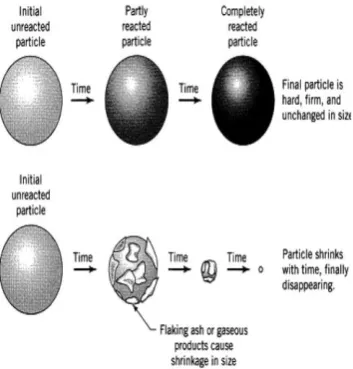
In the shrinking core model, the reaction occurs first at the outer skin of the particle. The zone of reaction then moves into the solid, leaving com-pletely converted material and inert solid behind. We refer to these as "ash." Thus, at any time, there exists an unreacted core of material, which shrinks in size during the reaction as shown in Fig. (2).
The shrinking core model is perfectly simple and more consistent with reality; observations about parts burning wood and coal confirm the validity of this model. The solid material is completely converted to ash, which remains when reaction of products is not gaseous, during the progress of the reaction. At this case, film diffusion, ash diffu-sion, and reaction are controlled. In slicing and examining the cross section of partly reacted sol-id particles, we usually find unreacted solsol-id mate-rial surrounded by a layer of ash. The boundary of this unreacted core may not always be as sharply defined as the model pictures it; nevertheless, evidence from a wide variety of situations indi-cates that in most cases, the shrinking-core model (SCM) approximates real particles more closely
than the progressive conversion model (PCM) does. Observations with burning coal, wood, bri-quettes, and tightly wrapped newspapers also favor the shrinking-core model. Since the SCM seems to reasonably represent reality in a wide variety of situations, we develop its kinetic equa-tions in the following section. In doing so, we con-sider the surrounding fluid to be a gas. However, this is done only for convenience, since the analy-sis applies equally well to liquids [4-7].
Figure 2. Different sorts of behavior of reacting spherical
solid particle using the shrinking core model[1]
In this paper, the conversion and residence time of reaction for cylindrical particles of unchanging size during the gas – solid reaction is modeled using the shrinking core model. There are a few works in literature concerned with mathematical modeling of gas – solid reaction [1-7]. However, the following cases are not considered in these works:
i) The development of a model for the case the chemical reaction rate is controlled by the combi-nation of resistances and its effect on conversion and residence time of reaction.
ii) The effect of plug flow and mixed flow of parti-cles on the conversion and residence time of reac-tion.
2. Mathematical Modeling
predictions. The requirement for a good engi-neering model is that it should be the closest rep-resentation of reality, which can be treated with-out too many mathematical complexities. For the non-catalytic reaction of particles with surround-ing fluid, we consider two simple idealized mod-els, the progressive-conversionmodel (PCM) and the shrinking unreacted-core model (SCM) [1-3]. In progressive conversion model, gas enters and reacts throughout the particle at all times, most likely at different rates and at different locations within the particle. Thus, solid reactant is con-verted continuously and progressively through-out the particle as shown in Fig. (1).
Figure 1. Cylindrical particle shape
In the shrinking core model, the reaction occurs first at the outer skin of the particle. The zone of reaction then moves into the solid, leaving com-pletely converted material and inert solid behind. We refer to these as "ash." Thus, at any time, there exists an unreacted core of material, which shrinks in size during the reaction as shown in Fig. (2).
The shrinking core model is perfectly simple and more consistent with reality; observations about parts burning wood and coal confirm the validity of this model. The solid material is completely converted to ash, which remains when reaction of products is not gaseous, during the progress of the reaction. At this case, film diffusion, ash diffu-sion, and reaction are controlled. In slicing and examining the cross section of partly reacted sol-id particles, we usually find unreacted solsol-id mate-rial surrounded by a layer of ash. The boundary of this unreacted core may not always be as sharply defined as the model pictures it; nevertheless, evidence from a wide variety of situations indi-cates that in most cases, the shrinking-core model (SCM) approximates real particles more closely
than the progressive conversion model (PCM) does. Observations with burning coal, wood, bri-quettes, and tightly wrapped newspapers also favor the shrinking-core model. Since the SCM seems to reasonably represent reality in a wide variety of situations, we develop its kinetic equa-tions in the following section. In doing so, we con-sider the surrounding fluid to be a gas. However, this is done only for convenience, since the analy-sis applies equally well to liquids [4-7].
Figure 2. Different sorts of behavior of reacting spherical
solid particle using the shrinking core model[1]
In this paper, the conversion and residence time of reaction for cylindrical particles of unchanging size during the gas – solid reaction is modeled using the shrinking core model. There are a few works in literature concerned with mathematical modeling of gas – solid reaction [1-7]. However, the following cases are not considered in these works:
i) The development of a model for the case the chemical reaction rate is controlled by the combi-nation of resistances and its effect on conversion and residence time of reaction.
ii) The effect of plug flow and mixed flow of parti-cles on the conversion and residence time of reac-tion.
2. Mathematical Modeling
For a general reaction, involving both solid and gas phases in both reagents and products, the
physical steps concerning the gas in the process are the following [8]:
Transfer within the external gas to the surface
of the pellet.
Diffusion through the intergranular pores. Adsorption into the solid reacting phase. Desorption of the produced gas.
Diffusion of the product gas to the external
particle surface.
Diffusion of gaseous products through the gas
film back into the main body of fluid.
Transfer of the produced gas from the particle
surface to the bulk gas.
Each of these steps has its own kinetics and can limit, also in part, the overall rate of conversion. In some situations, some of these steps do not exist. For example, if no gaseous products are formed, steps 4 and 5 do not contribute directly to the resistance to the reaction. Also, the re-sistances of the different steps usually vary great-ly. In such cases, we may consider the step with the highest resistance to be rate-controlling. The process can be successfully described as a chemi-cal regime, when a surface process controls the overall kinetics, or as a diffusional regime, when the rate is determined by diffusion, or as a mixed regime [1-3].
In the literature, in many cases, some simplifica-tions are assumed in order to formulate models that are applicable to the description of full-scale reactors as much as possible. A very comprehen-sive, classical treatment of the subject can be found in the seminal book of Szekely [9]. In spite of the impact, the quantitative treatment of reac-tive solids predominantly remains based on an oversimplification of the actual physics that can be extremely complicated by the already men-tioned issues. A more simplified approach as-sumes non-porous particles [10] or non-porous shrinking core model (SCM) [11]. According to it, the reaction is supposed to take place only on a surface separating the unreacted core by the product layer in the particle, and moving to the center as the reaction goes on. This physical de-scription is not always correct and, in general, it is not predictable whether or not a gas-solid reac-tion occurs by forming a core-shell structure as it depends on the reaction conditions (structure and size of the particle, temperature, pressure, composition of the feed gas, etc.). Even with this limitation, the SCM is still widely used [12-17] as
it provides a simple analytical solution to most cases, and it can still account for the presence of mass transfer resistances inside and outside the reacting solid, even if in a simplified way.
Consider a solid particle, where a single gas-solid reaction occurs, in the form:
A(Gas) bB(Solid) Product
One simple way of describing the reaction of a solid particle with a gas is using the shrinking core model. The main assumption of this model is that the reaction develops topochemically only on a single surface, which separates two zones with-in the solid. The unreacted core is made of pure solid reagent, which has not been reached by the reacting gas yet, and a reacted outer layer is made of the pure solid product, which is porous and where the gas diffuses but does not react, because the solid matrix is completely inert. The core-shell interface moves inward, as long as the core is consumed, and the shell becomes thicker. This concept can be applied to different particle geom-etries.
For cylindrical pellets, the core-shell interface is a cylindrical surface concentric with the external one. In this modeling, according to Fig. (1), for a cylinder, it is assumed that the gas diffuses radial-ly from the side, whereas the effect of diffusion in the axial direction is neglected. This means that the model is more accurate if the radius of the particle is much smaller than its height. This as-sumption allows for considering a one-dimensional problem. One advantage of assuming a core-shell type reaction is that the global con-version of the single particle is simply related to the position of the core-shell interface [2, 6]. The conversion is in fact defined as:
) 0 (
) ( ) 0 ( ) (
B B B
B t n n n t
x (1)
where
n
B is the number of moles of the reagentsolid into the particle. If the reagent is present only in the core, then the amount of reagent in the particle is linearly related to the volume of the core via the reagent density:
Bc Bc Bc
B t MW V
n ( ) (2)
) 0 (
) ( 1
Bc Bc
B VV t
x
(3)
For this particle, the surface area (SB) and the
volume (VB) of the particle are obtained using
Eqs. (4) and (5) for a particle at initial time and Eqs. (6) and (7) at t (or for unreacted core), re-spectively:
RL
B
S
2
(4)L R B
V
2 (5)L
r
S
Bc
2
Bc (6)L
r
V
Bc
Bc2 (7)where L is the length,
r
Bc is the radius ofunre-acted core, and R is the original cylindrical pellet. Eq. (3), as a function of the pellet radius, is ob-tained by the following equation:
2
) ( 1
R r
x Bc
B (8)
The system of equations for the gas and solid can be easily solved by considering a number of pos-sible simplifications. In this research, we use the rate-controlling step for analysis, because the re-sistances of the different steps usually vary great-ly. In such cases, we may consider the step with the highest resistance to be rate-controlling. In this treatment, we develop the conversion equations for cylindrical particles, for which the steps:
1. Diffusion of gaseous reactant A through the film surrounding the particle diffusion;
2. Penetration and diffusion of A through the blanket of ash to the surface of the unreacted core; and
3. Reaction of gaseous A with solid at this reac-tion surface
We then extend the analysis to situations where the combined effect of these three resistances must be considered [1, 4-6].
2.1. Diffusion through gas film layer
Whenever the resistance of the gas film is con-trolled, no gaseous reactant is present on the par-ticle surface; hence, the concentration driving force CAg- CAs, becomes CAg and is constant at all
times during reaction of the particle. Now, since it is convenient to derive the kinetic equations based on available surface, we focus on the un-changing exterior surface of aparticle Sex. From the stoichiometry of Eq. (1), we get:
A
B
bdN
dN
(9)1 1
2
( )
2
cos tan
B B
ex
A
g Ag As
g Ag
dN dN
S dt RL dt dN
b bk C C
RL dt
bk C t
(10)
where kgis the mass transfer coefficient between fluid and particle.
Where 𝐶𝐶𝐴𝐴𝐴𝐴 is concentration of A in the gas phase,
𝐶𝐶𝐴𝐴𝐴𝐴 is concentration of A on the unreacted core
surface and 𝑘𝑘𝐴𝐴 is the mass transfer Lcoefficient
between fluid and particle. et ρB be the molar density of B in the solid and V be the volume of aparticle; the amount of B present in a particle is:
) )(
( 3
3solid m solid
m molesB V
NB
B B (11)then,
c dr cr B L cr d B B dV B A bdN B
dN ( 2 )2
(12)
Replacing Eq. (12) in Eq. (10) gives the rate of reaction in terms of the shrinking radius of the unreacted core, or:
.
2
1 1
2 B c c
B B
ex
c c B
Lr dr dN
r
S dt RL dt
r dr Rdt
(13)
Rearranging and integrating, we find how the un-reacted core shrinks with time:
) ) ( 1 ( 2
2 R r C
bk R
t c
Ag g
B
(14)
Let the time for complete conversion of a particle be
.Then, by taking rc = 0in Eq. (14), we find:
Ag g B f 2bk CR
(15)
) 0 ( ) ( 1 Bc Bc
B VV t
x
(3)
For this particle, the surface area (SB) and the
volume (VB) of the particle are obtained using
Eqs. (4) and (5) for a particle at initial time and Eqs. (6) and (7) at t (or for unreacted core), re-spectively:
RL
B
S
2
(4)L R B
V
2 (5)L
r
S
Bc
2
Bc (6)L
r
V
Bc
Bc2 (7)where L is the length,
r
Bc is the radius ofunre-acted core, and R is the original cylindrical pellet. Eq. (3), as a function of the pellet radius, is ob-tained by the following equation:
2 ) ( 1 R r x Bc
B (8)
The system of equations for the gas and solid can be easily solved by considering a number of pos-sible simplifications. In this research, we use the rate-controlling step for analysis, because the re-sistances of the different steps usually vary great-ly. In such cases, we may consider the step with the highest resistance to be rate-controlling. In this treatment, we develop the conversion equations for cylindrical particles, for which the steps:
1. Diffusion of gaseous reactant A through the film surrounding the particle diffusion;
2. Penetration and diffusion of A through the blanket of ash to the surface of the unreacted core; and
3. Reaction of gaseous A with solid at this reac-tion surface
We then extend the analysis to situations where the combined effect of these three resistances must be considered [1, 4-6].
2.1. Diffusion through gas film layer
Whenever the resistance of the gas film is con-trolled, no gaseous reactant is present on the par-ticle surface; hence, the concentration driving force CAg- CAs, becomes CAg and is constant at all
times during reaction of the particle. Now, since it is convenient to derive the kinetic equations based on available surface, we focus on the un-changing exterior surface of aparticle Sex. From the stoichiometry of Eq. (1), we get:
A
B
bdN
dN
(9)1 1 2 ( ) 2 cos tan B B ex A
g Ag As
g Ag
dN dN
S dt RL dt dN
b bk C C
RL dt
bk C t
(10)where kgis the mass transfer coefficient between fluid and particle.
Where 𝐶𝐶𝐴𝐴𝐴𝐴 is concentration of A in the gas phase,
𝐶𝐶𝐴𝐴𝐴𝐴 is concentration of A on the unreacted core
surface and 𝑘𝑘𝐴𝐴 is the mass transfer Lcoefficient
between fluid and particle. et ρB be the molar density of B in the solid and V be the volume of aparticle; the amount of B present in a particle is:
) )(
( 3
3solid m solid
m molesB V
NB
B B (11)then, c dr cr B L cr d B B dV B A bdN B
dN ( 2 )2
(12)
Replacing Eq. (12) in Eq. (10) gives the rate of reaction in terms of the shrinking radius of the unreacted core, or:
.
2
1 1
2 B c c
B B ex c c B Lr dr dN r
S dt RL dt
r dr Rdt
(13)
Rearranging and integrating, we find how the un-reacted core shrinks with time:
) ) ( 1 ( 2 2 R r C bk R t c Ag g B (14)
Let the time for complete conversion of a particle be
.Then, by taking rc = 0in Eq. (14), we find:
Ag g B f 2bk CR
(15)
The radius of unreacted core in terms of fraction-al time for complete conversion is obtained by combining Eqs. (14) and (15):
2 ) ( 1 R r t c f
(16)Using Eq. (8), this equation can be written in terms of fractional conversion:
B f
X t
(17)
The contact time or reaction time needed for any specific conversion of solid in the plug flow is the same for all particles. Therefore, for a particle or number of particles, the conversion is the same and found directly from Eq. (17) for the gas film diffusion in controlling step [6-9].
Consider a solid feed consisting a mixture of dif-ferent-size particles. Size distribution of this feed can be represented either as a continuous distri-bution or as a discrete distridistri-bution.
Let F be the quantity of solid being treated in unit time. Since the density of solid may change during the reaction, F is defined as the volumetric feed rate of solid in the general case. Where density change of the solid is negligible, F can represent the mass feed rate of solid as well. In addition, let F(Ri) be the quantity of material of size about Ri
fed to the reactor. If Rm is the largest particle size
in the feed, we have for particles of unchanging size: ) (
m i R R i R FF (18)
when in plug flow all solids stay in the reactor for the same length of time tp. From this and the
ki-netics for whatever resistance controls, the con-version XB(Ri) for any size of particle Ri can be
found. Then, the mean conversion XB of the solids
leaving the reactor can be obtained by properly summing to find the overall contribution to the conversion of all sizes of particles. Thus:
F R F R X X i i R t R B B m p ) ( ) ( 1 [ 1 ) (
(19)where
R
(
t
p
)
is the radius of the largest par-ticle completely converted in the reactor.For the mixed flow of a single particle, conversion depends on the residence time in bed and resi-dence time of each particle is different. Thus, the mean conversion of solid particles must be used:
Edt X
X A
B
B (1 )
1
0
(20)
where E is the exit age distribution of the solids in the reactor. For the mixed flow of solids, the resi-dence time is calculated as follows:
t t
e t
E1 (21)
Replacing Eq. (21) in Eq. (20) gives:
dt e t X X t t B B A
(1 )1
1
0
(22)
For gas film controlling step, replacing Eq. (17) in Eq. (22) gives the mean conversion as the follow-ing equation [1]:
t f f B f
e
t
t
X
1
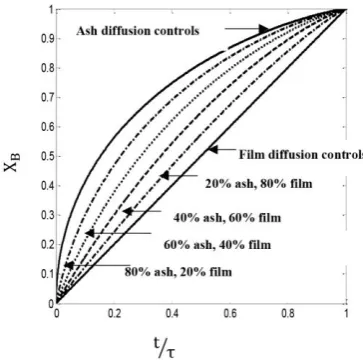
(23)The above conversion-time expressions assume that single resistance controls throughout reac-tion of the particle. However, the relative im-portance of the gas film, ash layer, and reaction steps will vary as particle conversion progresses. For example, for a constant-size particle, the gas film resistance remains unchanged; the resistance to reaction increases as the surface of unreacted core decreases; and the ash layer resistance is nonexistent at the start because no ash is present, but becomes progressively important as the ash layer builds up. In general, then, it may not be reasonable to consider that just one step controls throughout the reaction. The conversion and res-idence time for cylindrical-shaped particles of constant size is calculated for film diffusion con-trols, ash diffusion concon-trols, chemical reaction controls, and the combination of them.
3. Results and Discussion
These results are shown in Tables (1) and (2). For evaluation of this modeling, the results of the model are compared with corresponding experi-mental data. The comparison between the math-ematical modeling results and experimental data at various temperatures is shown in Fig. (3). The experimental data from the reaction of anthra-quinone and sodium sulfide is obtained in an al-kaline environment [10].
Table 1. Conversion-time expressions for plug and mixed
flows
Combination of film diffu-sion, ash Diffusion, and reaction controls
𝑡𝑡𝑡𝑡= 𝑡𝑡𝑓𝑓+ 𝑡𝑡𝐴𝐴+ 𝑡𝑡𝑟𝑟
𝑡𝑡𝑡𝑡= 𝜏𝜏𝑓𝑓𝑋𝑋𝐵𝐵+ 𝜏𝜏𝐴𝐴[(1 − XB) ln(1 − XB) + XB]
+ 𝜏𝜏𝑟𝑟[1 − (1 − XB)1⁄2]
Combination of film diffu-sion and ash diffusion controls
𝑡𝑡𝑡𝑡= 𝑡𝑡𝑓𝑓+ 𝑡𝑡𝐴𝐴
𝑡𝑡𝑡𝑡= 𝜏𝜏𝑓𝑓𝑋𝑋𝐵𝐵+ 𝜏𝜏𝐴𝐴[(1 − 𝑋𝑋𝐵𝐵) 𝑙𝑙𝑙𝑙(1 − 𝑋𝑋𝐵𝐵) + 𝑋𝑋𝐵𝐵]
Combination of film diffu-sion and reaction controls
𝑡𝑡𝑡𝑡= 𝑡𝑡𝑓𝑓+ 𝑡𝑡𝑟𝑟
𝑡𝑡𝑡𝑡= 𝜏𝜏𝑓𝑓𝑋𝑋𝐵𝐵+ 𝜏𝜏𝑟𝑟[1 − (1 − 𝑋𝑋𝐵𝐵)1⁄2]
Combination of ash diffu-sion and reaction controls
𝑡𝑡𝑡𝑡= 𝑡𝑡𝐴𝐴+ 𝑡𝑡𝑟𝑟
𝑡𝑡𝑡𝑡= 𝜏𝜏𝐴𝐴[(1 − 𝑋𝑋𝐵𝐵) 𝑙𝑙𝑙𝑙(1 − 𝑋𝑋𝐵𝐵) + 𝑋𝑋𝐵𝐵]
+ 𝜏𝜏𝑟𝑟[1 − (1 − 𝑋𝑋𝐵𝐵)1⁄2]
Figure 3. Conversion versus time of Anthraqulnone
reac-tion with the radius of 26.5μm[10]
It can be seen in this figure that the results of the model have a good consistency with the experi-mental data. In addition, according to this figure, by increasing the reaction temperature, the version of reaction increases. The result of con-version versus time for a plug flow in the reactor filled with cylindrical particles is given in Fig. (4).
Figure 4. Conversion versus residence time for plug flow
when the chemical reaction rate is controlled by each of the resistances individually
Table 2. Conversion-time expressions for plug flow and
the combination of resistances
Reaction controls
Ash diffu-sion con-trols
Film diffusion controls
Pl
ug Flo
w XB=t τ 𝜏𝜏𝑓𝑓= 2 𝑏𝑏𝐾𝐾𝑔𝑔𝐶𝐶𝐴𝐴𝑔𝑔 𝜌𝜌𝐵𝐵𝑅𝑅
𝑡𝑡 𝜏𝜏𝐴𝐴 = (1 − 𝑋𝑋𝐵𝐵) 𝑙𝑙𝑙𝑙(1 − 𝑋𝑋𝐵𝐵) + 𝑋𝑋𝐵𝐵 𝜏𝜏𝐴𝐴 = 4 𝑏𝑏𝐷𝐷𝑒𝑒𝐶𝐶𝐴𝐴𝑔𝑔 𝜌𝜌𝐵𝐵𝑅𝑅2
XB= 1 − (1 −τt)2
𝜏𝜏𝑟𝑟=𝑏𝑏𝑘𝑘𝜌𝜌𝐵𝐵𝑅𝑅′′𝐶𝐶𝐴𝐴𝑔𝑔
M
ix
ed
Flo
w X̅B= 1 −τ − t̅ τ −τ et̅ −τt̅
𝜏𝜏𝑓𝑓= 2 𝑏𝑏𝐾𝐾𝑔𝑔𝐶𝐶𝐴𝐴𝑔𝑔 𝜌𝜌𝐵𝐵𝑅𝑅 𝑋𝑋𝐵𝐵 ̅̅̅̅ = 1 − ∫ (1𝜏𝜏
0
− 𝑋𝑋𝐵𝐵)𝑒𝑒− 𝑡𝑡 𝑡𝑡̅ 𝑡𝑡̅ 𝑑𝑑𝑡𝑡 𝑡𝑡 𝜏𝜏𝐴𝐴 = (1 − 𝑋𝑋𝐵𝐵) 𝑙𝑙𝑙𝑙(1 − 𝑋𝑋𝐵𝐵) + 𝑋𝑋𝐵𝐵 𝜏𝜏𝐴𝐴 = 4 𝑏𝑏𝐷𝐷𝑒𝑒𝐶𝐶𝐴𝐴𝑔𝑔 𝜌𝜌𝐵𝐵𝑅𝑅2
X̅B = 1
−τ2− 2τt̅ + 2t̅τ2 2
These results are shown in Tables (1) and (2). For evaluation of this modeling, the results of the model are compared with corresponding experi-mental data. The comparison between the math-ematical modeling results and experimental data at various temperatures is shown in Fig. (3). The experimental data from the reaction of anthra-quinone and sodium sulfide is obtained in an al-kaline environment [10].
Table 1. Conversion-time expressions for plug and mixed
flows
Combination of film diffu-sion, ash Diffusion, and reaction controls
𝑡𝑡𝑡𝑡= 𝑡𝑡𝑓𝑓+ 𝑡𝑡𝐴𝐴+ 𝑡𝑡𝑟𝑟
𝑡𝑡𝑡𝑡= 𝜏𝜏𝑓𝑓𝑋𝑋𝐵𝐵+ 𝜏𝜏𝐴𝐴[(1 − XB) ln(1 − XB) + XB]
+ 𝜏𝜏𝑟𝑟[1 − (1 − XB)1⁄2]
Combination of film diffu-sion and ash diffusion controls
𝑡𝑡𝑡𝑡= 𝑡𝑡𝑓𝑓+ 𝑡𝑡𝐴𝐴
𝑡𝑡𝑡𝑡= 𝜏𝜏𝑓𝑓𝑋𝑋𝐵𝐵+ 𝜏𝜏𝐴𝐴[(1 − 𝑋𝑋𝐵𝐵) 𝑙𝑙𝑙𝑙(1 − 𝑋𝑋𝐵𝐵) + 𝑋𝑋𝐵𝐵]
Combination of film diffu-sion and reaction controls
𝑡𝑡𝑡𝑡= 𝑡𝑡𝑓𝑓+ 𝑡𝑡𝑟𝑟
𝑡𝑡𝑡𝑡= 𝜏𝜏𝑓𝑓𝑋𝑋𝐵𝐵+ 𝜏𝜏𝑟𝑟[1 − (1 − 𝑋𝑋𝐵𝐵)1⁄2]
Combination of ash diffu-sion and reaction controls
𝑡𝑡𝑡𝑡= 𝑡𝑡𝐴𝐴+ 𝑡𝑡𝑟𝑟
𝑡𝑡𝑡𝑡= 𝜏𝜏𝐴𝐴[(1 − 𝑋𝑋𝐵𝐵) 𝑙𝑙𝑙𝑙(1 − 𝑋𝑋𝐵𝐵) + 𝑋𝑋𝐵𝐵]
+ 𝜏𝜏𝑟𝑟[1 − (1 − 𝑋𝑋𝐵𝐵)1⁄2]
Figure 3. Conversion versus time of Anthraqulnone
reac-tion with the radius of 26.5μm[10]
It can be seen in this figure that the results of the model have a good consistency with the experi-mental data. In addition, according to this figure, by increasing the reaction temperature, the version of reaction increases. The result of con-version versus time for a plug flow in the reactor filled with cylindrical particles is given in Fig. (4).
Figure 4. Conversion versus residence time for plug flow
when the chemical reaction rate is controlled by each of the resistances individually
Table 2. Conversion-time expressions for plug flow and
the combination of resistances
Reaction controls
Ash diffu-sion con-trols
Film diffusion controls
Pl
ug Flo
w XB=t τ 𝜏𝜏𝑓𝑓= 2 𝑏𝑏𝐾𝐾𝜌𝜌𝐵𝐵𝑅𝑅𝑔𝑔𝐶𝐶𝐴𝐴𝑔𝑔
𝑡𝑡 𝜏𝜏𝐴𝐴 = (1 − 𝑋𝑋𝐵𝐵) 𝑙𝑙𝑙𝑙(1 − 𝑋𝑋𝐵𝐵) + 𝑋𝑋𝐵𝐵 𝜏𝜏𝐴𝐴 = 4 𝑏𝑏𝐷𝐷𝑒𝑒𝐶𝐶𝐴𝐴𝑔𝑔 𝜌𝜌𝐵𝐵𝑅𝑅2
XB= 1 − (1 −τt)2
𝜏𝜏𝑟𝑟=𝑏𝑏𝑘𝑘𝜌𝜌𝐵𝐵𝑅𝑅′′𝐶𝐶𝐴𝐴𝑔𝑔
M
ix
ed
Flo
w X̅B= 1 −τ − t̅ τ −t̅τ e−τt̅
𝜏𝜏𝑓𝑓= 2 𝑏𝑏𝐾𝐾𝜌𝜌𝐵𝐵𝑅𝑅𝑔𝑔𝐶𝐶𝐴𝐴𝑔𝑔 𝑋𝑋𝐵𝐵 ̅̅̅̅ = 1 − ∫ (1𝜏𝜏
0
− 𝑋𝑋𝐵𝐵)𝑒𝑒− 𝑡𝑡 𝑡𝑡̅ 𝑡𝑡̅ 𝑑𝑑𝑡𝑡 𝑡𝑡 𝜏𝜏𝐴𝐴 = (1 − 𝑋𝑋𝐵𝐵) 𝑙𝑙𝑙𝑙(1 − 𝑋𝑋𝐵𝐵) + 𝑋𝑋𝐵𝐵 𝜏𝜏𝐴𝐴 = 4 𝑏𝑏𝐷𝐷𝑒𝑒𝐶𝐶𝐴𝐴𝑔𝑔 𝜌𝜌𝐵𝐵𝑅𝑅2
X̅B = 1
−τ2− 2τt̅ + 2t̅τ2 2
+2t̅τ22e−τt̅ 𝜏𝜏𝑟𝑟=𝑏𝑏𝑘𝑘𝜌𝜌𝐵𝐵𝑅𝑅′′𝐶𝐶𝐴𝐴𝑔𝑔
In this case, the rate of chemical reaction is con-trolled by each of the resistances (including the gas film layer resistance, the ash layer resistance, and the chemical reaction resistance), individual-ly. As can be seen in this figure, for a specified time, in the case the chemical reaction rate is con-trolled by the ash layer resistance, the conversion is greater than the rates of chemical reaction con-trolled by the other two regimes.
It has been assumed up to now that a single resistance controls throughout reaction of the cylindrical particle. However, the relative im-portance of the gas film, ash layer, and reaction steps will vary as particle conversion progresses. In the following, the effect of the combination of resistances on the conversion of reaction and the residence time of reaction is checked.
The effect of the combination of resistances in-cluding gas film layer resistance and ash layer resistance for a plug flow in the reactor filled with cylindrical particles has been studied. The results of this study are shown in Fig. (5).
In this case, gas film layer resistance and ash lay-er resistance control the rate of the reaction, sim-ultaneously. According to this figure, for a specific conversion, by reducing gas film layer resistance and by increasing the ash layer resistance, the reaction time is reduced. It can also be said that for a specified time, by reducing gas film layer resistance and by increasing the ash layer re-sistance, the reaction conversion increases. When a hard solid ash forms during the reaction, the resistance of gas-phase reactant through this ash layer is usually much greater than that through the gas film surrounding the particle. Hence, in the presence of a nonflaking ash layer, film re-sistance can be safely ignored.
Fig. (6) shows the effect of the combination of resistances including gas film layer resistance and the chemical reaction resistance for a plug flow in the reactor filled with cylindrical particles. In this case, the gas film layer resistance and the chemi-cal reaction resistance control the rate of the re-action, simultaneously.
The same situation can be seen in this figure. As can be seen, for a specific conversion, by reducing the gas film layer resistance and by increasing the chemical reaction resistance, the reaction time is reduced. Furthermore, for a specified time, by reducing the gas film layer resistance and by
in-creasing the chemical reaction resistance, the re-action conversion increases.
Figure 5. Conversion versus residence time for plug flow
when the chemical reaction rate is controlled by the gas film layer resistance and the ash layer resistance simulta-neously
Figure 6. Conversion versus residence time for plug flow
when the chemical reaction rate is controlled by the gas film layer resistance and the chemical reaction resistance simultaneously
The effect of the combination of resistances in-cluding the ash layer resistance and chemical re-action resistance for a plug flow in the reactor filled with cylindrical particles is illustrated in Fig. (7).
As can be seen, for a specific conversion and for the conversions lower than 0.92, by increasing the ash layer resistance and by reducing the reac-tion resistance, the reacreac-tion time is reduced. For the conversions greater than 0.92, this trend is reversed. Moreover, for a specified time, by in-creasing the ash layer resistance and by reducing the chemical reaction resistance, the reaction conversion increases.
Figure 7. Conversion versus residence time for plug flow
when the chemical reaction rate is controlled by the ash layer resistance and the chemical reaction resistance sim-ultaneously
Fig. (8) shows the effect of three different re-sistance regimes for a plug flow in the reactor filled with cylindrical particles. In this case, the gas film layer resistance, the ash layer resistance, and the chemical reaction control the rate of the reaction, simultaneously. As can be observed in this figure, when the gas film layer resistance is considered to be fixed, for a specific conversion and for the conversions lower than 0.92, by in-creasing the ash layer resistance and by reducing the chemical reaction resistance, the reaction time is reduced. For the conversions greater than 0.92, this trend is reversed. Also, for a specified time, by increasing the ash layer resistance and by reducing the chemical reaction resistance, the reaction conversion increases.
Until now, the studies have been based on plug flow of cylindrical particles. But, from now on, in the following, the mixed flow of cylindrical parti-cles is offered. The result of conversion versus time for a mixed flow in the reactor filled with cylindrical particles is given in Fig. (9).
Figure 8. Conversion versus residence time for plug flow
when the chemical reaction rate is controlled by the gas film layer resistance, the ash layer resistance, and chemi-cal reaction resistance simultaneously
In this situation, the rate of chemical reaction is controlled by each of the resistances (including the gas film layer resistance, the ash layer resistance, and the chemical reaction resistance), individually. As can be seen in this figure, for a specified time, in the case the chemical reactions rate is controlled by the ash layer resistance, the conversion is greater than the rates of chemical reactions controlled by the other two regimes. On the other hand, for a specified reaction conver-sion, in the case of chemical reactions controlled by ash layer resistance, the time required for the rate of chemical reactions is less than that in the other two regimes.
Figure 9. Conversion versus residence time for mixed
flow when the chemical reaction rate is controlled by each of the resistances individually
The effect of the combination of resistances in-cluding the gas film layer resistance and ash layer resistance for a mixed flow in the reactor filled with cylindrical particles is illustrated in Fig. (10). In this case, gas film layer resistance and ash lay-er resistance control the rate of the reaction, sim-ultaneously. According to this figure, for a specific conversion, by reducing gas film layer resistance and by increasing the ash layer resistance, the reaction time is reduced. In other words, for a specified time, by reducing gas film layer sistance and by increasing the ash layer re-sistance, the reaction conversion increases.
Figure 10. Conversion versus residence time for mixed flow when the chemical reaction rate is controlled by the gas film layer resistance and the ash layer resistance simultaneously
The result of conversion versus time for a mixed flow in the reactor filled with cylindrical particles is shown as in Fig. (11). In this case, the gas film layer resistance and the chemical reaction re-sistance control the rate of the reaction, simulta-neously.
The same situation can be seen in this figure. As can be seen, for a specific conversion, by reducing the gas film layer resistance and by increasing the chemical reaction resistance, the reaction time is reduced. Furthermore, for a specified time, by reducing the gas film layer resistance and by in-creasing the chemical reaction resistance, the re-action conversion increases.
The effect of the combination of resistances in-cluding the ash layer resistance and chemical re-action resistance for a mixed flow in the reactor filled with cylindrical particles is illustrated in Fig. (12). In this situation, the ash layer resistance
and chemical reaction resistance control the rate of the reaction, simultaneously. As can be ob-served in this figure, by increasing the ash layer resistance and by reducing the reaction re-sistance, the reaction time is reduced. Moreover, for a specified time, by increasing the ash layer resistance and by reducing the chemical reaction resistance, the reaction conversion increases.
Figure 11. Conversion versus residence time for mixed
flow when the chemical reaction rate is controlled by the
gas film layer resistance and the chemical reaction re-sistance simultaneously
Finally, the effect of three different resistance re-gimes on the conversion of reaction and resi-dence time for a mixed flow in the reactor filled with cylindrical particles is given in Fig. (13). In this case, the gas film layer resistance, the ash layer resistance, and the chemical reaction control the rate of the reaction, simultaneously. As can be seen in this figure, when the gas film layer resistance is considered to be fixed, for a specific conversion, by increasing the ash layer resistance and by reducing the chemical reaction resistance, the reaction time is reduced. Also, for a specified time, by increasing the ash layer re-sistance and by reducing the chemical reaction resistance, the reaction conversion increases.
4. Conclusion
was developed for the case the chemical reaction rate was controlled by the gas film layer re-sistance, the ash layer rere-sistance, and the chemi-cal reaction resistance as well as the combination of them. The mentioned studies were related to innovations of this research. For evaluation of modeling, the results of the model were com-pared with experimental data. The results indi-cated that there was consistency between them. Also, The results showed at a certain time, when the rate of chemical reaction was controlled by each of the resistances individually, if the reaction was controlled by the ash layer resistance, then, the conversion rate was higher than that when the chemical reaction was controlled by the other two resistance regimes.
Figure 12. Conversion versus residence time for mixed
flow when the chemical reaction rate is controlled by the chemical reaction resistance and the ash layer resistance simultaneously
Figure 13. Conversion versus residence time for mixed
flow when the chemical reaction rate is controlled by the
gas film layer resistance, the ash layer resistance, and the chemical reaction resistance simultaneously
In addition, the results showed either resistance alone or a combination of them was effective on the conversion and residence time reaction. How-ever, the relative importance of the gas film, ash layer, and chemical reaction steps would vary as particle conversion progressed. For a constant-size particle, the gas film resistance remained un-changed; the resistance to reaction increased as the surface of unreacted core decreased; and the ash layer resistance was nonexistent at the start because no ash was present, but became progres-sively important as the ash layer built up. In gen-eral, therefore, it may not be reasonable to con-sider that just one step controls throughout the reaction.
Acknowledgements
The author is grateful to the Shiraz University of Technology for supporting this work.
Nomenclature
b Stoichiometry coefficient of the compo-nent B
CAg Concentration of (mole/m3) A in the gas phase
CAs Concentration of surface (mole/m3A) on the unreacted core
E The exit age distribution of the solids in the reactor
F Total mole of feed
F(Ri) Mole of feed with size Ri
L Length of particle (m)
kg Mass transfer coefficient between fluid and particle
Mw Molecular weight (g/gmole)
nB Number of moles of the reagent solid into the particle (mole)
NB Number of moles of solid (mole)
ρB Molar density of B in the solid (mole/m3)
xB Solid conversion
B
X
Mean solid conversionR Radius of particle (m)
r Radius of particle (m)
rc Radius of the unreacted core, (m)
Rm The largest particle size in the feed (m)
) (tp
R Radius of the largest particle completely converted in the reactor
Sex External surface of particle (m2)
SB Surface of particle ( m2)
t Time of reaction (s)
τ The time for complete conversion of a particle (S)
t
Residence time (s)was developed for the case the chemical reaction rate was controlled by the gas film layer re-sistance, the ash layer rere-sistance, and the chemi-cal reaction resistance as well as the combination of them. The mentioned studies were related to innovations of this research. For evaluation of modeling, the results of the model were com-pared with experimental data. The results indi-cated that there was consistency between them. Also, The results showed at a certain time, when the rate of chemical reaction was controlled by each of the resistances individually, if the reaction was controlled by the ash layer resistance, then, the conversion rate was higher than that when the chemical reaction was controlled by the other two resistance regimes.
Figure 12. Conversion versus residence time for mixed
flow when the chemical reaction rate is controlled by the chemical reaction resistance and the ash layer resistance simultaneously
Figure 13. Conversion versus residence time for mixed
flow when the chemical reaction rate is controlled by the
gas film layer resistance, the ash layer resistance, and the chemical reaction resistance simultaneously
In addition, the results showed either resistance alone or a combination of them was effective on the conversion and residence time reaction. How-ever, the relative importance of the gas film, ash layer, and chemical reaction steps would vary as particle conversion progressed. For a constant-size particle, the gas film resistance remained un-changed; the resistance to reaction increased as the surface of unreacted core decreased; and the ash layer resistance was nonexistent at the start because no ash was present, but became progres-sively important as the ash layer built up. In gen-eral, therefore, it may not be reasonable to con-sider that just one step controls throughout the reaction.
Acknowledgements
The author is grateful to the Shiraz University of Technology for supporting this work.
Nomenclature
b Stoichiometry coefficient of the compo-nent B
CAg Concentration of (mole/m3) A in the gas phase
CAs Concentration of surface (mole/m3A) on the unreacted core
E The exit age distribution of the solids in the reactor
F Total mole of feed
F(Ri) Mole of feed with size Ri
L Length of particle (m)
kg Mass transfer coefficient between fluid and particle
Mw Molecular weight (g/gmole)
nB Number of moles of the reagent solid into the particle (mole)
NB Number of moles of solid (mole)
ρB Molar density of B in the solid (mole/m3)
xB Solid conversion
B
X
Mean solid conversionR Radius of particle (m)
r Radius of particle (m)
rc Radius of the unreacted core, (m)
Rm The largest particle size in the feed (m)
) (tp
R Radius of the largest particle completely converted in the reactor
Sex External surface of particle (m2)
SB Surface of particle ( m2)
t Time of reaction (s)
τ The time for complete conversion of a particle (S)
t
Residence time (s)VB Volume of particle (m3)
References
1. Levenspiel, O. (1999). "Chemical Reaction En-gineering." Third Edition, John Wiley & Sons, New York.
2. Gbor, P. K., Jia, C. Q. (2004). "Critical evaluation of coupling particle size distribution with the shrinking core model." Chemical Engineering Science, Vol. 59, pp. 1979-1987.
3. Noorman, S., Gallucci, F., Annaland, V.S.M., Kuipers, J.A.M. (2011). "A theoretical investi-gation of CLC in packed beds. Part 1: Particle model." Chemical EngineeringJournal, Vol. 167, pp. 297-307.
4. Tsinontides, S. C., Jackson, R. (1993). "The me-chanics of gas fluidized beds with an interval of stable fluidization.” Journal Fluid Mechanic, Vol. 255, pp. 231-214.
5. Fan, L.S. (1989). "Gas-Liquid-Solid Fluidization Engineering." Butterworths, Stoneham, MA, 1989.
6. Ebrahimi, A.A., Ebrahim, H.A., Jamshidi, E. (2008). "Solving partial differential equations of gas–solid reactions by orthogonal colloca-tion." Computers and Chemical Engineering, Vol. 32, pp.1746–1759.
7. Movagarnejad, K., Sohrabi, M., Kaghazchi, T., Vahabzadeh,F. (2000). ''A model for the rate of enzymatic hydrolysis of cellulose in heteroge-neous solid–liquid systems.'' Biochemical En-gineering Journal, Vol. 4, pp. 197–206.
8. Yagi, S., Kunii, D. (1995). "Studies on combus-tion of carbon particles in flames and fluidized beds." The 5th Symposium on Combustion, New York, USA, pp. 231-236.
9. Sleekly, J., Evans, J.W., Sohn, H.Y. (1976). "Gas-solid reactions." Academic Press.
10. Schmidt, L. D. (1998). "The Engineering of Chemical Reactions." New York: Oxford Uni-versity Press.
11. Abad, A., Adanez, J., Cuadrat, A., Garcia-Labiano, F., Gayan, P., de Diego, L.F. (2011). "Kinetics of redox reactions of ilmenite for chemical-looping combustion." Chemical Engi-neering Science, Vol. 66, pp. 689-702.
12. Amiri, A., Ingram, G.D., Bekker, A.V., Livk, I., Maynard, N.E. (2013). "A stage, multi-reaction shrinking core model for
self-inhibiting gas-solid reactions." Adv. Powder Technol., Vol. 24, pp. 728-736.
13. Gbor, P. K., Jia, C.Q. (2004). "Critical evaluation of coupling particle size distribution with the shrinking core model." Chemical Engineering Science, Vol. 59, pp. 1979-1987.
14. Kruggel-Emden, H., Rickelt, S., Stepanek, F. (2010). "Development and testing of an inter-connected multiphase CFD-model for chemical looping combustion." Chemical Engineering Science, Vol. 65, pp. 4732-4745.
15. Kruggel-Emden, H., Stepanek, F. (2011). "A study on the role of reaction modeling in Mul-ti-phase CFD-based simulations of Chemical Looping Combustion." Oil and Gas Science and Technology, Vol. 66, pp. 313-331.
16. Parisi, D.R., Laborde, M.A. (2004). "Modeling of counter-current moving bed gas-solid reac-tor used in thedirect reduction of iron ore." Chemical Engineering Journal, Vol. 104, pp. 35-43.