S H O R T C O M M U N I C A T I O N
Open Access
A novel partial volume correction method
for accurate quantification of [
18
F]
flortaucipir in the hippocampus
Emma E. Wolters
1,2†, Sandeep S. V. Golla
1*†, Tessa Timmers
1,2, Rik Ossenkoppele
1,2,4, Chris W. J. van der Weijden
1,
Philip Scheltens
2, Lothar Schwarte
3, Robert C. Schuit
1, Albert D. Windhorst
1, Frederik Barkhof
1,5, Maqsood Yaqub
1,
Adriaan A. Lammertsma
1, Ronald Boellaard
1and Bart N. M. van Berckel
1,2Abstract
Background:Off-target binding in the choroid plexus (CP) may cause spill-in of the tau PET tracer [18F] flortaucipir into the adjacent hippocampus region. The impact of this spill-in on hippocampal uptake was assessed using a novel partial volume correction method (PVC).
Methods:PVC was performed on 20 [18F] flortaucipir dynamic PET scans (10 probable AD and 10 controls). Volumes of interest (VOIs) were defined for both hippocampus and CP. The correlation between hippocampal and CP distribution volume (VT), with and without PVC, was determined. Both anatomically defined and eroded VOIs
were used.
Results:For controls, the correlation between hippocampal and CP VTwas significantly reduced after using PVC
along with an eroded VOI (r2= 0.59, slope = 0.80 versusr2= 0.15, slope = 0.15; difference:p< 0.05). The same was true for AD patients (p< 0.05).
Conclusion:PVC together with an optimized hippocampal VOI resulted in effective reduction of CP spill-in and improved accuracy of hippocampal VT.
Introduction
The PET tracer [18F]flortaucipir([18F]AV-1451) is a promising biomarker for in vivo assessment of tau path-ology in AD [1]. However, cautious interpretation of [18F] flortaucipir data is warranted, especially in the hippocampus. Indeed, although tau pathology affects the hippocampus relatively early in the course of the disease [2], [18F] flortaucipir uptake in the hippocampus does not distinguish AD patients from controls [3,4]. A pos-sible explanation may be that the relatively low spatial resolution of PET leads to an underestimation of the sig-nal in a small volume of interest (VOI) such as that of the hippocampus [4], especially in case of atrophy [3]. Resulting partial volume effects (PVE) may cause spill-in or spill-out to adjacent regions with higher or lower
activity, respectively [5]. In the hippocampal region, this could also be the case as high off-target binding in the adjacent choroid plexus (CP) [6] may cause spill-in of [18F] flortaucipir [3,7].
Partial volume correction (PVC) methods are used to correct for PVE. Previous studies used several different MR-based PVC methods [8–11] to process [18F] flortau-cipir scans [7, 11–17]. Although some studies reported no significant effects of PVC on the correlation between tau uptake and cerebrospinal fluid (CSF) measures, cog-nition, and diagnostic accuracy [13,15, 17], the specific impact of the CP signal on hippocampal [18F] flortauci-pir uptake has yet to be evaluated.
In this study, PVC was performed using a method that combines Van Cittert (VC) iterative deconvolution (IDM) with highly constrained back-projection (HYPR) denoising. The combination of HYPR and VC IDM (Hypr-IDM-Hypr, HDH) was recently developed and validated [18] and allows for more accurate
* Correspondence:[email protected]
†Emma E. Wolters and Sandeep S. V. Golla contributed equally to this work.
1Departments of Radiology & Nuclear Medicine, VU University Medical
Center, PO Box 7057, 1007MB Amsterdam, The Netherlands Full list of author information is available at the end of the article
quantification of PET images. The purpose of the present study was to assess the impact of CP activity on quantification of hippocampal [18F] flortaucipir binding and to correct for spill-in using HDH PVC.
Methods
Participants
Ten patients with probable AD [19] and 10 cognitively healthy controls from the Amsterdam Dementia Cohort of the VU University Medical Center were included. Probable AD patients were only included if they had a positive [18F] florbetaben (amyloid-β) PET scan (visually read) and/or an AD-like CSF profile [19–21]. All sub-jects underwent the same study protocol as described before [22]. The study protocol was approved by the Medical Ethics Review Committee of the VU University Medical Center. The data were acquired for a prospect-ive study that was focused on model evaluation.
Data acquisition
All subjects underwent 3D-T1 weighted and FLAIR scans on a 3.0 Tesla MR scanner (Ingenuity TF PET/ MR, Philips Medical Systems, Best, The Netherlands).
Dynamic PET emission scans were acquired using a Philips Gemini TF-64 PET/CT scanner. The protocol consisted of a dynamic scan of 130 min, after injection of 224 ± 18 MBq [18F] flortaucipir, with a 20-min break after the first 60 min. Each part of the scanning period started with a low-dose CT scan for attenuation correction [22].
Both continuous and manual arterial blood sampling were performed [22], to obtain a metabolite corrected plasma input function.
Data analysis
Partial volume correction
A recently described combination of HYPR denoising and VC IDM was used to generate HDH PVC PET images (18). The VC IDM was used for enhancing the spatial resolution of the PET images. As the signal-to-noise ratio (SNR) also reduces with each iteration, HYPR was used to limit the de-crease in SNR, thereby preserving image quality.
Volumes-of-interest
The second session PET scan was co-registered to the first session PET scan using VINCI (developed by S Vollmar) [23] for motion correction between the two sessions. Both T1-weighted and FLAIR MR images were co-registered to the summed PET images (5 to 29 frames were used) using VINCI software. Hippocampal VOI was defined in two different ways. First, the complete hippocampal VOI was extracted from the Hammers template [24] using PVElab [25] and the T1-weighted MR images. The automatic delineation is not perfect, and so even after PVC, it is possible that a
relationship between choroid plexus and hippocampus might still persist because of the presence of the choroid plexus region voxels in the hippocampal VOI definition. Henceforth, for the second method, CP was defined manually on HDH [18] PVC PET images and the MR FLAIR image was used to crosscheck the VOI definition. Next, the complete hippocampus VOI was superimposed on the FLAIR image, and voxels from this VOI that were in close vicinity of CP were removed from the VOI def-inition, resulting in an “eroded” hippocampus VOI (Additional file 1: Figure S1). Only voxels where CP overlapped with the hippocampus were removed (~ 40% ± 10% of the total hippocampal voxels were removed). For both methods, regional time activity curves (TACs) were extracted by superimposing the VOIs onto all frames of the PET scans.
Kinetic analysis
TACs were analyzed by non-linear regression (NLR) using the two tissue compartment model with reversible kinetics and blood volume fraction parameter (2T4k_VB). It has previously been shown that this is the preferred model to describe in vivo kinetics of [18F] flor-taucipir [22, 26, 27]. Regional volume of distribution (VT) was used as outcome measure.
Statistical analysis
Coefficients of determination (r2) and the slope of both complete and eroded hippocampal VTwith CP VT were calculated. This analysis was performed with and with-out PVC. In addition, interaction effects between hippo-campal and CP VT were evaluated. The non-parametric Wilcoxon signed rank test was used to calculate the dif-ferences between methods.p < 0.05 was considered sta-tistically significant. Statistical analysis was performed in the GraphPad Prism 7.
Results
Ten controls (average age 67.7 ± 6.8 years, MMSE score 29.2 ± 0.6) and 10 probable AD patients (average age 63.9 ± 7.8 years, MMSE score 23.9 ± 3.1) were included. There was no significant difference in age between AD patients and controls (p< 0.05). Additional file2: Figure S2 illustrates the time activity curves for choroid plexus and hippocampus VOIs (with and without PVC).
in combination with PVC (pfor interaction < 0.05) (Fig.2 and Additional file 3: Figure S3). An even stronger ef-fect was observed in case of AD patients when using PVC in combination with the optimized hippocampal VOI (r2= 0.54, slope = 0.98 without PVC versusr2= 0.01, slope =−0.05 with PVC; p for interaction < 0.05) (Figs. 1 and 2).
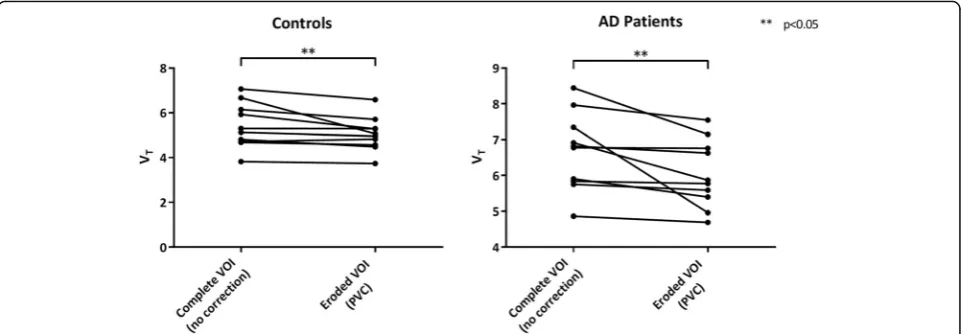
In addition, there was a significant decrease in hippocam-pal VTafter using both PVC and eroded VOI compared with the uncorrected data (Fig. 3 and Additional file 4: Figure S4, p < 0.05). VTs obtained for the choroid plexus and hippocampus (complete and eroded) both before and after PVC for all the subjects included in the study (mean ± SD) are presented in the Additional file5: Figure S5.
Discussion
In order to improve the quantification of [18F] flortauci-pir uptake in the hippocampus, a novel HDH PVC method was used together with an eroded hippocampal VOI to correct for possible spill-in effects from the CP. After PVC and optimizing hippocampal VOI, only a weak correlation remained between hippocampal VTand CP VT, suggesting that spill-in from the CP was success-fully reduced thus allowing for more accurate quantifica-tion of hippocampal [18F] flortaucipir uptake.
Wang et al. [16] showed that PVC [10] reduced the correlation between [18F] flortaucipir hippocampal and CP uptake (r = 0.39, p = 0.003 before PVC vs r = 0.14,
p= 0.31 after PVC). Wang et al. seem to have mitigated the CP’s spill over without the use of hippocampal VOI erosion. Although the PVC implementation used by Wang et al. is not similar to the method used in this study, it can be argued that the relationship between choroid plexus and hippocampus is mitigated when ap-plying PVC. With regard to the use of eroded hippocam-pal VOI, the possible reason for Wang et al. to not require erosion of hippocampal VOI could be that rela-tionship present in their data between choroid plexus and hippocampus was not as strong (r= 0.39) as in our data (r= 0.76, combining both AD and controls). In case of a weak relation, possibly just PVC is sufficient; how-ever, in case of a stronger relation, erosion might be ne-cessary. Another point to note is that before PVC, no significant difference in the VTs was observed between the complete hippocampal VOI and eroded hippocampal VOI (Additional file 5: Figure S5). This suggests that the benefit of erosion was only observed along with the PVC. In addition, Schöll et al. [7] showed that PVC [8] caused a large increase in CP signal, indicating that spill-out from the CP could be reduced, potentially leading to a more ac-curate estimation of tau uptake in the adjacent hippocam-pus. Both studies suggest that PVC can be used to reduce spill-over effects from the CP. Nevertheless, both studies
Fig. 1Coronal [18F] flortaucipir V
Timages before (a) and after (b)
HDH PVC and coronal MR flair (c) in a healthy control (left) and probable AD patient (right)
Fig. 2Scatter plots illustrating the relationship between hippocampus VTand choroid plexus VTbefore (red) and after (blue) using both PVC and
used MR-based PVC methods, and segmentation prob-lems could result in a potential bias [10].
One of the strengths of the present study is that the VC IDM method leads to more accurate quantification of PET images and does not use MR scans for PVC, thereby avoiding potential segmentation and co-registration error. The addition of HYPR reduces the poor SNR of VC IDM, thus preserving image quality [18].
A potential weakness of this study is the fact that CP VOI was defined on PVC PET images rather than on MR images. However, CP activity could clearly be distinguished from that of surrounding tissue, as it was both visually and quantitatively much higher. Even then, a manual VOI definition is prone to error and inter-subject variability. In this study, the same re-searcher worked on the VOI definition to avoid inter-subject variability and to mitigate the error in VOI definition, and the manual VOIs of CP on PET PVC im-ages were validated using MR FLAIR imim-ages. PET PVC-based VOI definitions showed good correspond-ence to the MR FLAIR images, suggesting that PVC PET images can be used for reliable definition of the CP VOI; however, an automatic or a semiautomatic VOI erosion method is warranted. Another limitation would be that there is no ground truth (no autopsy data avail-able) to check the accuracy of the implementation. However, based on the presented analysis, it can be stated that the proposed methodology mitigates the spill-over ef-fects of choroid plexus on hippocampus uptake.
Conclusion
The use of our new PVC method in combination with an optimized hippocampus VOI significantly reduces spill-in of CP activity into the hippocampus and im-proves accuracy of hippocampal VT.
Additional files
Additional file 1:Figure S1.Illustrates the eroded hippocampal VOI definition on a T1 weighted MR scan of a subject (Sagittal slice). (TIF 680 kb)
Additional file 2:Figure S2.Time activity curves (TACs) of choroid plexus and hippocampus VOI (with and without PVC). In case of hippocampal VOI TACs for both complete and eroded VOI are presented. (TIF 475 kb)
Additional file 3:Figure S3.Relationship between the CP and hippocampus when using only erosion or PVC alone. (TIF 208 kb)
Additional file 4:Figure S4.Spaghetti plots of hippocampus complete VOI VT(no corrections) and after using either erosion (no corrections) or
PVC (complete VOI). (TIF 430 kb)
Additional file 5:Figure S5.Box plots (mean ± SD) for VTs obtained for
the choroid plexus and hippocampus (using complete VOI or Eroded VOI) before and after PVC. (TIF 254 kb)
Acknowledgements
We would like to thank Dr. Michael Devous and Dr. Mark A. Mintin for their valuable suggestions.
Funding
This study was funded by AVID pharmaceuticals, ZonMw.
Availability of data and materials
Please contact the author for data requests.
Authors’contributions
EEW and SSVG acquired the data, analyzed and interpreted the data, drafted the manuscript, and approved the final content of the manuscript. TT and LS acquired the data, critically revised the manuscript, and approved the final content of the manuscript. RO, PS, and ADW contributed to the conception and design, enhanced its intellectual content, and approved the final content of the manuscript. CWJvdW analyzed and interpreted the data, critically revised the manuscript, and approved the final content of the manuscript. RCS acquired the data, analyzed and interpreted the data, critically contributed to the manuscript, and approved the final content of the manuscript. FB, MY, AAL, RB, and BNMvB contributed to the conception and design, analyzed and interpreted the data, drafted the manuscript and enhanced its intellectual content, and approved the final content of the manuscript.
Ethics approval and consent to participate
All subjects underwent the same study protocol as described before [22]. Informed consent was obtained from all subjects. The study protocol was approved by the Medical Ethics Review Committee of the VU University Medical Center.
Fig. 3Spaghetti plots of hippocampus VTbefore and after using both PVC and an eroded hippocampal VOI within controls (left) and probable
Consent for publication
Not applicable.
Competing interests
This study was carried out with financial support from AVID to the VU University Medical Center. AVID contributed to the implementation and writing of the study protocol, but were not involved in the design of and analysis for this report. Golla, Wolters, Timmers, Ossenkoppele, van der Weijden, Schwarte, Schuit, Barkhof, Windhorst, Lammertsma, Yaqub, and Boellaard report no conflict of interest.
Van Berckel receives research support from ZON-MW, AVID radiopharmaceuticals, CTMM and Janssen Pharmaceuticals. He is a trainer for Piramal and GE. He receives no personal honoraria.
F. Barkhof is editorial board member of Brain, European Radiology, Neurology®, Multiple Sclerosis Journal, and Radiology; performed consultancy and received personal compensation and honoraria from Bayer-Schering Pharma and Genzyme; received compensation (personal and to institution) and honoraria from Biogen-IDEC, TEVA, Merck-Serono, Novartis, Roche, Synthon BV, and Jansen Research; received payment for development of educational presentations from IXICO and Biogen-IDEC (to institution); is funded by a Dutch MS Society grant, EU-FP7/H2020; and is supported by the NIH Research Biomedical Research Center at University College London Hospital.
Scheltens received grant support (to the institution) from GE Healthcare, Danone Research, Piramal and MERCK. In the past 2 years, he has received consultancy/ speaker fees from Lilly, GE Healthcare, Novartis, Forum, Sanofi, Nutricia, Probiodrug and EIP Pharma. All funding is paid to the institution.
No other potential conflicts of interest relevant to this article exist.
Publisher’s Note
Springer Nature remains neutral with regard to jurisdictional claims in published maps and institutional affiliations.
Author details
1
Departments of Radiology & Nuclear Medicine, VU University Medical Center, PO Box 7057, 1007MB Amsterdam, The Netherlands.2Neurology &
Alzheimer Center, VU University Medical Center, Amsterdam, The Netherlands.3Anaesthesiology, Amsterdam Neuroscience, VU University
Medical Center, Amsterdam, The Netherlands.4Lund University, Clinical Memory Research Unit, Lund, Sweden.5Institutes of Neurology & Healthcare
Engineering, UCL, London, UK.
Received: 22 May 2018 Accepted: 6 August 2018
References
1. Hall B, Mak E, Cervenka S, Aigbirhio FI, Rowe JB, O'Brien JT. In vivo tau PET imaging in dementia: pathophysiology, radiotracer quantification, and a systematic review of clinical findings. Ageing Res Rev. 2017;36:50–63. 2. Braak H, Braak E. Neuropathological stageing of Alzheimer-related changes.
Acta Neuropathol. 1991;82:239–59.
3. Johnson KA, Schultz A, Betensky RA, et al. Tau positron emission tomographic imaging in aging and early Alzheimer disease. Ann Neurol. 2016;79:110–9.
4. Pontecorvo MJ, Devous MD Sr, Navitsky M, et al. Relationships between flortaucipir PET tau binding and amyloid burden, clinical diagnosis, age and cognition. Brain. 2017;140:748–63.
5. Hoffman EJ, Huang SC, Phelps ME. Quantitation in positron emission computed tomography: 1. Effect of object size. J Comput Assist Tomogr. 1979;3:299–308.
6. Marquie M, Normandin MD, Vanderburg CR, et al. Validating novel tau PET tracer [F-18]-AV-1451 (T807) on postmortem brain tissue. Ann Neurol. 2015; 78(5):787–800.
7. Scholl M, Lockhart SN, Schonhaut DR, et al. PET imaging of tau deposition in the aging human brain. Neuron. 2016;89:971–82.
8. Rousset OG, Ma Y, Evans AC. Correction for partial volume effects in PET: principle and validation. J Nucl Med. 1998;39:904–11.
9. Muller-Gartner HW, Links JM, Prince JL, et al. Measurement of radiotracer concentration in brain gray matter using positron emission tomography: MRI-based correction for partial volume effects. J Cereb Blood Flow Metab. 1992;12:571–83.
10. Su Y, Blazey TM, Snyder AZ, et al. Partial volume correction in quantitative amyloid imaging. NeuroImage. 2015;107:55–64.
11. Baker SL, Maass A, Jagust WJ. Considerations and code for partial volume correcting [18F]-AV-1451 tau PET data. Data Brief. 2017;15:648–57. 12. Buckley RF, Hanseeuw B, Schultz AP, et al. Region-Specific Association of
Subjective Cognitive Decline With Tauopathy Independent of Global beta-Amyloid Burden. JAMA Neurol. 2017;74(12):1455–63.
13. Maass A, Landau S, Baker SL, et al. Comparison of multiple tau-PET measures as biomarkers in aging and Alzheimer’s disease. NeuroImage. 2017;157:448–63.
14. Hanseeuw BJ, Betensky RA, Schultz AP, et al. Fluorodeoxyglucose metabolism associated with tau-amyloid interaction predicts memory decline. Ann Neurol. 2017;81:583–96.
15. Gordon BA, Friedrichsen K, Brier M, et al. The relationship between cerebrospinal fluid markers of Alzheimer pathology and positron emission tomography tau imaging. Brain. 2016;139:2249–60.
16. Wang L, Benzinger TL, Su Y, et al. Evaluation of tau imaging in staging Alzheimer disease and revealing interactions between beta-amyloid and tauopathy. JAMA Neurol. 2016;73:1070–7.
17. Ossenkoppele R, Schonhaut DR, Scholl M, et al. Tau PET patterns mirror clinical and neuroanatomical variability in Alzheimer’s disease. Brain. 2016; 139:1551–67.
18. Golla SSV, Lubberink M, van Berckel BNM, Lammertsma AA, Boellaard R. Partial volume correction of brain PET studies using iterative deconvolution in combination with HYPR denoising. EJNMMI Res. 2017;7:36.
19. McKhann GM, Knopman DS, Chertkow H, et al. The diagnosis of dementia due to Alzheimer’s disease: recommendations from the National Institute on Aging-Alzheimer’s Association workgroups on diagnostic guidelines for Alzheimer's disease. Alzheimers Dement. 2011;7:263–9.
20. Seibyl J, Catafau AM, Barthel H, et al. Impact of training method on the robustness of the visual assessment of 18F-Florbetaben PET scans: results from a phase-3 study. J Nucl Med. 2016;57:900–6.
21. Zwan M, van Harten A, Ossenkoppele R, et al. Concordance between cerebrospinal fluid biomarkers and [11C] PIB PET in a memory clinic cohort. J Alzheimer's Dis: JAD. 2014;41:801–7.
22. Golla SS, Timmers T, Ossenkoppele R, et al. Quantification of tau load using [18F]AV1451 PET. Mol Imaging Biol. 2017;19(6):963–71.
23. Vollmar S, Michel C, Treffert JT, et al. HeinzelCluster: accelerated reconstruction for FORE and OSEM3D. Phys Med Biol. 2002;47:2651–8. 24. Hammers A, Allom R, Koepp MJ, et al. Three-dimensional maximum
probability atlas of the human brain, with particular reference to the temporal lobe. Hum Brain Mapp. 2003;19:224–47.
25. Svarer C, Madsen K, Hasselbalch SG, et al. MR-based automatic delineation of volumes of interest in human brain PET images using probability maps. NeuroImage. 2005;24:969–79.
26. Barret O, Alagille D, Sanabria S, et al. Kinetic modeling of the tau PET tracer 18F-AV-1451 in human healthy volunteers and Alzheimer’s disease subjects. J Nucl Med. 2016;58(7):1124–31.
![Fig. 1 Coronal [18F] flortaucipir VT images before (a) and after (b)HDH PVC and coronal MR flair (c) in a healthy control (left) and probableAD patient (right)](https://thumb-us.123doks.com/thumbv2/123dok_us/9622647.1944448/3.595.58.292.84.326/coronal-flortaucipir-images-coronal-healthy-control-probablead-patient.webp)