Henryk Kordecki
1, Mikołaj Karmowski
2, Maria Knapik-Kordecka
3,
Andrzej Karmowski
4, Bohdan Gworys
5Method of Component Importance Evaluation
in Complex Data Structure Analysis
Metoda określenia ważności parametrów w analizie danych
o złożonej strukturze
1 Institute of Computer Technology, Automatics and Robotics, Wroclaw University of Technology, Poland 2 Department of Gynaecology and Obstetrics, Wroclaw Medical University, Wrocław, Poland
3 Department of Angiology, Hypertension and Diabetology, Wroclaw Medical University, Wrocław, Poland 4 1st Department and Clinic of Gynaecology and Obstetrics, Wroclaw Medical University, Wrocław, Poland 5 Department of Normal Anatomy, Wroclaw Medical University, Wrocław, Poland
Abstract
Background. In medical practice very often it is necessary to determine which parameter (feature, cure, environ-ment eleenviron-ment) is most important for diagnosis or decision making. This is the problem of complex, multi-compo-nent data analysis. The paper introduces the method that can be helpful to solve that kind of problems.
Objectives. The aim of the paper was to present the method of data components ordering according to their impor-tance, in the process of complex medical problem analysis.
Material and Methods. The idea implemented in this paper is based on the entropy conception, known in the area of information theory. As the example Eurofit motor test results of 637 males and 425 females were analyzed. Test results contain 9 parameters for each individual, and the proposed method was used for ordering them to simplify the individual efficiency evaluation.
Results. The applied method of test components ordering gave good results. The quality of results was evaluated by comparison the ordering for males and females using correlation analysis.
Conclusions. Results obtained using the proposed method allows to state that the method can be used in cases of the multi-parameter medical data analysis when the parameter ranking is necessary (Adv Clin Exp Med 2011, 20, 2, 205–209).
Key words: entropy, data component ordering, motor tests.
Streszczenie
Wprowadzenie. W praktyce medycznej często zachodzi konieczność określenia, który parametr (cecha, lekarstwo, element środowiska) jest najważniejszy do określenia diagnozy lub w procesie podejmowania decyzji. Jest to pro-blem złożonej, wieloparametrycznej analizy danych. W pracy opisano metodę, która może być zastosowana do rozwiązywania takich problemów.
Cel pracy. Prezentacja metody uporządkowania komponentów danych w zależności od ich ważności w procesie analizy złożonego problemu medycznego.
Materiał i metody. Metoda opisana w pracy opiera się na pojęciu entropii znanym teorii informacji. Jako przy-kład jej zastosowania wybrano wyniki testu sprawnościowego Eurofit wykonanego u 637 mężczyzn i 425 kobiet. Zawierają one 9 parametrów dla każdej osoby, a opisana metoda była wykorzystana do ich uporządkowania w celu ułatwienia oceny sprawności poszczególnych osób.
Wyniki. Przedstawiona metoda uporządkowania parametrów dała dobre wyniki. Jakość rezultatów oceniono przez porównanie uporządkowania dla kobiet i mężczyzn, wykorzystując analizę korelacji.
Wnioski. Rezultaty otrzymane z wykorzystaniem opisanej metody pozwalają sądzić, że może być wykorzystana do analizy wieloparametrycznych danych medycznych, w przypadku gdy uporządkowanie parametrów jest konieczne (Adv Clin Exp Med 2011, 20, 2, 205–209).
Słowa kluczowe: entropia, porządkowanie komponentów danych, testy motoryczne. Adv Clin Exp Med 2011, 20, 2, 205–209
ISSN 1230-025X
ORIGINAl PAPERS
The aim of the paper is to present the method of components ordering according to their im-portance and level of influence on the process of complex medical problem analysis. In medical practice very often it is necessary to determine which parameter (feature, cure, environment el-ement) is most important for decision making. The method proposed, named “empirical entropy method” should be helpful to make a right deci-sion during the parameter importance evaluation in complex data structures. The idea implemented in this paper is based on the entropy conception, presented by Shannon [1] in the area of the infor-mation theory. The entropy conception was used untypical way in the process of company flexibility evaluation. In this paper besides the entropy con-ception the correlation analysis was applied [2]. The usefulness of the proposed method was test-ed in the process of the motor abilities analysis by EUROFIT test application [3] in the group of university students. The EUROFIT test consists of nine efficiency trials. The question is which one of them is the most important for the individual mo-tor ability evaluation and which one is unessential. Similar approach was presented in the area of mul-tiple attribute decision making (MADM) [4]. This process refers to making decisions (evaluation, selection) over available alternatives described by multiple attributes. In this paper the usefulness of the proposed method was evaluated by using the assumption that ordering of the test components (parameters) should be similar for males and fe-males. So, it was assumed that the more similar the importance ordering of test components for males and females the more useful the proposed method.
Material and Methods
Test results of 637 males and 425 females were analyzed. Basic statistical parameters of EUROFIT test for both groups after modification are given in Tables 1 and 2.
Modifications of the test parameters were made according to the rule “the more the bet-ter”. For the parameters 2, 7, 8, and 9 the inverses were taken into account. It is obvious that the lower time of running (in seconds) the better re-sult. After modifications all the parameters were standardized. The importance ordering of the test parameters was made according to the principle that the more global information contains the pa-rameter the more its importance in the process of the individual motor ability evaluation. As the measure of the amount of information included in the particular test parameter the empirical entropy was used [1, 2].
Results
The values of test parameters were treated as samples of continue random variables. For females and males, the frequency histograms (empirical probability density distributions) were built. For the use of these investigations the number of his-togram classes, in each case, was established to 10. Then empirical probabilities of given parameter achieving value in particular class of the corre-sponding histogram were calculated according to the formula:
m
l
p
ikik
=
(1)Table 1. Basic statistical parameters of the male group
Tabela 1. Podstawowe parametry statystyczne w grupie męskiej
Parameter Sample size Average Minimum Maximum Standard deviation 1. Flamingo balance 637 7.52 1.00 26.00 4.54
where:
m – number at individuals (m = 637 for males, m = 425 for females),
i – test parameter (component) index (i = 1…9),
k – histogram class index (k = 1…10),
lik – number of samples of ith test component
ob-served in kth class of histogram,
pik – empirical probability of ith test component
achieving value in kth histogram class. Thus the ith parameter value will occur in the kth class pik
× m times.
It is also obvious that:
∑
==
10 11
k ikp
, i = 1…9 (2)To present the idea, which is the basis of the proposed method implementation, it is necessary to explain more precisely the concept of the test component importance. According to the author opinions, the most important test component is that one for which achieving the good result is ei-ther very easy or very difficult. If someone achieved a good result in a very difficult test component it means that, he or she, is more efficient (trained) than others. The achievement of the bad result in easy test component means that given individual is less efficient than others.
For some test components, probabilities of achieving result in each histogram class are equal, for some not. If they are equal or near equal means that the empirical probability distribution of the corresponding parameter is nearly uniform and this particular parameter cannot be used for dif-ferentiation of the motor ability. The more, the empirical probability distribution of the
particu-lar parameter is different from uniform the more important is that parameter in the process of the individual motor ability comparisons. This fact is used in proposed method for the importance eval-uation of test components.
Separately for males and females, the amount of the information contained in ith data sample re-lated to ith test parameter was calculated accord-ing to the formula below [5]:
∑
=×
×
=
kj ij ij
i
m
p
p
I
1 2)
1
(
log
(3)Value Hi:
log
(
1
)
1 2
∑
=×
=
=
kj ij ij
i
i
m
I
p
p
H
(4)is the average amount of information per one element of the ith test parameter and can be called the empirical entropy of that parameter (compo-nent) [5]. The entropy Hi (Hi ≥ 0), achieves
maxi-mum when probabilities pij are equal for each “j”,
what means that the probability distribution of the ith component is uniform [6]. It denotes that the test component with the maximal entropy cor-responds to that kind of situation in which prob-abilities of achieving god and bad results are the same for efficient and inefficient individuals. Ac-cording to author opinions, that kind of compo-nent is less important for the efficiency evaluation then that one with smaller entropy. Thus, the less entropy has the test parameter the more its impor-tance in the motor abilities evaluation process. All test components were ordered according to the increasing entropy Hi, separately for males and
fe-males. Results are shown in Table 3.
Table 2. Basic statistical parameters of the female group
Tabela 2. Podstawowe parametry statystyczne w grupie żeńskiej
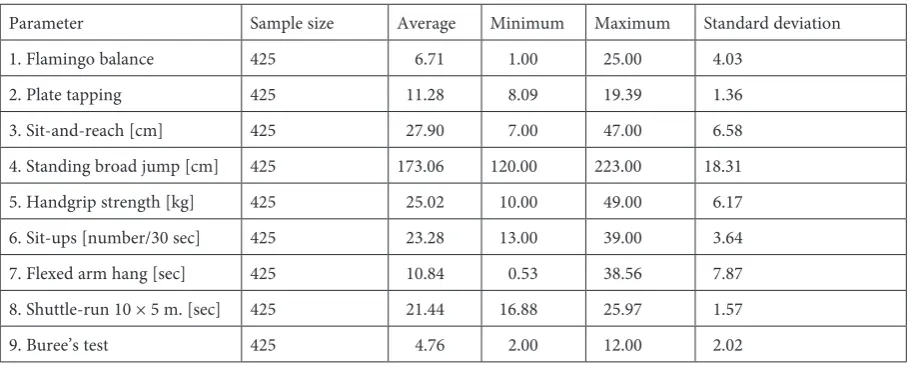
Parameter Sample size Average Minimum Maximum Standard deviation 1. Flamingo balance 425 6.71 1.00 25.00 4.03
Discussion
In Table 3 results of the test components im-portance evaluation are displayed. Columns EN-TRM and ENTRF contain entropy values and columns RANKM and RANKF contain ranks obtained according to the increasing entropy for males and females respectively.
The small entropy value is characteristic for difficult as well as for easy test parameters. In or-der to verify the difficulty level, skew coefficients “A” were calculated for each parameter accord-ing to the formula 5 [7]. The results are shown in the columns ASYMM and ASYMF of Table 3 for males and females respectively.
3 3
σ
X
A
=
(5)where:
X3 – third range moment calculated for data
sam-ple of the each test component, σ – standard deviation of each sample.
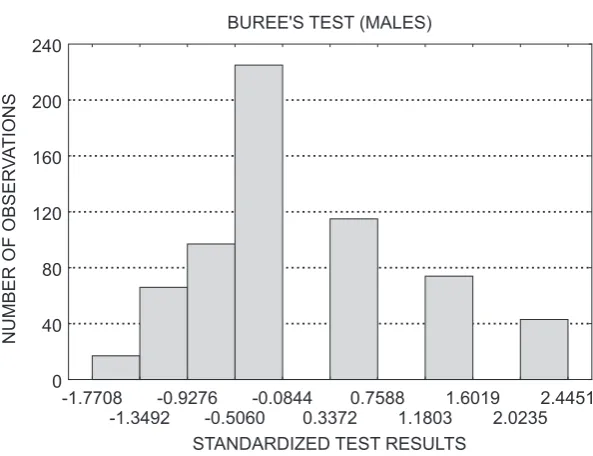
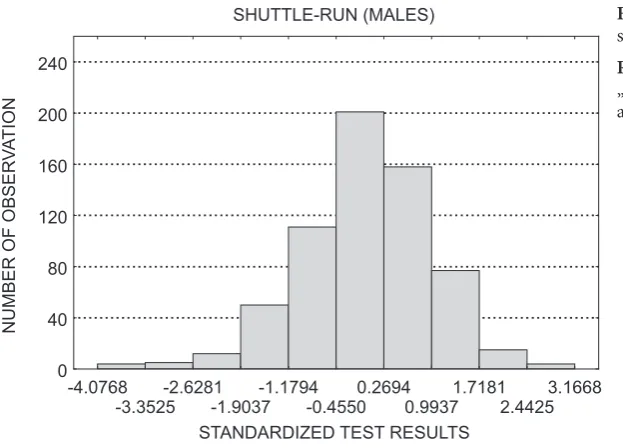
Bigger absolute value of the skewness coef-ficient denotes bigger distribution asymmetry. If A > 0 the distribution is said to be positively skewed ore skewed to the right. In this case the probabil-ity of achievement the good result is small and the trial of the test can be considered to be difficult. The good result shows good motor efficiency of the individual. If the value of A is negative the dis-tribution is called to be negatively skewed and the trial of the test is considered to be easy. Examples of histograms for A > 0 and for A < 0 are shown in Fig. 1 and Fig. 2 respectively.
Following the idea that the more similar the im-portance ranking of the test components for males
Table 3. Eurofit test components importance evaluation for males and females
Tabela 3. Ocena ważności składników testu Eurofit dla mężczyzn i dla kobiet
ENTRM RANKM ASYMM ENTRF RANKF ASYMF
1. Flamingo balance 3.858 2 0.843 3.825 3 1.174
2. Plate tapping 4.289 8 –0.387 4.258 8 0.087
3. Sit-and-reach [cm] 4.197 4 –0.005 4.216 7 –0.203
4. Standing broad jump [cm] 4.237 5 –0.576 4.199 6 –0.053 5. Handgrip strength [kg] 4.241 6 0.131 4.161 5 0.404 6. Sit-ups [number/30 sec] 4.145 3 0.272 2.976 2 0.297 7. Flexed arm hang [sec] 4.328 7 0.407 4.054 4 1.156 8. Shuttle-run 10 × 5 m. [sec] 4.269 9 –0.462 4.267 9 0.173
9. Buree’s test 2.973 1 0.848 2.822 1 1.006
BUREE'S TEST (MALES)
-1.7708
-1.3492-0.9276-0.5060-0.08440.33720.75881.18031.60192.02352.4451 STANDARDIZED TEST RESULTS
0 40 80 120 160 200 240
NUMBER OF OBSER
VA
TION
S
Fig. 1. Histogram for Buree’s test skewed to the right (A > 0)
and females the more useful the proposed method, Spearman’s correlation coefficient “R” between ranks, shown in Table 3 (RANKM and RANKF columns), was calculated. The value of R obtained, was very high, R = 0.817. This result confirmed the usefulness of the presented method.
The authors concluded that the original meth-od of test components ordering, according to their importance for motor efficiency evaluation, called “empirical entropy” method gave good results. The ranking of test components obtained, using
the presented method, was very similar for males and females. This result confirmed the method usefulness, if the assumption, that the good meth-od should give the same results independently on the sex, will be accepted.
Results obtained using the “empirical entropy” method allows to say that the method can be used in all cases of the multi-component medical data analysis, when the criterion of component order-ing, will be the amount of information contained in the each component.
SHUTTLE-RUN (MALES)
-4.0768
-3.3525-2.6281-1.9037-1.1794-0.45500.26940.99371.71812.44253.1668 STANDARDIZED TEST RESULTS
0 40 80 120 160 200 240
NUMBER OF OBSER
VA
TION
Fig. 2. Histogram for shuttle-run skewed to the left (A < 0)
Ryc. 2. Histogram dla składnika testu „bieg wahadłowy” z lewostronną asymetrią
References
Shannon CE:
[1] A mathematical theory of communication. Bell System Tech J 1948, 27, 379–423, 623–656.
Harnet DL:
[2] Statistical methods. Addison-Wesley Publishing Company, Inc. Philippines 1982, 718–728. Council of Europe. Committee for the development of sport. Eurofit, European Test of Physical Fitness 1988.
[3]
Hosseinzadeh L, Fallahnejad R:
[4] Imprecise Shannon’s entropy and multi attribute decision. Entropy – Open Access J 2010, 12, 53–62.
Shanmugam K Sam:
[5] Digital and analog communication systems, Jon Wiley & Sons Inc. 1979, 138–156.
Harremoes P:
[6] Maximum entropy on compact groups. Entropy – Open Access J 2009, II, 222–237.
Azzalini A, Capitanio A:
[7] A statistical applications of the multivariate skew normal distribution. J R Stat Soc 1999, 81 (3), 579–602.
Address for correspondence:
Henryk Kordecki
Institute of Computer Technology, Automatics and Robotics Wroclaw University of Technology
27 Wybrzeże Wyspiańskiego St. 50-370 Wrocław
Poland
Tel.: +48 71 320 29 61, +48 665 224 555 E-mail: [email protected]
Conflict of interest: None declared