© 2017 Vyara Borisova Lincheva et al. This is an open access article distributed under the terms of the Creative Commons Attribution License -NonCommercial-ShareAlikeUnported License (http://creativecommons.org/licenses/by-nc-sa/3.0/).
Journal of Applied Pharmaceutical Science Vol. 7 (02), pp. 174-179, February, 2017 Available online at http://www.japsonline.com
DOI: 10.7324/JAPS.2017.70224 ISSN 2231-3354
Optimization of biologically active substances extraction process
from
Potentilla reptans
L. aerial parts
Vyara Borisova Lincheva, Nadezhda Traicheva Petkova, Ivan Georgiev Ivanov
*University of Food Technologies, Department of Organic chemistry, 26 Maritza Blvd., Plovdiv, 4002, Bulgaria.
ARTICLE INFO ABSTRACT
Article history:
Received on: 24/01/2017 Accepted on: 20/02/2017 Available online: 27/02/2017
European cinquefoil (Potentilla reptans L.) (Rosaceae) is very common in the Central Europe and
Balkan Peninsula. Since ancient times the European cinquefoil have been traditionally used in herbal medicine for treatment of tooth ache, ulcers and inflammation of the throat, as well as certain forms of cancer, infections due to bacteria, fungi and viruses, diarrhea, diabetes mellitus and other
ailments. Most species of genus Potentilla contain hydrolysable tannins, proanthocyanidins,
flavonoids and triterpenes as bioactive substances. The aim of this study was to establish the most
suitable condition for extraction of biologically active substances from Potentilla reptans aerial
parts. The influence of the time of the ultrasonic extraction and solvent concentration (ethanol-water) in different ratio over the extraction process was studied. The optimal conditions for the extraction of biologically active substances from European cinquefoil were as follow: 40% ethanol-water as solvent system and extraction time 45 min in ultrasonic bath with frequency 35 kHz. Under these conditions the maximum values of total polyphenols content, total proanthocyanidins and total hydrolysable tannins (60.2 mg GAE/ g dw, 93.1 mg LE/100g dw, 101.3 mg TAE /g dw) were obtained.
Key words:
Potentilla reptans L., ultrasonic-assisted extraction, hydrolysable tannins,
proanthocyanidins.
INTRODUCTION
The Potentilla reptans L. is a member of the family Rosaceae, distributed in the Northern hemisphere. The aerial parts of this plant have been applied in traditional medicine for the treatment of uterine fibroids, tumors, hemorrhoids, inflammation of the stomach and intestines, diarrhea, liver disease, inflammation of the eyes (Tomczyka and Lattéb, 2009).
* Corresponding Author
E-mail:[email protected]
The water and 70% ethanol extracts from Potentilla species aerial part and roots possessed antidiarrhoic, anti-ulcerogenic, anti-neoplastic, antiviral, antimicrobial, antihyperglycemic,
anti- inflammatory, spasmolytic, hepatoprotective and
antioxidative activities (Tomovic et al., 2015, Tomczyk et al.,
2010, Watkins et al., 2012). However, the medicinal plants are the important source of natural antioxidants (Irulandi et al.,
2016). The high content of tannins, phenolic acids, flavonoids and triterpenes, presenting in the different parts of the plant could explain most of the observed biological effects (Tomovic
et al., 2015 Tomczyk et al., 2010, Mari et al., 2013 Hoffmann
The aim of current study was to establish the best condition for extraction of biologically active substances from
Potentilla reptans aerial parts. The influence of the duration of the ultrasound-assisted extraction and solvent system (ethanol-water) in different concentration ratio over the extraction process has been studied.
MATERIALS AND METHODS
Plant material
Aerial parts (leaves) Potentilla reptans (ALIN, Bach number L56. 02.2015) was purchased from a local herbal pharmacy in May 2016, Plovdiv. The samples were finely ground by laboratory homogenizer. The powder was used for extraction of biologically active compounds.
Extraction procedure
Half gram of dry ground leaves were placed in a plastic tube and 50 mL solvent in different ratio mixture ethanol (from 20% to 60%) and water was added. Ultrasound-assisted extraction was performed in ultrasonic bath SIEL UST 5.7-150 (Gabrovo, Bulgaria) with frequency 35 kHz and power 240 W at temperature 30 °C for different time (from 15 to 45 min.). The ratio between ethanol-water and extraction time were varied in order to obtain the highest yield of biologically active substances.
Total proanthocyanidins assay
Acid butanol assay for proanthocyanidins, described by Porter et al., (1986) was used. Briefly, six milliliter of the acid butanol reagent (950 mL of n-butanol with 50 mL concentrated HCl), 0.5 mL aliquot of the sample, and 0.1 mL of the iron reagent (2 % ferric ammonium sulfate in 2 mol/L HCl) were mixed to 10 mL screw cap tube and then vortexed. The tube was capped loosely and put in a boiling water bath for 50 min. The absorbance of formed colored complex was read at 550 nm. Condensed tannins were expressed as leucosyanidin equivalent (LE) per 100 grams herb (Hagerman, 2011).
Total phenolics
The total phenolic contents were measured using a Folin-Ciocalteu assay. Folin- Ciocalteu reagent (1 mL) (Sigma) diluted five times was mixed with 0.2 mL of sample and 0.8 mL 7.5% Na2CO3. The reaction was 20 min at room
temperature in darkness. After reaction time, the absorption of sample was recorded at 765 nm against blank sample, developed the same way but without extract. The results were expressed as mg equivalent of gallic acid (GAE) per g dry weight (DW), according to calibration curve, built in range of 0.02 - 0.10 mg gallic acid (Sigma) used as a standard.
Total tannins assay
Phenolic Browning Assay
A spectrophotometric assay of the rate of browning of low-molecular-weight phenolic compounds was adapted to measure the browning of tannins. The samples 0.3 mL (diluted 1:2 with 70% ethanol) was dissolved in 7.7 mL pH 10 buffer (5 mM Na2CO3: 5 mM NaHCO3 in ratio 6:4). Absorbance was
measured at 415 nm, beginning at 15 sec after the addition of the sample. Subsequent measurements were made with a kinetic protocol every 60 sec over a period of 8 min. The initial, linear rate of browning (Abs/min) was measured within the first 6 min of the reaction. A pentagalloyl glucose standard was run on each day to confirm that measurements were consistent through time. Plots of browning rate vs. sample concentration (mg) were made for each sample to confirm that rate was a linear function of concentration for each compound. The slopes of these plots were used as the browning rates (normalized for sample concentration as Abs/min/mg phenolics) (Moilanen, 2015).
Antioxidant activities
DPPH assay
Each analyzed extract (0.15 mL) was mixed with 2.85 mL freshly prepared 0.1 mM solution of 1,1-diphenyl-2-picrylhydrazyl radical (DPPH, Sigma) in methanol (Merck). The reaction was performed at 37 °C at darkness and the absorptions at 517 nm were recorded after 15 min against methanol. The antioxidant activity was expressed as mM Trolox equivalents (TE) per g dry weight (DW) by using calibration curve, built by 0.05, 0.1, 0.2, 0.3, 0.4 and 0.5 mM
6-hydroxy-2,5,7,8-tetramethylchroman-2-carboxylic acid
(Trolox, Fluka) dissolved in methanol (Sigma).
Ferric reducing antioxidant power (FRAP) assay
The assay was performed according to method, as follows: the FRAP reagent was freshly prepared before analyzes by mixing 10 parts 0.3 M acetate buffer (pH 3.6), 1 part 10 mM 2,4,6-tripyridyl-s-triazine (TPTZ, Fluka) in 40 mM HCl (Merck) and 1 part 20 mM FeCl3.6H2O (Merck) in d. H2O.
Response surface optimization method
In order to evaluate the effects of extraction parameters and optimize conditions for various responses response surface methodology (RSM) optimization method was applied. Independent variables used in experimental design were solvent concentration (20, 40, 60 %) and extraction time (15, 30, 45 min). The coded and uncoded independent variables used in the RSM design are listed in Table 1. Ranges of ethanol (X1) and time (X2) and the central points were selected based
on literature data. Statistical analysis of experiment was performed using Statistical Software MINITAB 16.
Table 1: Coded and uncoded levels of independent variables used in
the response surface methodology.
Independent variable Symbol
Level Low (-1) Middle (0) High (+1)
Solvent concentration, % X1 20 40 60
Time, min X2 15 30 45
The response variables were fitted to the following second-order polynomial model (Eq. 1), which was able to describe the relationship between the dependent output variable and the independent variables:
(1)
where Y represents response variable (total phenolic, total tanins, total proanthocyanidines and antioxidant activity – DPPH and FRAP methods); Xi and Xj are the independent variables (Table 1); β0, βi, βii and βij are the regression coefficients for the intercept, linear, quadratic and interaction coefficient, respectively.
RESULTS AND DISCUSSION
There is an increasing interest for using of phytochemicals from natural plants. The extracts obtained from different plant origin had different effects for human health. Extraction efficiency depends on large number of parameters - extraction method, solvents, temperature, extraction time. In this reason it is very important to find optimal extraction parameters for obtaining extracts with the highest content of biologically active compounds (Cvetanovic et al., 2015, Mašković et al., 2016). Response surface methodology is an effective technique for optimization of complex process, because it allows efficient and easier interpretation of experiments (Bezerra et al., 2008, Zekovic et al., 2014). Several researchers already employed RSM for the optimization of extraction process in order to maximize yield
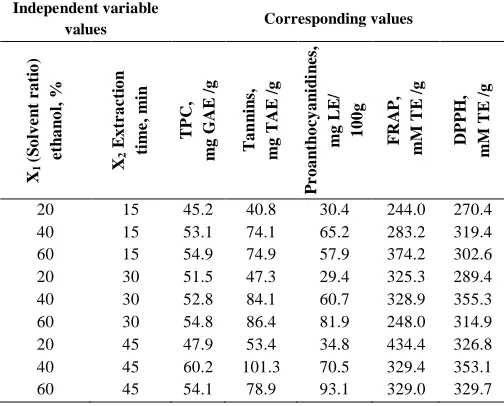
of various polyphenolic compounds from various sources (Radojković et al., 2012, Kim et al., 2014, Claus et al., 2015, Mašković et al., 2016). In the presented research, RSM was used to optimize the solid–liquid extraction of compounds with improved antioxidant ability from Potentilla reptans L. The influence of solvent composition and time on the extraction yield of total polyphenols, total hydrolyzed tannins, total proanthocyanidines and antioxidant activity was investigated. The experiments were designed according to RSM design, and results are presented in Table 2. The effect of linear, quadratic or interaction coefficients on the response was tested for significance by analysis of variance. Experimental results from Table 3 were processed with multiple linear regressions using the second-order polynomial model – Eq. (1). The regression coefficients of the intercept, linear, cross product and quadratic terms are presented in the Table 3.
Suitability of the model was also analysed by the MINITAB 16. Calculated statistical parameters are presented in Table 3. According to the p-values of the F-value for suggested model was suitable for the investigated extraction system. Model equations for relationship between total phenol content, total hydrolyzed tannins, total proanthocyanidines content and antioxidant activity and independent variables were obtained by applying multiple regression analysis (Table 3). By applying these equations, it is possible to predict the values of each response. The values of R2 for total polyphenol content, total hydrolyzed tannins content, total proanthocyanidines and antioxidant activity were 0.74, 0.94, 0.79 and 0.96 (FRAP method) and 0.95 (DPPH method), respectively (Table 3). Therefore, it was suggested that quadratic model fitted well with the experimental data.
Table 2: Experimental matrix and values of the observed responses of
total polyphenolics, total tannins, total proanthocyanidines, and antioxidant activities (FRAP and DPPH methods).
Independent variable
values Corresponding values
X1 (S o lv e n t r a ti o ) e th a n o l, % X2 E x tr a c ti o n ti m e , m in T P C , m g G A E / g T a n n in s, m g T A E / g P r o a n th o c y a n id in e s, m g L E /
100g FRA
P , m M T E / g D P P H , m M T E / g
20 15 45.2 40.8 30.4 244.0 270.4
40 15 53.1 74.1 65.2 283.2 319.4
60 15 54.9 74.9 57.9 374.2 302.6
20 30 51.5 47.3 29.4 325.3 289.4
40 30 52.8 84.1 60.7 328.9 355.3
60 30 54.8 86.4 81.9 248.0 314.9
20 45 47.9 53.4 34.8 434.4 326.8
40 45 60.2 101.3 70.5 329.4 353.1
Table 3: Regression equation coefficients for the selected responses.
Variable Regression coefficient F-value p-value
Total polyphenols concentration Intercept b0 25.10
Linear 2.91 0.198
bi 1.04 4.78 0.117
bj 0.33 1.04 0.383
Square (quadratic) 1.24 0.405
bii -9.93 x10⁻³ 2.45 0.216
bjj -1.92 x10⁻³ 0.03 0.876
Interaction 0.24 0.658
bij -2.92 x10⁻³ 0.24 0.658
R2a 0.740
Total hydrolyzed tannins Intercept b0 -67.76
Linear 16.28 0.025
bi 5.61 27.20 0.014
bj 1.31 5.35 0.104
Square (quadratic) 8.84 0.055
bii -57.17 x10⁻³ 17.54 0.025
bjj -9.00 x10⁻³ 0.14 0.736
Interaction 0.31 0.619
bij -7.12 x10⁻³ 0.31 0.619
R2a 0.944
Total proanthocyanidines Intercept b0 -3.93
Linear 1.68 0.323
bi 2.56 0.24 0.660
bj -0.88 3.13 0.175
Square (quadratic) 0.59 0.610
bii -0.03 0.15 0.728
bjj -5.96x10⁻³ 1.03 0.386
Interaction 7.11 0.076
bij 0.03 7.11 0.076
R2a 0.795
Antioxidant activity FRAP method
Intercept b0 185.10
Linear 39.51 0.007
bi 3.06 71.46 0.003
bj 1.55 7.56 0.071
Square (quadratic) 2.70 0.213
bii 0.03 5.32 0.104
bjj 0.14 0.08 0.795
Interaction 5.30 0.105
bij -0.19 5.30 0.105
R2a 0.967
DPPH method
Intercept b0 96.72
Linear 14.32 0.029
bi 8.62 6.03 0.091
bj 3.05 22.61 0.018
Square (quadratic) 13.53 0.032
bii -0.10 26.90 0.014
bjj -0.01 0.16 0.713
Interaction 2.11 0.242
bij -0.02 2.11 0.242
R2a 0.950
a
- Coefficient of multiple determinations.
Table 4: Comparison between theoretically calculated and
experimentally obtained yields of total polyphenolics, total tannins, total proanthocyanidines, and antioxidant activities (FRAP and DPPH methods).
Theoretically calculated
Experimentally
obtained Deviation
between Ῡ
and Y
X11 X21 Ῡ X1 X2 Y
TPC 45.8 45.0 57.0 40 45 60.2 -5.6 % Tannins 46.3 45.0 95.4 40 45 101.3 -6.2 %
Proanthocyanidines 60.0 40.0 93.3 60 45 93.1 0.2 % FRAP 20.0 45.0 435.9 20 45 434.4 0.3 % DPPH 40.8 45.0 361.2 40 45 353.1 2.2 %
Correlation between antioxidant assays, total phenolic, total proanthocyanidines and total taninns contents.
Table 5: Correlation between antioxidant assays, total phenolic, total
proanthocyanidines and total tannins contents
TPC PRO Tannins FRAP DPPH
TPC -
PRO 0.7003 -
Taninns 0.9006 0.8256 -
FRAP 0.0256 -0.2056 -0.0405 -
DPPH 0.6179 0.5579 0.7884 0.34578 -
The optimization procedures carried out using “Response optimizer” of MINITAB 16 software gave the following values of variable X1 and X2 for maximum yield of
total polyphenolics, total tannins, total proanthocyanidines, and antioxidant activities (FRAP and DPPH methods) (Y) by
Antioxidant activities measured by DPPH and FRAP assays on the one hand and content of total phenolic (TPC), total proanthocyanidines, total tannins on the other hand, were correlated in the different ways (Table 5). Antioxidant assays were moderate to strongly correlate between each other. Antioxidant assays were more strongly correlated to total phenolic and total tannins than to total proanthocyanidines.
CONCLUSION
The optimal conditions for the extraction of biologically active substances from European cinquefoil were as follow 40% ethanol-water as solvent system and time of
ultrasonic-assisted extraction 45 min in ultrasound bath with frequency 35 kHz. Under these condition the
maximum amount of total polyphenols content, total proanthocyanidins and total hydrolysable tannins (60.2 mg GAE/ g dw, 93.1 mg LE/100g dw, 101.3 mg TAE /g dw) were obtained.
Financial support and sponsorship: Nil.
Conflict of Interests: There are no conflicts of interest.
REFERENCES
Bezerra MA, Santelli RE, Oliveira EP, Villar LS, Escaleira LA. Response surface methodology (RSM) as a tool for optimization in analytical chemistry. Talanta, 2008; 76:965–977.
Claus T, Palombini SV, Carbonera F, Figueiredo IL, Matsushita M, Visentainer JV. Response Surface Methodology Applied in the Study of Emulsion Formulations in the Presence of Leaves of Rosemary (Rosmarinus officinalis L.) as a Source of Natural Antioxidants. J. Braz. Chem. Soc., 2015; 26(10):2097-2104.
Cvetanović A, Švarc-Gajić J, Mašković P, Savić S, Nikolić LJ. Antioxidant and biological activity of chamomile extracts obtained by different techniques: perspective of using superheated water for isolation of biologically active compounds. Ind Crops Prod, 2015; 65:582-591.
Hagerman, A., 2011. The Tannin Handbook Available
at: http://www.users.muohio.edu/hagermae/tannin.pdf.
[Accessed 27 July 2016]
Hoffmann J, Casetti F, Bullerkotte U, Haarhaus B, Vagedes J, Schempp C, Wölfle U. Anti-inflammatory effects of agrimoniin-enriched fractions of Potentilla erecta. Molecules, 2016; 21:792, doi:10.3390/molecules21060792.
Irulandi K, Geetha S, Mehalingam P. Antioxidant, antimicrobial activities and phytochemical analysis of leaves
extracts of Dioscorea wallichii Hook. f. Journal of Applied Pharmaceutical Science, 2016; 6(11):70-74.
Kim S, Asnin L, Assefa AD, Ko EY, Sharma K, Park SW. Extraction of Antioxidants from Aloe vera Leaf Gel: a Response Surface Methodology Study. Food. Anal. Methods, 2014; 7:1804–1815.
Mari A, Lyon D, Fragner L, Montoro P, Piacente S, Wienkoop S, Egelhofer V, Weckwerth W. Phytochemical composition of Potentilla anserina L. analyzed by an integrative GC-MS and LC-MS metabolomics platform. Metabolomics, 2013; 9:599–607.
Mašković P.Z, Diamanto LD, Cvetanović A, Radojković M, Spasojević MB, Zengin G. Optimization of the Extraction Process of Antioxidants from Orange Using Response Surface Methodology. Food Anal. Methods, 2016; 9:1436–1443.
Moilanen J. 2015 Ellagitannins in finnish plant species - characterization, distribution and oxidative activity. Painosalama Oy - Turku, Finland.
Porter LJ, Hirstich LN, Chan BG. The conversion of procyanidins and prodelphinidins to cyanidin and delphinidin. Phytochem., 1986, 25:223–230.
Radojković M, Zeković Z, Jokić S, Vidović S, Lepojević Z, Milošević S. Optimization of Solid-Liquid Extraction of Antioxidants from Black Mulberry Leaves by Response Surface Methodology. Food Technol. Biotechnol., 2012; 50(2):167–176.
Tomczyk M, Bazylko A, Staszewska A.
Determination of polyphenolics in extracts of potentilla species
by high-performance thin-layer chromatography
photodensitometry method. Phytochem. Anal., 2010; 21:174– 179.
Tomczyka M, Lattéb KP. Potentilla – A review of its phytochemical and pharmacological profile. Journal of Ethnopharmacology, 2009; 122:184–204.
Tomovic MT, Cupara SM, Popovic-Milenkovic MT, Ljujic BT, Kostic MJ, Jankovic SM Antioxidant and anti-inflammatory activity of Potentilla reptans L. Acta Poloniae Pharmaceutica – Drug Research, 2015; 72(1):137-145.
Watkins F, Pendry B, Sanchez-Medina A, Corcoran O. Antimicrobial assays of three native British plants used in Anglo-Saxon medicine form wound healing formulations in10th century England. Journal of Ethnopharmacology, 2012; 144:408–415.
How to cite this article:
Lincheva VB, Petkova NT, Ivanov IG. Optimization of biologically active substances extraction process from