DEMOGRAPHIC RESEARCH
VOLUME 34, ARTICLE 12, PAGES 359
−
372
PUBLISHED 19 FEBRUARY 2016
http://www.demographic-research.org/Volumes/Vol34/12/ DOI: 10.4054/DemRes.2016.34.12
Descriptive Finding
State-level variation in the
imprisonment-
mortality relationship, 2001−2010
Christopher Wildeman
Margaret E. Noonan
Daniela Golinelli
E. Ann Carson
Natalia Emanuel
©2016 Wildemann, Noonan, Golinelli, Carson & Emanuel.
This open-access work is published under the terms of the Creative Commons Attribution NonCommercial License 2.0 Germany, which permits use, reproduction & distribution in any medium for non-commercial purposes, provided the original author(s) and source are given credit.
2 Data and method 361
2.1 Data 361
2.2 3
Analytic strategy Results
362 362 3.1
3.2
The imprisonment-mortality relationship for males The imprisonment-mortality relationship for females
362 365
4 Discussion 367
5 Acknowledgements 369
State-level variation in the
imprisonment-mortality relationship
, 2001−2010
Christopher Wildeman1
Margaret E. Noonan2
Daniela Golinelli3
E. Ann Carson2
Natalia Emanuel4
Abstract
BACKGROUND
Most research on the imprisonment-mortality relationship has focused exclusively on non-Hispanic black males and non-Hispanic white males at the national level in the United States.
OBJECTIVE
To document variation in this relationship across states by race/ethnicity and sex. METHODS
We estimate the crude and age-specific mortality rates of state prisoners and of the general population in 7−9 states. We also present the resulting standardized mortality ratios (SMRs).
RESULTS
The results provide support for four key conclusions. First, although there is substantial cross-state variability in the mortality rates of male and female state prisoners, there is far more cross-state variability in the mortality rates of males and females in the general population. Second, the mortality advantage of male prisoners over males in the general population was larger than the mortality advantage of female prisoners over females in the general population. Third, relative to same-race and same-sex peers in the general population, black males experienced the largest mortality advantage across all of the
1 Cornell University Department of Policy Analysis and Management, Ithaca, NY. U.S.A.
E-Mail: [email protected].
2 United States Department of Justice, Office of Justice Programs, Bureau of Justice Statistics,
Washington, DC., U.S.A.
3 RAND Corporation, Washington, DC., U.S.A.
states considered, and this advantage was often quite substantial. Finally, Hispanic female state prisoners in New York were the one group at a significant mortality disadvantage relative to the general population, although because of the small number of Hispanic female state prisoners who died over this period (20), further research testing the robustness of this finding to different time periods and places is sorely needed.
CONCLUSION
Although mortality disparities among prisoners are smaller than those found in the general population, research should consider how conditions of confinement affect the mortality of prisoners.
1. Introduction
As the US imprisonment rate has increased, scholars have realized that the penal system has an impact upon the health and wellbeing of the men and women who come into contact with it (Drucker 2014; Fazel and Baillargeon 2011; Massoglia 2008; Schnittker and John 2007; Wang et al. 2014; Wildeman and Muller 2012). This insight was driven in part by how imprisonment shapes mortality. While imprisoned males, especially non-Hispanic black imprisoned males, die at significantly lower rates than males in the general population, former prisoners die at very high rates (Binswanger et al. 2007; Mumola 2007; Noonan 2013; Patterson 2010; Spaulding et al. 2011; Rosen, Schoenbach, and Wohl 2008; Rosen, Wohl, and Schoenbach 2011).
2. Data and method
2.1 Data
We used data from the Deaths in Custody Reporting Program, the National Prisoner Statistics, and the National Corrections Reporting Program(Bureau of Justice Statistics 2014a, 2014b, 2014c) to estimate the crude and age-specific mortality rates of 18−54 year old (a) male state prisoners in nine states (California, Georgia, Mississippi, Missouri, New York, North Carolina, South Carolina, Utah, and Washington) and (b) female state prisoners in seven states (excluding Utah and Washington). All analyses collapsed 10 years of data (2001−2010). We selected these states because they reported annually to the National Corrections Reporting Program, had low levels of missing data on race/ethnicity, and had at least 10 deaths among state prisoners over the period. We focus on individuals in the 18−54 age range to consider how imprisonment shapes the risk of premature mortality, but future analyses should also consider mortality at older ages.
Since 2001, the Deaths in Custody Reporting Program (hereafter “DCRP”) has collected information on the age, sex, and race/ethnicity for each individual who died in a state prison. All 50 state departments of corrections have participated since 2001, thus providing a total custodial death count of all state prisoners. The DCRP data provide a more precise count of the number of deaths than the National Prisoner Statistics data (hereafter NPS) for two reasons. First, since the DCRP data are based on individual records whereas the NPS data are limited to aggregate counts, there is no risk of double-counting in the DCRP. Second, the DCRP includes information on all inmates who die while in the custody of a prison, while the NPS data include only sentenced inmates, representing 97% of state prisoners (Carson 2015).
Data from the NPS and the National Corrections Reporting Program (hereafter NCRP) provide the denominator for our in-prison mortality estimates. By averaging year-end custody counts from the NCRP and the NPS, we can generate estimates of the total mid-year population of prisoners in each state, as well as the race/ethnicity, sex, and age distribution of the penal population. We rely on the mid-year population count of state prisoners rather than yearend counts because this provides the closest approximation of person-years lived during the year.
We use data from the Centers for Disease Control and Prevention to estimate mortality rates in the general population (Centers for Disease Control and Prevention 2014a, 2014b).
2.2 Analytic strategy
The analysis proceeds in three stages. In the first, we calculate crude mortality rates for all males and females aged 18−54 in state prisons and in the general population in each state we consider in this analysis, as well as for males and females identified as black, white, and Hispanic. In the second, we use direct standardization(Preston, Heuveline, and Guillot 2001) to estimate what the mortality rate of male and female state prisoners aged 18−54 and males and females aged 18−54 in the general population would be if we used the average age distribution of the population (including males and females) of these states as the referent. In the final stage, we estimate standardized mortality ratios (SMRs) for state prisoners relative to the general population.
Although the individual-level data on inmates used for all analyses are confidential and therefore we cannot release the individual-level data we used, all state-level data and files used to produce the results presented here are available online through
Demographic Research.
3. Results
3.1 The imprisonment-mortality relationship for males
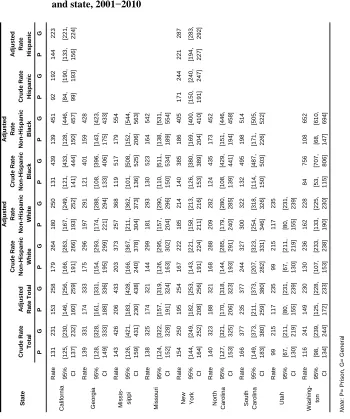
S ta te C ru d e R at e Tot a l A d ju st ed R at e T o tal C ru d e R at e No n -H isp an ic W hi te A d ju st ed R at e No n -H isp an ic W hi te C ru d e R at e No n -H isp an ic B lack A d ju st ed R at e No n -H isp an ic B lack C ru d e R at e H is p a n ic A d ju st ed R at e H is p a n ic P G P G P G P G P G P G P G P G C a lif or ni a Ra te 131 231 153 258 179 264 180 250 131 439 139 451 92 192 144 223 95% CI [125, 137] [230, 232] [146, 160] [256, 259] [166, 191] [263, 266] [167, 193] [249, 252] [121, 141] [433, 444] [128, 150] [446, 457] [8 4 , 99] [190, 193] [133, 156] [221, 224] G eor g ia Ra te 139 331 174 333 175 296 197 291 121 401 159 428 95% CI [128, 149] [328, 333] [161, 188] [331, 336] [154, 195] [293, 299] [174, 221] [288, 294] [108, 133] [396, 406] [143, 175] [423, 433] M issi s -s ip pi Ra te 143 426 206 433 203 373 257 368 119 517 179 554 95% CI [126, 159] [421, 431] [183, 230] [428, 438] [166, 240] [367, 378] [211, 304] [362, 373] [101, 136] [508, 525] [152, 206] [544, 563] Mi s s o u ri Ra te 138 325 174 321 144 299 181 293 130 523 164 542 95% CI [124, 152] [322, 328] [157, 191] [319, 324] [126, 163] [295, 302] [157, 204] [290, 296] [110, 150] [511, 534] [138, 189] [531, 554] N e w Yo rk Ra te 154 250 195 254 167 222 185 214 140 385 186 405 171 244 221 287 95% CI [144, 164] [249, 252] [182, 208] [253, 256] [143, 191] [221, 224] [158, 211] [213, 216] [126, 153] [380, 389] [169, 204] [400, 410] [150, 191] [240, 247] [194, 227] [283, 292] N or th Ca ro lin a Ra te 140 323 188 321 168 288 209 282 124 435 173 452 95% CI [127, 153] [321, 325] [170, 206] [318, 323] [144, 193] [285, 291] [179, 240] [280, 285] [108, 139] [429, 441] [151, 194] [446, 458] S out h Ca ro lin a Ra te 166 377 235 377 244 327 300 322 132 495 198 514 95% CI [149, 183] [373, 380] [211, 259] [373, 380] [207, 282] [323, 331] [254, 346] [318, 326] [114, 150] [487, 503] [171, 226] [505, 522] Ut a h Ra te 99 215 117 235 99 215 117 235 95% CI [6 7 , 130] [211, 219] [80, 155] [231, 239] [6 7 , 130] [211, 219] [80, 155] [231, 239] W as hi n g -to n Ra te 116 241 149 230 130 236 162 228 84 756 108 652 95% CI [9 8 , 134] [239, 244] [125, 172] [228, 233] [107, 153] [233, 238] [133, 190] [225, 230] [5 3 , 115] [707, 806] [68, 147] [610, 694] No te : P = P ri s o n , G= Ge n e ra l
The mortality advantage of black male prisoners over black males in the general population is larger than the mortality advantage for white and Hispanic male inmates. Black male prisoner’s adjusted mortality rates are also lower in each state, although not significantly so in all states, than are the adjusted mortality rates of white and Hispanic males in the general population.
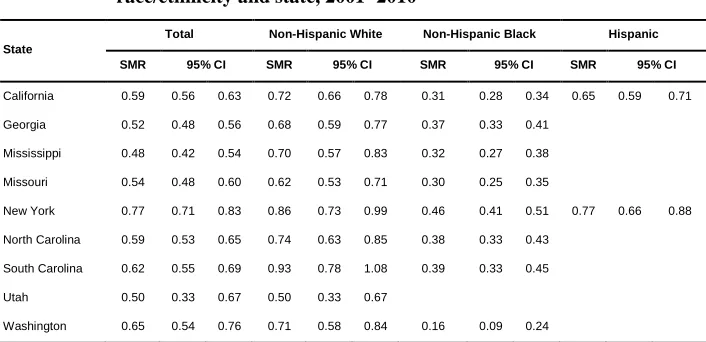
Table 2 shows SMRs for male prisoners relative to males in the population for the total population. Although there is variation in SMRs across states, the amount of variation is small, with the state with the highest SMR (New York) coming in at 0.77, and the state with the lowest SMR (Mississippi) coming in at 0.48, suggesting a mortality advantage across all states. Because cross-state differences in mortality are more substantial in the general population than in the inmate population, however, cross-state variation in the SMRs of prisoners may provide more insight regarding the mortality of the general population than that of the inmate population.
Table 2: Standardized mortality ratios (SMRSs) of male state prisoners aged 18−54 relative to males in the general population aged 18−54 by race/ethnicity and state, 2001−2010
State
Total Non-Hispanic White Non-Hispanic Black Hispanic SMR 95% CI SMR 95% CI SMR 95% CI SMR 95% CI
California 0.59 0.56 0.63 0.72 0.66 0.78 0.31 0.28 0.34 0.65 0.59 0.71 Georgia 0.52 0.48 0.56 0.68 0.59 0.77 0.37 0.33 0.41
Mississippi 0.48 0.42 0.54 0.70 0.57 0.83 0.32 0.27 0.38 Missouri 0.54 0.48 0.60 0.62 0.53 0.71 0.30 0.25 0.35
New York 0.77 0.71 0.83 0.86 0.73 0.99 0.46 0.41 0.51 0.77 0.66 0.88 North Carolina 0.59 0.53 0.65 0.74 0.63 0.85 0.38 0.33 0.43
South Carolina 0.62 0.55 0.69 0.93 0.78 1.08 0.39 0.33 0.45 Utah 0.50 0.33 0.67 0.50 0.33 0.67
Washington 0.65 0.54 0.76 0.71 0.58 0.84 0.16 0.09 0.24
0.93 [95% CI: 0.73, 1.08]. State-level variation in SMRs was greatest for white males, with a low of 0.50 in Utah and a high of 0.93 in South Carolina.
3.2 The imprisonment-mortality relationship for females
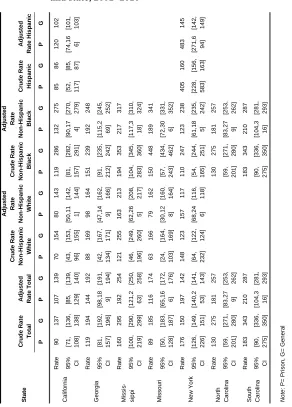
Results from Table 3 show that the crude mortality rate for female prisoners is significantly lower in six of the seven states considered, with only female prisoners in New York having higher, albeit not significantly so, crude mortality rates than females in the general population.
Adjusted mortality rates were also higher for females in the population in six states, although the difference was only significant in three states (California, Georgia, and Missouri) because age-standardizing the mortality rates reduced the mortality gap in the other three states in which female prisoners had a mortality advantage in the crude mortality rate (Mississippi, North Carolina, and South Carolina). Female prisoners in New York died at a higher rate than females in the general population, but this difference was not significant at the .05 level.
Consistent with the results from Table 1, there is more cross-state variation in the crude and adjusted mortality rates of females in the general population than females in state prisons.
S ta te C ru d e R at e Tot a l A d ju st ed R at e T o tal C ru d e R at e No n -H isp an ic W hi te A d ju st ed Ra te No n -H is p a n ic W hi te C ru d e R at e No n -H isp an ic B lack A d ju st ed R at e No n -H isp an ic B lack C ru d e R at e H is p a n ic A d ju st ed R at e H isp an ic P G P G P G P G P G P G P G P G C a lif or ni a Ra te 90 137 107 139 70 154 80 143 119 286 132 275 85 86 120 102 95% CI [7 1 , 108] [136, 138] [85, 129] [139, 140] [4 3 , 96] [153, 155] [50, 11 1] [142, 144] [8 1 , 157] [282, 291] [90, 17 4] [270, 279] [5 2 , 117] [8 5 , 87] [74, 16 6] [101, 103] G eor g ia Ra te 119 194 144 192 88 169 98 164 151 239 192 248 95% CI [8 1 , 157] [192, 196] [98, 18 9] [191, 194] [4 2 , 134] [167, 171] [47, 14 9] [162, 166] [9 1 , 212] [235, 242] [115, 2 69] [245, 252] M issi s -s ip pi Ra te 160 295 192 254 121 255 163 213 194 353 217 317 95% CI [100, 219] [290, 299] [121, 2 63] [250, 258] [4 6 , 196] [249, 260] [62, 26 5] [208, 217] [104, 283] [345, 360] [117, 3 18] [310, 324] Mi s s o u ri Ra te 89 185 116 174 63 166 79 162 150 448 189 341 95% CI [5 0 , 128] [183, 187] [65, 16 6] [172, 176] [2 4 , 103] [164, 169] [30, 12 8] [160, 164] [5 7 , 243] [434, 462] [72, 30 6] [331, 352] N ew Y or k Ra te 176 150 197 142 148 123 157 117 110 247 123 238 405 160 483 145 95% CI [126, 226] [149, 151] [140, 2 53] [141, 143] [6 4 , 232] [122, 124] [68, 24 6] [116, 118] [5 4 , 165] [244, 251] [61, 18 5] [235, 242] [228, 583] [156, 163] [271, 6 94] [142, 149] N or th Ca ro lin a Ra te 130 275 181 257 130 275 181 257 95% CI [5 9 , 201] [271, 280] [83, 27 9] [253, 262] [5 9 , 201] [271, 280] [83, 27 9] [253, 262] S out h Ca ro lin a Ra te 183 343 210 287 183 343 210 287 95% CI [9 0 , 275] [336, 350] [104, 3 16] [281, 293] [9 0 , 275] [336, 350] [104, 3 16] [281, 293] No te : P = P ri s o n , G= Ge n e ra l
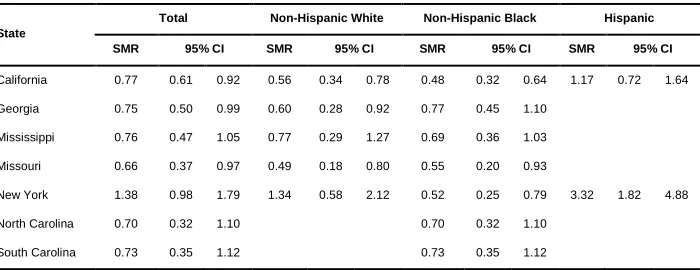
Table 4: Standardized mortality ratios (SMRs) of female state prisoners aged 18−54 relative to females in the general population aged 18−54 by race/ethnicity and state, 2001−2010
State
Total Non-Hispanic White Non-Hispanic Black Hispanic SMR 95% CI SMR 95% CI SMR 95% CI SMR 95% CI
California 0.77 0.61 0.92 0.56 0.34 0.78 0.48 0.32 0.64 1.17 0.72 1.64 Georgia 0.75 0.50 0.99 0.60 0.28 0.92 0.77 0.45 1.10
Mississippi 0.76 0.47 1.05 0.77 0.29 1.27 0.69 0.36 1.03 Missouri 0.66 0.37 0.97 0.49 0.18 0.80 0.55 0.20 0.93
New York 1.38 0.98 1.79 1.34 0.58 2.12 0.52 0.25 0.79 3.32 1.82 4.88 North Carolina 0.70 0.32 1.10 0.70 0.32 1.10
South Carolina 0.73 0.35 1.12 0.73 0.35 1.12
The mortality disadvantage of Hispanic female prisoners in New York is made more transparent in Table 4, which shows standardized mortality ratios (SMRs) for female prisoners relative to females in the general population. Hispanic female prisoners in New York were the one group at a significant mortality disadvantage relative to females in the general population in the same state [SMR = 3.32; 95% CI: 1.82 to 4.88], and this advantage was quite substantial.
4. Discussion
The results from our analysis provide support for four conclusions. First, although there is some cross-state variation in the crude and adjusted mortality rates of male and female prisoners, there is far more variation in the crude and adjusted mortality rates of males and females in the general population. This suggests that cross-state differences in SMRs partially reflect differences in inmate mortality but mostly reflect underlying differences in mortality in the general population.
while incarcerated (e.g., Spaulding et al. 2011). Some have also speculated that inmates may have just been in better health than individuals in the general population prior to being incarcerated, but new evidence suggests that is highly unlikely to be the case (Bacak and Wildeman 2015). In light of existing research on the topic, the lower SMRs for female inmates than male inmates could be partially explained by the fact that female inmates were in worse health upon prison entry relative to their peers in the population than male inmates were. Two-thirds of female prisoners reported a chronic medical condition whereas about one-half of male prisoners did; female inmates also suffer disproportionately from ailments ranging from arthritis and asthma to hypertension, kidney problems, and hepatitis (Maruschak 2008; Maruschak, Berzofsky, and Unangst 2015). Another possibility is that because females in the general population die at far lower rates of the causes of mortality that prisons most diminish (homicide, accidents, and overdose) than do males in the general population, female prisoners might simply have less to gain in terms of mortality reductions than do male prisoners, especially in the 18−54 age range that we considered here.
Third, there was significantly less cross-state variation in the imprisonment-mortality association for blacks, with especially minimal variation across states in this relationship for black males. Black male inmates also had the lowest SMRs of all six groups we considered, although this appears to be driven primarily by very high mortality in the general population.
Fourth, there seems to be a distinctive imprisonment-mortality relationship for Hispanic female state prisoners in New York, although given the small number of deaths among this group from 2001−2010 (20), this conclusion should not be oversold. Hispanic female inmates in New York were at a significant mortality disadvantage [SMR = 3.32; 95% CI: 1.82 to 4.88] relative to Hispanic females in the general population of New York. Because of how intriguing this finding is and how small an N it is based on, additional tests for the robustness of this relationship are especially needed since this finding would be quite provocative if it held up to further scrutiny.
considered only total mortality rates, and future research using these data might also consider causes of death.
Limitations aside, this article enhances our understanding of the relationship between imprisonment and mortality by providing insight into state-level variation in this relationship for black, white, and Hispanic males and females. The results suggest that although cross-state variation in mortality in the general population is greater than variation in mortality in the penal population, there is nonetheless significant variation in mortality in the penal population, calling for further investigation of conditions of confinement that might shape the mortality of inmates.
5. Acknowledgements
References
Bacak, V. and Wildeman, C. (2015). An Empirical Assessment of the “Healthy Prisoner Hypothesis”. Social Science & Medicine 138(1): 187−191.
doi:10.1016/j.socscimed.2015.05.039.
Binswanger, I.A., Stern, M.F., Deyo, R.A., Heagerty, P.J., Cheadle, A., Elmore, J.G., and Koepsell, T.D. (2007). Release from Prison − A High Risk of Death for Former Inmates. New England Journal of Medicine 356(2): 157−165.
doi:10.1056/NEJMsa064115.
Bureau of Justice Statistics (2014a). Data Collection: Deaths in Custody Reporting Program (DCRP). http://www.bjs.gov/index.cfm?ty=dcdetail&iid=243.
Bureau of Justice Statistics (2014b). Data Collection: National Prisoner Statistics (NPS). http://www.bjs.gov/index.cfm?ty=dcdetail&iid=269#Additional_Info. Bureau of Justice Statistics (2014c). Data Collection: National Corrections Reporting
Program (NCRP). http://www.bjs.gov/index.cfm?ty=dcdetail&iid=268. Carson, E.A. (2015). Prisoners in 2014. Washington, DC: Bureau of Justice Statistics. Centers for Disease Control and Prevention (CDC Wonder) (2014a). Bridged-Race
Population Estimates 1990-2012 Request. http://wonder.cdc.gov/Bridged-Race-v2012.HTML.
Centers for Disease Control and Prevention (CDC Wonder) (2014b). Underlying Cause of Death, 1999−2010 Request. http://wonder.cdc.gov/controller/datarequest/D76. Drucker, E. (2014). Restoring Justice: From Punishment to Public Health. American
Journal of Public Health 104(3): 388. doi:10.2105/AJPH.2013.301808.
Fazel, S. and Baillargeon, J. (2011). “The Health of Prisoners”. Lancet 377(9769): 956−965. doi:10.1016/S0140-6736(10)61053-7.
Maruschak, L.M. (2008). Medical Problems of Prisoners. Washington, DC: Bureau of Justice Statistics. doi:10.1037/e448112008-001.
Maruschak, L.M., Berzofsky, M., and Unangst, J. (2015). Medical Problems of State and Federal Prisoners and Jail Inmates, 2011−12. Washington, DC: Bureau of Justice Statistics.
Mumola, C.J. (2007). Medical Causes of Death in State Prisons, 2001−2004.
Washington, DC: Bureau of Justice Statistics. doi:10.1037/e603802007-001. Noonan, M.E. (2013). Mortality in Local Jails and State Prisons, 2000−2010 –
Statistical Tables. Washington, DC: Bureau of Justice Statistics.
Patterson, E.J. (2010). Incarcerating Death: Mortality in U.S. State Correctional Facilities, 1985−1998. Demography 47(3): 587−607. doi:10.1353/dem.0.0123. Preston, S.H., Heuveline, P., and Guillot, M. (2001). Demography: Measuring and
Modeling Population Processes. Malden, MA: Blackwell Publishing.
Rosen, D.L., Schoenbach, V.J., and Wohl, D.A. (2008). All-Cause and Cause-Specific Mortality Among Men Released from State Prison, 1980–2005. American Journal of Public Health 98(12): 2278. doi:10.2105/AJPH.2007.121855.
Rosen, D.L., Wohl, D.A., and Schoenbach, V.J. (2011). All-Cause and Cause-Specific Mortality Among Black and White North Carolina State Prisoners, 1995−2005.
Annals of Epidemiology 21(10): 719−726. doi:10.1016/j.annepidem.2011.
04.007.
Schnittker, J. and John, A. (2007). Enduring Stigma: The Long-Term Effects of Incarceration on Health. Journal of Health and Social Behavior 48(2): 115−130.
doi:10.1177/002214650704800202.
Spaulding, A.C., Seals, R.M., McCallum, V.A., Perez, S.D., Brzozowski, A.K., and Steenland, N.K. (2011). Prisoner Survival Inside and Outside of the Institution: Implications for Health-Care Planning. American Journal of Epidemiology
173(5): 479−487. doi:10.1093/aje/kwq422.
Wang, E.A., Aminawung, J., Wildeman, C., Ross, J.S., and Krumholz, H.M. (2014). High Incarceration Rates Among Black Men Enrolled in Clinical Studies May Compromise Ability to Identify Disparities. Health Affairs 33(5): 848−855.
doi:10.1377/hlthaff.2013.1325.
Wildeman, C. and Muller, C. (2012). Mass Imprisonment and Inequality in Health and Family Life. Annual Review of Law and Social Science 8: 11−31.