DEMOGRAPHIC RESEARCH
VOLUME 33, ARTICLE 27, PAGES 765–800
PUBLISHED 14 OCTOBER 2015
http://www.demographic-research.org/Volumes/Vol33/27/ DOI: 10.4054/DemRes.2015.33.27
Research Article
New perspective on youth migration:
Motives and family investment patterns
Jessica Heckert
©2015Jessica Heckert.
This open-access work is published under the terms of the Creative Commons Attribution NonCommercial License 2.0 Germany, which permits use, reproduction & distribution in any medium for non-commercial purposes, provided the original author(s) and source are given credit.
1 Introduction 766 1.1 Economic change, labor demands, and migration 767 1.2 Youth migration: general trends 768 1.3 Youth migration: a family-based strategy 770
1.4 Hypotheses 771
2 Data 772
2.1 Data source 772
2.2 Variables: migration motives 773
2.3 Variables: provision of support 774
3 Analysis 775
3.1 Descriptive analysis: migration motives 775 3.2 Event history analysis of youth education and labor migration 775
3.3 Provision of support 776
4 Results 777
4.1 Migration motives 777
4.2 Provision of financial support 786
5 Discussion 792
5.1 Migration motives 792
5.2 Provision of support 793
5.3 Limitations and future research 794
5.4 Conclusion 795
6 Acknowledgements 795
New perspective on youth migration:
Motives and family investment patterns
Jessica Heckert1
Abstract
BACKGROUND
Migration research commonly assumes that youth migrate as dependent family members or are motivated by current labor opportunities and immediate financial returns. These perspectives ignore how migration experiences, specifically motives and remittance behaviors, are unique to youth.
OBJECTIVE
This study investigates internal migration among the Haitian youth, aged 10–24. The study compares characteristics of youth who migrate with education and labor motives and determines characteristics associated with family financial support to youth migrants.
METHODS
The data are from the 2009 Haiti Youth Survey. Discrete-time event history analysis is used to model characteristics associated with education and labor migration. A two-stage Heckman probit model is used to determine characteristics associated with family financial support for two different samples of youth migrants.
RESULTS
Both education and labor migration become more common with increasing age. Education migration is more common among youth born outside the capital and those first enrolled in school on time. Labor migration differs little by region of birth, and is associated with late school enrollment. Moreover, rather than sending remittances home, many youth migrants continue to receive financial support from their parents. Provision of financial support to youth migrants is associated with current school enrollment. Female youth are more likely to be migrants, and less commonly receive support from their household of origin.
1 International Food Policy Research Institute, 2033 K Street NW,Washington, DC 20006, USA.
CONCLUSIONS
Results illustrate that youth migration motives and remittance behaviors differ from those of adults, and many households of origin continue to invest in the human capital of youth migrants. Education migration may diversify household risk over an extended time horizon.
1. Introduction
Increasingly, youth in developing countries2 are diversifying their opportunities through both domestic and international migration (McKenzie 2008; Yaqub 2009a). Though data detailing precise estimates by age are absent in most low- and middle-income countries, those younger than 18 years old represent approximately one-fourth of all migrants, and the proportion of youth as migrants is increasing (Global Migration Group 2014; Yaqub 2009a). Current research often assumes that youth are either dependent migrants who move alongside parents, or who, like adults, are labor migrants driven by wage differences and diversification of household risk, who will soon provide economic returns to their families (Tienda, Taylor, and Moghan 2007). Herein, I build on research highlighting the fact that education opportunities—both domestic and international– motivate youth migration (Boyden 2013; Crivello 2011; de Brauw and Giles 2008; McKenzie 2008). When present-day labor opportunities motivate migration, families often expect remittances and relatively quick returns on their investment (Massey et al. 1993; Stark and Bloom 1985; Todaro 1969). In contrast, parents of education migrants undertake a costly, multiyear investment period.
Using the example of Haiti, I question prevailing migration theory frameworks as they pertain to youth, and incorporate domestic education migration as a potential motive that can still diversify household risk across economic sectors and geographic regions, albeit over a longer time horizon (Stark and Bloom 1985). This novel perspective contributes to the literature by building on current understandings of education and migration, which are limited to the consequences of education accumulated prior to migration (de Haas 2010; Massey et al. 1993; Smith and King 2012). It also diversifies research on youth migration, which largely emphasizes factory growth in Asia and agricultural and domestic labor opportunities in Africa as its primary drivers (Hertrich and Lesclingand 2013; Knodel and Saengtienchai 2007; Mills 1999; Puri and Busza 2004). Highlighting education migration among youth illustrates
the idea that migration motives vary across the life course, and that families may use education migration to adapt to changing global contexts.
Haiti, where rates of youth migration are historically high, provides an ideal context for this study. The escalating demand for education, limited availability of education institutions in certain areas, cultural values that encourage migration, and land pressures that limit farming opportunities act jointly to encourage geographic mobility (Bredl 2011; Mintz 2010; Schwartz 2009). Drawing on data from the 2009 Haiti Youth Study, a nationally representative sample of youth aged 10 to 24 years, I first determine how primary migration motives differ with age. I then examine how time spent as an education or labor migrant is associated with particular characteristics, using discrete-time event history analysis. Finally, I determine the factors associated with families’ provision of financial support, using Heckman probit models for two different samples of youth migrants– those identified by households of origin and those identified at destinations. To provide context for this study, I first describe the social and historical context of migration in the region and how regional changes have generated a demand for more highly-skilled labor migrants, and review the current empirical evidence on youth migration.
1.1 Economic change, labor demands, and migration
Opportunities available to youth migrants depend on the social and economic characteristics of the origin and potential destinations. Intra-Caribbean migration patterns follow wage labor opportunities, and Haiti is the region’s largest producer of migrant laborers due to its relatively large population, political instability, and poverty (Ferguson 2003). The 2010 Human Development Index, which used indicators observed when the study data were collected, prior to the 2010 earthquake, ranked Haiti 145th of 169 countries– the only country in the Americas to fall into the lowest quartile; this rank has remained similarly low (168th of 187) in more recent years (United Nations Development Programme 2010, 2014). In contrast, nearby countries either rank in the upper range of medium development countries or are territories and overseas departments of wealthy countries. Moreover, an extremely high level of income inequality in Haiti (Gini coefficient = .60) suggests that unequal access to labor and education opportunities also underlies domestic migration (United Nations Development Programme 2010).
economy with tourism and manufacturing as its primary pillars (Palmer 2009). These regional economic transitions have largely excluded Haiti, due to political instability and economic embargos (Metz 2001). However, the proximity of these changes has transformed opportunities for Haitian migrants, via the demand for more educated and skilled workers. Haitian migrants have long fulfilled labor needs in physically-intensive agricultural production (e.g., sugar cane harvesting) in the region, and the overall pattern of migration from Haiti to wealthier countries has been relatively consistent during this time (Gammage 2004). Whereas decades ago the typical youth migrant was male and spent physically laborious days cutting sugar cane, opportunities for labor migrants in higher-skill sectors have become available. Those who currently seek jobs in service and tourism are often expected to speak multiple languages, operate computers, or produce and sell handicrafts. These changes have opened opportunities for women, and low-skill labor demands have also diversified. Inexpensive Haitian labor supports the construction industry, and as women in more industrialized Caribbean countries enter the formal labor market, they require domestic workers, a role oftentimes filled by Haitian women and adolescent girls (Palmer 2009).
The regional economic changes that have transformed Haiti’s internal and international migration landscape also influence the way parents invest in their children: the most productive young adult labor migrants need to have attained higher levels of education. When secondary schools are too distant for daily trips, which is the case in much of rural Haiti where youth live an average of 10 kilometers from a school that offers 7th grade and beyond (Filmer 2007), and rural schools are of poorer quality, parents are inclined to invest in education migration at younger ages (Boyden 2013). Importantly, this study speaks to questions prompted by broader global trends, including the rapid expansion and perceived value of education and labor opportunities that require more advanced skills.
1.2 Youth migration: general trends
demand for education is likely to have increased the number of young people who migrate to attend school, particularly among the poor (Boyden 2013). Despite the prevalence of independent youth migration, representative data have not yet captured young peoples’ migration motives or activities, nor has there been substantial research examining the extent to which young migrants receive support or send remittances. On the whole, these data shortcomings limit the development of youth-specific migration theories (Global Migration Group 2014; Yaqub 2009b).
The primary internal migration pattern among developing country youth is from rural to urban areas, and internationally, from less-developed to more-developed countries (McKenzie 2008; Yaqub 2009a). In both cases, the unequal distribution of resources and opportunities influences the flow of migrants (Piore 1979; Todaro 1969), and migration may be part of a broader household strategy to diversify risk (Lauby and Stark 1988; Stark and Bloom 1985). Multiple factors encourage youth to migrate, including direct motives, such as desire for employment and education, but these motives may also be embedded in ideological components, such as cultural and psychosocial factors and coming-of-age experiences (Massey et al. 1993; Punch 2007).
Historically in Haiti, labor migration often facilitated key life-course transitions among male youth; it allowed them to demonstrate their independence and earn financial capital to begin farming and construct a homestead (Schwartz 2009). Circular migration characterized intra-Caribbean migration, and many laborers were motivated to earn money and return home; in doing so, they demonstrated economic viability and readiness for adulthood (McElroy and de Albuquerque 1988; Schlesinger 1968). The support for and eventual return of young men helped to ensure that aging parents were connected to productive farmers.
1.3 Youth migration: a family-based strategy
Investments in children, including those that facilitate migration, serve to diversify and expand a household’s earning capacity and provide old age security for parents (Becker and Tomes 1994; Stark and Bloom 1985). Strategically supporting children’s labor and education migration is one means by which parents aim to achieve the household’s long-term viability (Jensen and Miller 2011). In addition to risk diversification and the expectation of future returns for the household, which is emphasized by the new economics of labor migration, ethnographic and qualitative work demonstrate that young people, even when they migrate without their parents, often do so as part of their connection to a larger family system (Boyden 2013). They may migrate with friends or kin, reside with the same friends or kin or others at their destinations, and continue to receive financial support from their families (Thorsen 2010). These practices reinforce existing social ties among far-flung family members (Hareven 1982). Parents may also continue to exert authority over young migrants via explicit or socially implied expectations and may continue to monitor young migrants via proxies (Castellanos 2007).
Considerable differences exist between education and labor migration. Principal among them are the higher costs of education migration and the longer duration before families could expect the migrant to send remittance or other support. A young person who migrates after completing 6th grade (International Standard Classification of Education (ISCED) Level 1) in Haiti has another seven years before completing secondary school (ISCED Level 3)3, during which it is necessary to pay school fees and provide living expenses (UNESCO Institute for Statistics 2011). Thus, education migration requires a substantial investment, in terms of both quantity and length, relative to the income of an average rural household. Though ideally a young migrant could earn money while attending school, this is rarely possible, as few employment opportunities compliment students’ schedules.
Among youth migrants, remittances sent from non-migrant parents to their children may play a critical role in maintaining well-being and funding education.
3 The Haitian school system is transitioning from the Traditional System to the Reformed System. Under the
Traditional System, students completed six years of primary school (ISCED Level 1), three years of lower secondary school (ISCED Level 2), and four years of upper secondary school (ISCED Level 3). Under the reformed system, students complete three cycles of basic education consisting of four, two, and three years each. The first two cycles (six years total) cover ISCED Level 1, are compulsory, and terminate with a state exam, making 6th grade a key transition year. The third cycle of basic education covers ISCED Level 2, and
Households in Port-au-Prince, Haiti’s capital city, are often conglomerates of extended kin and friends, and one-third of Port-au-Prince households receive regular remittances from the countryside (relationships between senders and recipients not identified) (Manigat 1997). This pattern contradicts common expectations that resources will soon flow from rural-to-urban migrants to their rural families following a brief investment period (Massey et al. 1993). The need for financial resources is especially pronounced among education migrants, who require sustained economic investment for school fees (which must be paid even for public schools), school materials, and living costs. Thus, the flow of resources among education migrants may run from rural parents to their urban children.
Gender dynamics may also dictate whether youth migrate, the extent to which parents invest in further opportunities, and experiences at the destination (Chiang, Hannum, and Kao 2015). Though the ratio of male to female migrants in the region is relatively equal, migration dynamics may differ (Global Migration Group 2014). Families may limit prolonged education investments in girls if the labor market is less hospitable to women (Buchmann 2000), and girls’ more intensive household labor contributions may tie them to the home, particularly if younger sisters are not available to replace them in their domestic responsibilities (Herrera and Sahn 2013; Hsin 2007). However, labor opportunities for women and girls are increasingly available, which may encourage labor migration, and the same factors that discourage parents from allowing their daughters to migrate may encourage urban households to receive girls, especially those who contribute domestic service (Moya 2007). Girls may view migration as an opportunity to break from gendered restrictions at home while maintaining family obligations by sending remittance back home and reinforcing relationships with kin at the destination (Castellanos 2007; Thorsen 2010).
1.4 Hypotheses
residence (particularly in Port-au-Prince), wealthier households, and higher educational attainment. In contrast, labor migration will be positively associated with living in an urban area, currently living in wealthier households, current labor force participation, and lower educational attainment.
Regarding the provision of financial support, I hypothesize that financial support will be more commonly received from households of origin by younger migrants, those still enrolled in school, and those from wealthier households of origin. Additionally, I hypothesize that both education and labor migration will be more common among male youth, given the potential for them to earn higher wages. Additionally, financial support will less commonly be provided to female youth, because parents will expect fewer future returns from investments in girls, and girls’ lodging and school fees will more often be met in exchange for conducting housework in destination households.
2. Data
2.1 Data source
To analyze young peoples’ migration motives and families’ provision of support for young migrants, I use data from the nationally representative 2009 Haiti Youth Survey (HYS), a nationally representative sample of young people aged 10 to 24 years and their households (Lunde 2009). This age range covers the generally accepted definition of youth, and includes the period immediately prior to when independent migration is expected to escalate. Selected households were identified through a multi-stage, stratified random design. Each household survey included (i) background information on the entire household, (ii) a household roster with detailed information on residents aged 10 to 24 years, (iii) a detailed individual interview, including a migration history module, with one randomly selected youth from the household, and (iv) a module on those who left the household within the past three years, including their current age, age at migration, whether the destination is rural, urban, or another country, and current activity at the destination4.
I identify youth migrants in these data through three approaches: (i) the migration histories of youth selected for in-depth interviews, (ii) those who departed from households during the past three years, referred to as migrants identified by households of origin, and (iii) those who reside separately from their living parents, referred to as migrants identified at the destination. Some migrants may have married or established
4In contexts where boarding schools are common for secondary school students and labor migrants reside in
their own households. Therefore, migration histories of those youth who have ever been married are included in analyses of migration motives and timing; they are, however, excluded from analyses of the provision of support, because marriage represents a fundamental change in how parents support their children. Among those identified as migrants at the destination, some may be left behind by migrant parents. Therefore the analyses of provision of support among migrants identified at the destination control for whether the individual was born in the household. Cases with incomplete data were few and excluded from the analyses.
I use migration histories from 1,318 youth to compare migration motives between the ages of 10 and 24, calculate the proportion of youth who have ever migrated for education or labor reasons, and model the log-odds of being an education or labor migrant in any particular year using discrete-time event-history analysis. I then examine the provision of support for 269 youth migrants identified by their household of origin and 725 youth migrants identified at the destination by using Heckman probit models, which simultaneously model (i) the provision of support for youth migrants and (ii) the probability of being a youth migrant compared to the 1,971 youth identified as non-migrants in household rosters.
2.2 Variables: migration motives
I classify migration motives into four groups according to the individual’s self-reported primary reason for migrating and their primary activity at the destination. Education migrants were those who reported that they migrated to attend school, attended school at the destination, and did not migrate to reunite with family. Labor migrants worked or looked for work at the destination. Family migrants reported that their primary intention was to follow or rejoin their family (even if they worked or attended school at the destination). Migration periods in which youth reported that they neither worked, looked for work, attended school, nor migrated to join family are classified as idle/other.
Respondents also reported the start and end dates of each migration episode. The dates are used to calculate age and duration of each period. Episodes that last at least three months and occurred after age 10 are included in the analysis.
19–21, 22–24). According to projected age-for-grade, 10–12 corresponds roughly with the end of primary school under the Traditional System or the 2nd cycle of basic education under the Reformed System (both ISCED Level 1). Most 10–12 year olds would have their respective grade available locally. Likewise, age 13–15 corresponds to lower secondary school or the 3rd cycle of basic education (ISCED Level 2), and age 19 and older corresponds to secondary school completion (ISCED Level 3). Delayed enrollment and a high incidence of grade repetition (e.g., mean age of a rural 6th grader in the 2005–06 Demographic and Health Survey is 16.5), however, suggest that most youth are much older than projected at these school transitions.
Households were from one of five geographic regions. Port-au-Prince includes the capital city and the surrounding metro area. The Southeast includes the West5 and Southeast departments. The North includes the North and Northeast departments. The South includes the Grande-Anse, Nippes, and South departments. The Central Region includes the Artibonite, Northwest, and Central Plateau departments.
Timing of first school enrollment is divided into on-time (age 5 to 6)6, moderately delayed (age 7 to 9), and severely delayed or never (age 10 or older). Per-capita income was calculated by summing the income reported by all household members divided by the number of members; income quintiles (poorest, poor, middle, wealthy, and wealthiest) are used in the analysis (see Lunde, 2009). The educational attainment of each household member was reported, and classified by whether any household adult (over 25) had completed 6th grade (ISCED Level 1). The individual respondent’s educational attainment was classified into three categories: has not completed 6th grade, completed 6th grade, and completed 9th grade (ISCED Level 2).
2.3 Variables: provision of support
Provision of support, the dependent variable, is binary and describes whether the household of origin provides money or goods to the youth migrant or the youth migrant’s current household. (The amount of these transfers was not reported.) For youth identified by the household of origin, this variable and all others were reported by the sending household. Among those identified at the destination, all information is reported by the respondent for the destination household. In both cases the selection variable in the Heckman probit model describes whether the individual is currently a migrant.
5 The West Department is in the central part of the country, surrounding Port-au-Prince, not in the western
part of the country.
6 The prescribed age for school entry was 6 years under the traditional system, which would have been in
Many of the same independent variables used to analyze migration motives are used to analyze provision of support. Among those identified by households of origin, additional independent variables include whether the youth returns to visit, whether the youth went to an urban or rural destination, and the time in months since he/she departed; these factors could confound whether support is sent. In the few cases where sending-households reported international migration, these were classified with urban destinations. For those identified at the destination, the household reported whether the youth was born in the current household. Temporary migration and household restructuring near the birth of a child is not uncommon, and the household of birth may not be where the individual was raised; including this variable helps control for the possibility that some youth were left behind by migrant parents.
3. Analysis
3.1 Descriptive analysis: migration motives
First, I calculate the percentage of migration episodes motivated by education, labor, family migration, and idle/other by age group. Age describes when each unique period began, and these calculations include all migration events reported by youth. Fewer migration events were initiated in the oldest age category (22–24), and the patterns were similar to 19–21 year olds; therefore, the two groups were combined.
I further examine when youth undertake their first education and labor migration events. I calculate the Kaplan-Meier survivor estimates for experiencing a first event separately for education and labor migration. I present these calculations as the proportion that has ever engaged in an education or labor migration episode (Pr(migration) = 1 – Pr(survival)). I use the log-rank test for equality to determine if the survivor function differs by gender.
3.2 Event history analysis of youth education and labor migration
Logistic regression is used to model an approximation of the hazard of being a migrant in any given year using the basic form of the equation:
𝑙𝑜𝑔𝑖𝑡ℎ�𝑡𝑖𝑗�= 𝛽0+𝛽1𝐴𝑔𝑒𝐺𝑟𝑝𝑠𝑖𝑗+𝛽2𝐶ℎ𝑎𝑟𝑎𝑐𝑡𝑒𝑟𝑖𝑠𝑡𝑖𝑐𝑠𝑖 (1)
where tij is the migration status of individual i at time j, age varies within each
individual over time, and remaining characteristics are consistent over time. Repeated years are clustered at the level of the individual (Singer and Willett 2003). Analyses were conducted separately for time spent as an education migrant and time spent as a labor migrant. For each outcome, Model 1 includes background characteristics that can likely be attributed to occurring before age 10 when respondents begin to experience the risk of independent migration. These include gender, time-varying categorical age groups, region of birth, vital status of parents, and school enrollment timing. Model 2 includes additional characteristics that represent current circumstances: type of place of residence (rural or urban), current region of residence, income quintile of current household, whether an adult in the household has completed 6th grade, currently in school, currently working, and current educational attainment.7
3.3 Provision of support
Next I examine whether youth migrants’ households of origin provide them with financial support. Two similar models, both of which describe provision of support for migrant youth, model this outcome for two different groups of migrants– those identified by households of origin and those identified at the destination. These models allow for complimentary comparisons that incorporate the different independent variables available according to whether the sending or receiving household reported the information. Models describing youth identified by households of origin are able to include characteristics of sending households, but sending families are limited in their ability to accurately describe destination household. In contrast, models describing youth migrants identified at destinations can include characteristics of current households, but lack accurate information on sending households.
I model the provision of support using two-stage Heckman probit models, ideal for when a dependent variable (provision of support) is only observed among a non-random group of respondents (migrant youth) (van de Ven and van Praag 1981). The first stage models selection using a probit model describing the underlying latent variable (propensity to migrant):
7 Additional data on locations that are neither the young person’s current residence nor residence at birth are
𝑦𝑗𝑠𝑒𝑙𝑒𝑐𝑡 =𝛽𝑥𝑗+µ1𝑗 (2)
The dependent variable is only observed among those for whom the propensity to migrate is greater than zero. Thus, the second stage models the binary dependent variable and describes the underlying relationships between the independent variables and the propensity to provide financial support.
𝑦𝑗∗=𝛽𝑥𝑗+µ2𝑗 (3)
This two-equation approach allows different independent variables to predict the probability of migration and the probability of providing support, and can incorporate independent variables that are only observed among migrants. For models describing migrants identified by the household of origin, selection into migration is a function of gender, age, current school enrollment and employment status, whether the sending household is rural, whether an adult from the sending household has completed 6th grade, and the income quintile of the sending household. The receipt of financial support is a function of gender, age, current school enrollment and employment status, whether an adult from the sending household has completed primary education, the income quintile of the sending household, whether the migrant visits the household, the number of months since departure, and whether the migrant went to an urban destination.
For migrants identified at the destination, selection into migration is a function of gender, age, whether the destination is rural, current school enrollment and employment status, and whether the young person was born in the current household. The receipt of financial report is a function of these same variables, and includes whether an adult in the destination household has completed primary education and the wealth quintile of the destination household.
4. Results
4.1 Migration motives
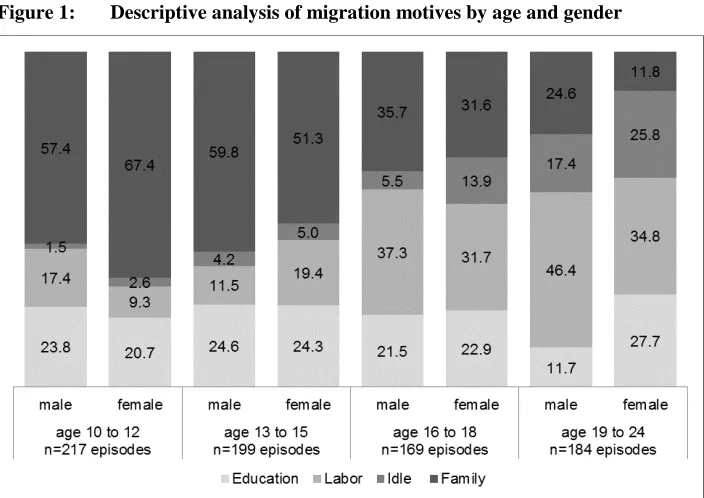
migrate among male and female youth 16–18 and 19–24. Labor migration differs by gender; among 10 to 12 year olds, it is almost twice as common among boys (17.4% of episodes) as among girls (9.3%).
Figure 1: Descriptive analysis of migration motives by age and gender
Note: Estimates account for weighting.
Whereas labor migration is more common with increased age, family migration becomes less common. Among the youngest (10–12), both boys and girls are most often tied migrants who accompany or join family members (57.4% of boys’ and 67.4% of girls’ migration episodes). The percent of family-motivated migration periods declines from the youngest to the oldest age groups. And among the oldest (19–24), only 24.6% of moves among male and 11.8% among female youth are for family reasons.
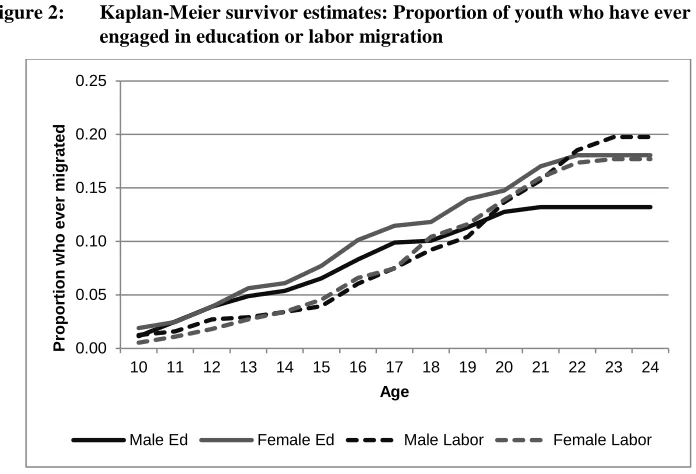
To further examine how widely education and labor migration are experienced, Figure 2 shows Kaplan-Meier survivor estimates of the weighted proportion of youth who have ever undertaken an education or labor migration episode, according to gender. The proportion of youth who have ever migrated to attend school increases steadily between ages 10 and 20 and then tapers off. Education migration is slightly higher among female youth, but the difference is not significant according to the log-rank test. The proportion of youth who have ever undertaken labor migration increases more slowly than education migration. The proportion engaging in labor migration surpasses educational migration around age 20 for males and around age 23 for females. The differences by gender are again insignificant.
Figure 2: Kaplan-Meier survivor estimates: Proportion of youth who have ever engaged in education or labor migration
Note: n=1343, estimates account for weighting.
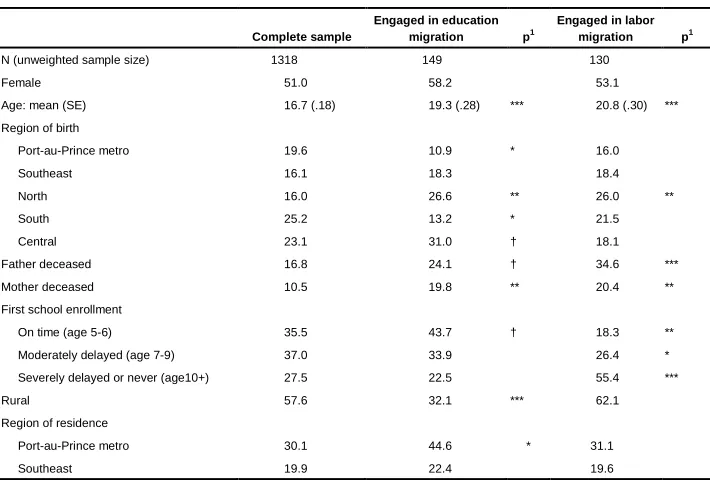
Next, I describe the background characteristics of the sample used to examine the characteristics associated with spending time as an education or labor migrant between the ages of 10 and 24. I first compare characteristics of youth who have ever engaged in education or labor migration, accounting for weighting and survey design (Table 1). Those who undertake education (58.2%) and labor migration (53.1%) are somewhat more likely to be female, compared to the complete sample (51.0%), but the difference
0.00 0.05 0.10 0.15 0.20 0.25
10 11 12 13 14 15 16 17 18 19 20 21 22 23 24
P
ropor
ti
on w
ho
e
v
e
r
m
igr
a
te
d
Age
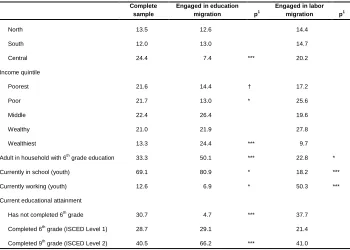
is not significant. Both migrant groups were older (education = 19.3; labor = 20.8) compared to the complete sample. Education migrants are less likely to have been born in Port-au-Prince (10.9%) and Grand-Anse, Nippes, and South (13.2%), compared to the complete sample (19.6% and 25.2% respectively); they are more likely to have been born in the North and Northeast (26.6% vs. 16.0%) and the Artibonite, Central Plateau, and Northwest (31.0% vs. 23.1%). Both education and labor migrants more often have a deceased parent. Education migrants are most likely to have started school on time, and labor migrants less commonly began school on time and more commonly experienced a moderate (between ages 7 and 9) or severely delayed school start (after age 10 or never).
Table 1: Descriptive characteristics of education and labor migrants compared to the complete sample (2009 Haiti Youth Survey)
Complete sample
Engaged in education migration p1
Engaged in labor migration p1
N (unweighted sample size) 1318 149 130
Female 51.0 58.2 53.1
Age: mean (SE) 16.7 (.18) 19.3 (.28) *** 20.8 (.30) ***
Region of birth
Port-au-Prince metro 19.6 10.9 * 16.0
Southeast 16.1 18.3 18.4
North 16.0 26.6 ** 26.0 **
South 25.2 13.2 * 21.5
Central 23.1 31.0 † 18.1
Father deceased 16.8 24.1 † 34.6 ***
Mother deceased 10.5 19.8 ** 20.4 **
First school enrollment
On time (age 5-6) 35.5 43.7 † 18.3 **
Moderately delayed (age 7-9) 37.0 33.9 26.4 *
Severely delayed or never (age10+) 27.5 22.5 55.4 ***
Rural 57.6 32.1 *** 62.1
Region of residence
Port-au-Prince metro 30.1 44.6 * 31.1
Table 1: (Continued)
Complete sample
Engaged in education migration p1
Engaged in labor migration p1
North 13.5 12.6 14.4
South 12.0 13.0 14.7
Central 24.4 7.4 *** 20.2
Income quintile
Poorest 21.6 14.4 † 17.2
Poor 21.7 13.0 * 25.6
Middle 22.4 26.4 19.6
Wealthy 21.0 21.9 27.8
Wealthiest 13.3 24.4 *** 9.7
Adult in household with 6th
grade education 33.3 50.1 *** 22.8 *
Currently in school (youth) 69.1 80.9 * 18.2 ***
Currently working (youth) 12.6 6.9 * 50.3 ***
Current educational attainment
Has not completed 6th
grade 30.7 4.7 *** 37.7
Completed 6th
grade (ISCED Level 1) 28.7 29.1 21.4
Completed 9th
grade (ISCED Level 2) 40.5 66.2 *** 41.0
Notes: † p < 0.10, *p < 0.05, **p < 0.01, ***p < 0.001. Estimates account for weighting and survey design. 1
Refers to t-test comparing sub-sample to non-migrants living with parents.
(12.6%). Education migrants also have overall higher educational attainment than the complete sample; 66.2% (vs. 40.5%) have completed 9th grade; many may accumulate education following migration.
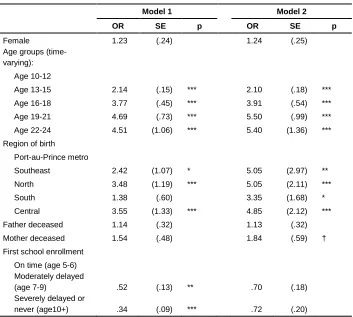
I then describe the results of discrete-time event history models that predict being an education (Table 2) or labor migrant (Table 3) in any given year. For each outcome, Model 1 includes characteristics that can be attributed to the time before migration, and Model 2 includes current characteristics. For both education and labor migrants, being a migrant is more common at older ages. The multivariate findings related to age suggest that older youth are more commonly migrants, which is consistent with the Kaplan-Meier survivor estimates.
Table 2: Discrete-time event-history analysis predicting time spent as an education migrant
Model 1 Model 2
OR SE p OR SE p
Female 1.23 (.24) 1.24 (.25)
Age groups (time-varying):
Age 10-12
Age 13-15 2.14 (.15) *** 2.10 (.18) ***
Age 16-18 3.77 (.45) *** 3.91 (.54) ***
Age 19-21 4.69 (.73) *** 5.50 (.99) ***
Age 22-24 4.51 (1.06) *** 5.40 (1.36) ***
Region of birth
Port-au-Prince metro
Southeast 2.42 (1.07) * 5.05 (2.97) **
North 3.48 (1.19) *** 5.05 (2.11) ***
South 1.38 (.60) 3.35 (1.68) *
Central 3.55 (1.33) *** 4.85 (2.12) ***
Father deceased 1.14 (.32) 1.13 (.32)
Mother deceased 1.54 (.48) 1.84 (.59) †
First school enrollment
On time (age 5-6) Moderately delayed
(age 7-9) .52 (.13) ** .70 (.18)
Severely delayed or
Table 2: (Continued)
Model 1 Model 2
OR SE p OR SE p
Rural .34 (.12) **
Region of current residence
Port-au-Prince metro
Southeast 1.40 (.60)
North .74 (.44)
South 1.30 (.55)
Central .64 (.39)
Income quintile:
Poorest (ref)
Poor .66 (.25)
Middle 1.18 (.43)
Wealthy .69 (.24)
Wealthiest 1.10 (.35)
Currently in school
(youth) 2.02 (.54) **
Currently working
(youth) .70 (.26)
Adult in household with
primary education 1.48 (.31) †
Current educational attainment (youth) Has not completed 6th grade (ref) Completed 6th grade
(ISCED Level 1) 3.55 (1.51) **
Completed 9th grade
(ISCED Level 2) 3.37 (1.35) **
Intercept .02 (.01) *** .00 (.00) ***
Person-years 10,279 10,279
F-test 12.30 *** 10.18 ***
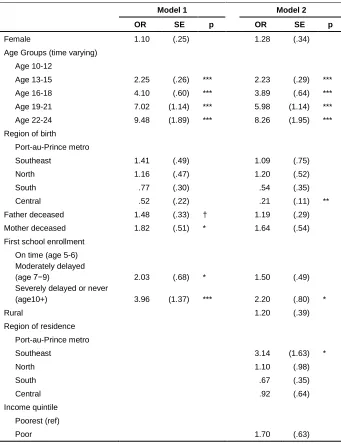
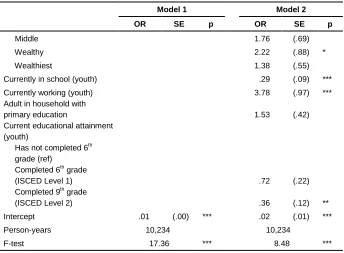
Table 3: Discrete-time event-history analysis predicting time spent as a labor migrant
Model 1 Model 2
OR SE p OR SE p
Female 1.10 (.25) 1.28 (.34)
Age Groups (time varying)
Age 10-12
Age 13-15 2.25 (.26) *** 2.23 (.29) ***
Age 16-18 4.10 (.60) *** 3.89 (.64) ***
Age 19-21 7.02 (1.14) *** 5.98 (1.14) ***
Age 22-24 9.48 (1.89) *** 8.26 (1.95) ***
Region of birth
Port-au-Prince metro
Southeast 1.41 (.49) 1.09 (.75)
North 1.16 (.47) 1.20 (.52)
South .77 (.30) .54 (.35)
Central .52 (.22) .21 (.11) **
Father deceased 1.48 (.33) † 1.19 (.29)
Mother deceased 1.82 (.51) * 1.64 (.54)
First school enrollment
On time (age 5-6) Moderately delayed
(age 7−9) 2.03 (.68) * 1.50 (.49)
Severely delayed or never
(age10+) 3.96 (1.37) *** 2.20 (.80) *
Rural 1.20 (.39)
Region of residence
Port-au-Prince metro
Southeast 3.14 (1.63) *
North 1.10 (.98)
South .67 (.35)
Central .92 (.64)
Income quintile
Poorest (ref)
Table 3: (Continued)
Model 1 Model 2
OR SE p OR SE p
Middle 1.76 (.69)
Wealthy 2.22 (.88) *
Wealthiest 1.38 (.55)
Currently in school (youth) .29 (.09) ***
Currently working (youth) 3.78 (.97) ***
Adult in household with
primary education 1.53 (.42)
Current educational attainment (youth)
Has not completed 6th grade (ref)
Completed 6th grade
(ISCED Level 1) .72 (.22)
Completed 9th grade
(ISCED Level 2) .36 (.12) **
Intercept .01 (.00) *** .02 (.01) ***
Person-years 10,234 10,234
F-test 17.36 *** 8.48 ***
Notes: † p < 0.10, *p < 0.05, **p < 0.01, ***p < 0.001. Estimates account for weighting and survey design.
Youth born outside Port-au-Prince are more likely to become education migrants than those born in Port-au-Prince, but place of birth is not associated with labor migration, except that those born in the Central Region are less likely to be labor migrants in Model 2.
After controlling for other factors, parental death is not associated with education migration. However, paternal orphans have somewhat higher odds of labor migration (OR=1.48 p<0.10), and maternal orphans exhibit significantly higher odds of labor migration (OR=1.82, p<0.05).
household wealth of education migrants, but education migrants are somewhat more likely to live in a household with an adult who has completed 6th grade (OR=1.48, p<0.10). Labor migrants more commonly reside in households in the fourth income quintile (wealthy). This may be a result of income or resources that they bring into the household, or because they reside with their employers.
Education migration is strongly associated with current educational attainment; this may occur because education is accumulated as a result of migration. Education migrants are twice as likely to currently attend school (OR=2.02, p<0.01) and more likely to have completed primary school (OR=3.55, p<0.01) and lower secondary school (OR=3.37, p<0.01). In contrast, labor migration among youth is associated with lower educational attainment. They are less likely to be in school (OR=0.29, p<0.001), more likely to be working (OR=3.78, p<0.001), and less likely to have completed 9th grade (OR=0.36, p<0.05).
4.2 Provision of financial support
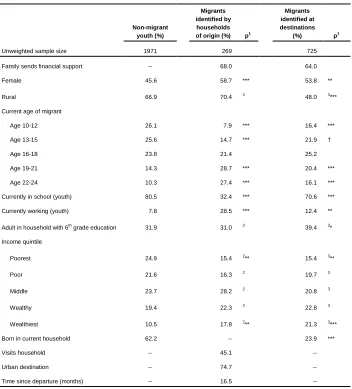
Table 4: Descriptive characteristics of non-migrant youth, youth migrants identified by households of origin, and youth migrants identified at destinations
Non-migrant youth (%)
Migrants identified by households of origin (%) p1
Migrants identified at destinations
(%) p1
Unweighted sample size 1971 269 725
Family sends financial support -- 68.0 64.0
Female 45.6 58.7 *** 53.8 **
Rural 66.9 70.4 2
48.0 3
***
Current age of migrant
Age 10-12 26.1 7.9 *** 16.4 ***
Age 13-15 25.6 14.7 *** 21.9 †
Age 16-18 23.8 21.4 25.2
Age 19-21 14.3 28.7 *** 20.4 ***
Age 22-24 10.3 27.4 *** 16.1 ***
Currently in school (youth) 80.5 32.4 *** 70.6 ***
Currently working (youth) 7.8 28.5 *** 12.4 **
Adult in household with 6th grade education 31.9 31.0 2 39.4 3*
Income quintile
Poorest 24.9 15.4 2** 15.4 3**
Poor 21.6 16.3 2
19.7 3
Middle 23.7 28.2 2
20.8 3
Wealthy 19.4 22.3 2
22.8 3
Wealthiest 10.5 17.8 2** 21.3 3***
Born in current household 62.2 -- 23.9 ***
Visits household -- 45.1 --
Urban destination -- 74.7 --
Time since departure (months) -- 16.5 --
Notes: † p<0.10, *p<0.05, **p<0.01, ***p<0.001. 1
Refers to t-test comparing sub-sample to non-migrants living with parents
2
Characteristic of sending household. 3
The non-migrant group is predominantly rural (66.9%), and 70.4% of migrants identified by households of origin come from rural households, whereas 48.0% of migrants identified at the destination currently reside in rural areas. Both migrants identified by households of origin and at the destination are more likely to be older (19-21 and 22–24), and less likely to be from the younger age groups (10–12 and 13–15).
Regarding school enrollment and employment status, migrants identified by households of origin are less likely to be in school, compared to the current stock of non-migrant youth (32.4% vs. 80.5%) and more likely to be working (28.5% vs. 7.8%). Similar findings apply to migrants at the destination, but the differences, though significant, are smaller; 70.6% are in school, and 12.4% work.
Among youth migrants identified by household of origin, household characteristics refer to the household from which they departed, and among migrants identified at the destination, these characteristics refer to their current residence. Migrants identified by households of origin more often than non-migrants come from the wealthier income quintile and less often from the poorest income quintile, and those identified at the destination are more often living in the wealthiest households and less often in the poorest households. Youth identified as migrants at the destination were also much less likely to have been born in their current household of residence (23.9% vs. 62.2%). Among migrants identified by households of origin, 45.1% visit the household regularly; 74.7% left for an urban area, and they have been gone an average of 16.5 months.
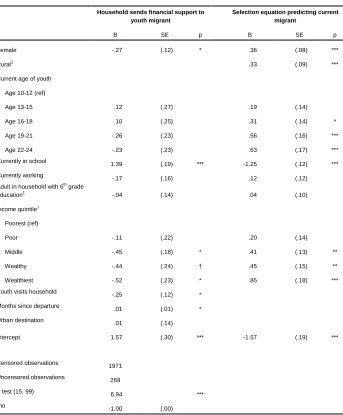
Table 5: Heckman probit model predicting provision of financial support for migrant youth identified by households of origin
Household sends financial support to youth migrant
Selection equation predicting current migrant
B SE p B SE p
Female -.27 (.12) * .36 (.08) ***
Rural1 .33 (.09) ***
Current age of youth
Age 10-12 (ref)
Age 13-15 .12 (.27) .19 (.14)
Age 16-18 .10 (.25) .31 (.14) *
Age 19-21 -.26 (.23) .56 (.16) ***
Age 22-24 -.23 (.23) .63 (.17) ***
Currently in school 1.39 (.19) *** -1.25 (.12) ***
Currently working
-.17 (.16) .12 (.12)
Adult in household with 6th grade
education1 -.04 (.14) .04 (.10)
Income quintile1
Poorest (ref)
Poor -.11 (.22) .20 (.14)
Middle -.45 (.18) * .41 (.13) **
Wealthy -.44 (.24) † .45 (.15) **
Wealthiest -.52 (.23) * .85 (.18) ***
Youth visits household -.25 (.12) *
Months since departure
.01 (.01) *
Urban destination .01 (.14)
Intercept 1.57 (.30) *** -1.57 (.19) ***
Censored observations 1971
Uncensored observations
269
F test (15, 99)
6.94 ***
rho -1.00 (.00)
Table 6: Heckman probit model predicting provision of financial support for youth migrants identified at destinations
Youth receives financial support from parents
Selection equation predicting current migrant
B SE p B SE p
Female -.16 (.07) * .18 (.06) **
Rural1 .28 (.11) ** -.17 (.08) *
Current age of youth
Age 10-12 (ref)
Age 13-15 -.05 (.09) .14 (.08) †
Age 16-18 .14 (.10) .22 (.08) **
Age 19-21 .14 (.10) .28 (.09) ***
Age 22-24 .12 (.13) .29 (.12) *
Currently in school .41 (.09) *** -.29 (.09) ***
Currently working
-.12 (.12) .17 (.11)
Born in household .81 (.09) *** -.89 (.08) ***
Adult in household with 6th grade education1
-.08 (.08)
Income quintile1
Poorest (ref)
Poor -.02 (.12)
Middle -.02 (.12)
Wealthy .07 (.13)
Wealthiest .02 (.12)
Intercept .63 (.16) *** -.24 (.13) †
Censored observations 1971
Uncensored observations
725
F test (14, 100) 13.84 ***
rho
-1.00 (.01)
Notes: † p<0.10, *p<0.05, **p<0.01, ***p<0.001. 1
Estimates from the selection equations reiterate findings from the previous analysis: older youth are more likely to migrate. Interestingly, whether parents provide support does not vary significantly across age groups. This may be because even older youth are still enrolled in school because of grade repetition or continuing education beyond secondary school. Both models suggest that migrant youth have a lower probability of being enrolled in school than non-migrants (departed: b=-1.25, p<0.001; separated: b=-0.29, p<0.001), and that being enrolled in school is associated with a higher probability of receiving support (departed: b=1.39, p<0.001; separated b=0.41, p<0.001). The effect of currently working did not significantly predict receipt of financial support, but both coefficients were negative. Migrants identified at the destination were less likely to have been born in the household (b=-0.89, p<0.001), but those who were born in the household were more likely to receive support (b=0.81, p<0.001). The effects for whether an adult in the household completed 6th grade were not significant.
Youth migrants identified by household of origin were more likely to be from the three upper income quintiles, but wealthier households less often sent support (conclusion after accounting for other factors). Among youth migrants identified at the destination, the wealth of the destination household was not associated with receiving financial support. That wealthier families were less likely to send support presents a paradox. It is possible that youth from wealthier families need less support if they are afforded work opportunities by social networks and educational attainment. It is also likely that these families send their children to equally well-off households with whom they had established family alliances. Hosting youth migrants and providing for their daily needs may have been part of an extended cycle of exchange (Boyden 2013). Furthermore, in the Haitian cultural context, accepting financial support from the migrant youth’s family of origin may, in fact, mean that the destination household would be less able to request a favor of the child’s parents in the future. Thus, by not accepting support, they create opportunities for further exchange of favors and non-financial support.
5. Discussion
5.1 Migration motives
This study examined migration among Haitian youth with the aim of integrating empirical evidence on youth’s motives and parents’ provision of financial support into contemporary migration frameworks. As a whole, it illustrates that education is often the goal of migration, and not just a determinant of it. Herein, I have presented evidence that migration is a strategy for gaining access to education and future labor opportunities, and that families may not expect immediate returns to migration investments. Approximately one-quarter of migration events among youth are undertaken with the specific intention of attending school, and nearly 15% of youth migrate at least once to attend school. Accessing these opportunities is often done with the continued financial support of the migrant’s natal family. Moreover, this strategy is not limited to the country’s elite, and even poor families use education migration as a means to bolster their children’s future economic productivity, which is consistent with theoretical ideas proposed in non-representative studies (Boyden 2013; Punch 2007; Smith and Gergan 2015).
Education migration should be conceptualized as a prolonged period of human- capital investment and as a means for diversifying risk across economic sectors and geographic regions. For many families, it is a continuation of earlier investments; those who enrolled in school on time are more likely to migrate for school, and education migration is strongly associated with continued school enrollment and higher educational attainment. In contrast, youth labor migrants more often started school behind schedule and are less likely to have completed 9th grade. Education migration may be one way that families compensate for a weak national education system and a lack of opportunities after key school transitions, particularly in rural areas.
Youth migration can also be differentiated from migration at older ages, because parents often continue to provide financial support for migrant youth. Receipt of financial support and current school enrollment are strongly and positively correlated. This provides further evidence that education migration functions as part of families’ continued investments in education.
The findings also reveal important gendered aspects of youth migration. Migration is more common among female youth (significant in Heckmann probit models predicting provision of support among current migrants, non-significant trend in event-history models predicting time as a migrant), but girls receive financial support from their parents less often than boys. There are multiple explanations for why this occurs. First, parents may invest less in their daughters if they believe there will be fewer payoffs in the labor market (Buchmann 2000); however, the increased availability of service-sector jobs suggests that opportunities are not unfriendly to women. Alternatively, households in primarily urban destinations may be more willing to receive girls, because of their household labor contributions. If girls are expected to work in the homes that receive them, parents may not be expected to send additional financial support. However, this may mean that girls are burdened with excessive household responsibilities in destination households where they live, which may conflict with school attendance and studying.
5.2 Provision of support
This study provides evidence that families continue to support migrant youth with money and other goods. To shed light on this process, I draw on ethnographic evidence and open-ended survey responses from interviews conducted with migrant youth. Participants were students recruited at the end of 6th grade in rural southeast Haiti; 224 youth were interviewed in August 2011 and February 2012, and 55 migrated to an urban area during this time.
Of the 55 migrant youth, 89% received goods and/or money from their families, and 80% of them received something at least once a month. Among recipients, 82% received food/groceries and 73% received money. In contrast, only 20% of youth migrants sent anything home to their families, most commonly small gifts (e.g., a bag of candy). Only two reported ever sending money home and four reported sending home food products (oil and rice).
parents may visit the child at their destination; frequent, short trips to urban destinations are common among women who sell products in the markets and need to replenish their wares. During these trips, parents commonly distribute money or provisions to their migrant children.
5.3 Limitations and future research
This study suffers from several limitations. Given the available data, it is not possible to consider the distance migrated, nor is it possible to link detailed information on sending and receiving households. Closer moves might be more common in the case of marriage or seeking improved or more affordable housing. However, better access to education and labor markets is likely to be facilitated only by more distant moves. Additionally, these data cannot distinguish how motives and activities may co-occur or be transformed during a single migration period.
These findings open doors for further lines of inquiry on youth migration. Future research should examine the processes that lead youth to migrate, and consider the consequences of early migration on individual life-course trajectories. Many advocacy and rights groups have expressed concern about the well-being of migrant youth (Lane 2008; Tienda, Taylor, and Moghan 2007). Young people may be more vulnerable to negative experiences during migration, because they are not yet fully developed physically and psycho-socially, often remain dependent on adults, have accumulated less knowledge, and maintain different social roles (Yaqub 2009b). They may also encounter new environments, ideas, and peers at a developmental juncture where exposure to novel experiences may be especially influential (Collins and Steinberg 2006). Empirical evidence that justifies these concerns and suggests how to improve the well-being of migrant youth is not yet well established.
The findings also raise questions on the role of early migration with regard to migration experiences later in the life course. Migration intentions are constantly being reevaluated, especially among youth; short-term intentions may lead to a more permanent status, whereas long-term plans may be cut short by numerous obstacles (Agadjanian, Nedoluzhko, and Kumskov 2008). Education migration may serve as an early phase in step-wise migration patterns, whereby those who previously migrated to attend school later capitalize on their improved skills in the labor market to migrate internationally or to other urban centers (King and Skeldon 2010). In some cases, shorter, internal migration events may lead to longer migration distances, or develop into repeated seasonal migration.
counted in household rosters if they are domestic workers, live on the street, or misidentify their residence as their natal home, and many surveys are intentionally timed to overlook circular migration (Yaqub 2009a). Moreover, collecting more detailed data on youth migrants is beyond the scope of most developing countries’ current population-monitoring strategies. Therefore, a priority for advancing research on youth migration should be better identification of youth migrants in existing surveys and longitudinal data that connect characteristics of young people before and after migration.
5.4 Conclusion
This study highlights two characteristics that differentiate youth migration: youths’ motives and families’ provision of financial support. Among youth, education motivates nearly a quarter of migration intervals; labor migration becomes increasingly common across the observed period, and is most common between ages 16 and 24, whereas family-tied migration becomes less common. Approximately two-thirds of unmarried youth migrants receive financial support from their parents. As a whole, findings illustrate that youth migration is often part of an extended period of parental investment. Migration theories should also account for education migration, a period of extended human-capital investment, when considering youth migration. Life-course variability in migration experiences has received limited empirical focus, and education migration should be conceptualized as one way that families continue to invest in their children’s future productivity. Future research should continue to examine the drivers and consequences of youth migration, but this will be largely dependent on the availability of applicable data.
6. Acknowledgements
References
Agadjanian, V., Nedoluzhko, L., and Kumskov, G. (2008). Eager to leave? Intentions to migrate abroad among young people in Kyrgyzstan. International Migration Review 42(3): 620–651. doi:10.1111/j.1747-7379.2008.00140.x.
Becker, G.S., and Tomes, N. (1994). Human capital and the rise and fall of families. In: Becker, G.S. (ed.). Human Capital: A Theoretical and Empirical Analysis with Special Reference to Education (3rd Edition). Chicago: The University of Chicago Press: 257–298.
Boyden, J. (2013). “We’re not going to suffer like this in the mud”: Educational aspirations, social mobility and independent child migration among populations living in poverty. Compare: A Journal of Comparative and International Education 43(5): 580–600.
Bredl, S. (2011). Migration, remittances and educational outcomes: The case of Haiti. International Journal of Educational Development 31(2): 162–168. doi:10.1016/j.ijedudev.2010.02.003.
Buchmann, C. (2000). Family structure, parental perceptions, and child labor in Kenya: What factors determine who is enrolled in school? Social Forces 78(4): 1349– 1378. doi:10.2307/3006177.
Castellanos, M.B. (2007). Adolescent migration to Cancún: Reconfiguring Maya households and gender relations in Mexico’s Yucatán Peninsula. Frontiers 28(3): 1.
Chiang, Y.-L., Hannum, E., and Kao, G. (2015). It’s not just about the money: Gender and youth migration from rural China. Chinese Sociological Review 47(2): 177– 201. doi:10.1080/21620555.2014.990328.
Collins, W.A., and Steinberg, L. (2006). Adolescent development in interpersonal context. In: Damon, W. and Lerner, R.L. (eds.). Handbook of child psychology (6th ed., Vol. 3, Social, Emotional, and Personality Development). Hoboken, NJ, USA: John Wiley and Sons, Inc: 551-590.
Crivello, G. (2011). “Becoming somebody”: youth transitions through education and migration in Peru. Journal of Youth Studies 14(4): 395–411. doi:10.1080/1367 6261.2010.538043.
de Haas, H. (2010). Migration and development: A theoretical perspective. International Migration Review 44(1): 227–264. doi:10.1111/j.1747-7379. 2009.00804.x.
Ferguson, J. (2003). Migration in the Caribbean: Haiti, the Dominican Republic and beyond. London, UK: Minority Rights Group International.
Filmer, D. (2007). If you build it, will they come? School availability and school enrollment in 21 poor countries. Journal of Development Studies 43(5): 901– 928. doi:10.1080/00220380701384588.
Gammage, S. (2004). Exercising exit, voice and loyalty: A gender perspective on transnationalism in Haiti. Development and Change 35(4): 743–771. doi:10.1111/j.0012-155X.2004.00378.x.
Global Migration Group (2014). Migration and youth: Challenges and opportunities. New York, NY: United Nations Children Fund.
Hareven, T.K. (1982). Family and industrial time: The relationship between the family and work in a New England industrial community. New York: Cambridge University Press.
Herrera, C. and Sahn, D.E. (2013). Determinants of internal migration among Senegalese youth. Rochester, NY: Social Science Research Network (SSRN Scholarly Paper; No. ID 2229584).
Hertrich, V. and Lesclingand, M. (2013). Adolescent migration in rural Africa as a challenge to gender and intergenerational relationships evidence from Mali. The ANNALS of the American Academy of Political and Social Science 648(1): 175– 188. doi:10.1177/0002716213485356.
Hsin, A. (2007). Children’s time use: Labor divisions and schooling in Indonesia. Journal of Marriage and Family 69(5): 1297–1306. doi:10.1111/j.1741-3737.2007.00448.x.
Jensen, R. and Miller, N. (2011). Keepin’ ‘em down on the farm: Migration and strategic investment in children’s schooling [unpublished manuscript]. http://www.gate.cnrs.fr/IMG/pdf/Jensen_SER_2013.pdf.
Knodel, J. and Saengtienchai, C. (2007). Rural parents with urban children: social and economic implications of migration for the rural elderly in Thailand. Population, Space and Place 13(3): 193–210. doi:10.1002/psp.436.
Lane, C. (2008). Adolescent refugees and migrants: a reproductive health emergency. Watertown, MA: Pathfinder International.
Lauby, J. and Stark, O. (1988). Individual migration as a family strategy: Young women in the Philippines. Population Studies 42(3): 473–486. doi:10.1080/ 0032472031000143596.
Lloyd, C.B. (ed.) (2004). Growing up global: The changing transitions to adulthood in developing countries. Washington, DC: National Academies Press.
Lunde, H. (2009). Haiti Youth Survey 2009. Volume I: Tabulation Report. Oslo: FAFO. Manigat, S. (1997). Haiti: The popular sectors and the crisis in Port-au-Prince. In: Portes, A., Dore-Cabral, C., and Landolt, P. (eds.). The urban Caribbean: transition to the new global economy. Baltimore, Maryland: Johns Hopkins University Press: 87–123.
Massey, D.S., Arango, J., Hugo, G., Kouaouci, A., Pellegrino, A., and Taylor, J.E. (1993). Theories of international migration: A review and appraisal. Population and Development Review 19(3): 431–466. doi:10.2307/2938462.
McElroy, J. and de Albuquerque, K. (1988). The impact of migration on mortality and fertility in St. Kitts-Nevis and the U.S. Virgin Islands. Caribbean Geography: A Journal of Geography for the Region 2(3): 177–194.
McKenzie, D.J. (2008). A profile of the world’s young developing country international migrants. Population and Development Review 34(1): 115–135. doi:10.1111/j.1 728-4457.2008.00208.x.
Metz, H.C. and The Library of Congress (US) Federal Research Division. (2001). Dominican Republic and Haiti: Country Studies (3rd ed.). Washington, DC: Library of Congress.
Mills, M.B. (1999). Enacting solidarity unions and migrant youth in Thailand. Critique of Anthropology 19(2): 175–192. doi:10.1177/0308275X9901900203.
Moya, J.C. (2007). Domestic service in a global perspective: Gender, migration, and ethnic niches. Journal of Ethnic and Migration Studies 33(4): 559–579. doi:10.1080/13691830701265420.
Palmer, R.W. (2009). The Caribbean economy in the age of globalization. New York, NY: Macmillan.
Piore, M. (1979). Birds of passage: Migrant labor and industrial societies. Cambridge: Cambridge University Press. doi:10.1017/CBO9780511572210.
Punch, S. (2007). Migration projects: children on the move for work and education. Paper presented at Independent Child Migrants: Policy Debates and Dilemmas organized by the Development Research Centre on Migration, Globalisation and Poverty, University of Sussex and UNICEF Innocenti Research Centre, Westminster, London, September 12 2007.
Puri, M.C. and Busza, J. (2004). In forests and factories: sexual behaviour among young migrant workers in Nepal. Culture, Health and Sexuality 6(2): 145–158. doi:10.1080/13691050310001619653.
Schlesinger, B. (1968). Family patterns in the English-speaking Caribbean. Journal of Marriage and Family 30(1): 149–154. doi:10.2307/350235.
Schwartz, T. (2009). Fewer Men, More Babies: Sex, Family, and Fertility in Haiti. Lanham, MD: Lexington Books.
Singer, J.D. and Willett, J.B. (2003). Applied longitudinal data analysis: Modeling change and event occurrence. New York: Oxford University Press. doi:10.1093/acprof:oso/9780195152968.001.0001.
Smith, D.P. and King, R. (2012). Editorial introduction: Re-making migration theory. Population, Space and Place 18(2): 127–133. doi:10.1002/psp.686.
Smith, S.H. and Gergan, M. (2015). The diaspora within: Himalayan youth, education-driven migration, and future aspirations in India. Environment and Planning D: Society and Space 33(1): 119–135. doi:10.1068/d13152p.
Stark, O. and Bloom, D.E. (1985). The new economics of labor migration. The American Economic Review 75(2): 173–178.
Tienda, M., Taylor, L., and Moghan, J. (2007). New frontiers, uncertain futures: Migrant youth and children of migrants in a globalised world. Zürich, Switzerland: Background paper prepared for Zurich Migration Workshop (Vol. 17), August 26 2007.
Todaro, M.P. (1969). A model of labor migration and urban unemployment in less developed countries. The American Economic Review 59(1): 138–148.
UNESCO Institute for Statistics (2011). International Standard Classification of Education. Montreal, Quebec: United Nations Educational, Scientific and Cultural Organization.
United Nations, Development Programme (2010). Human Development Report 2010: 20th Anniversary Edition. New York: Palgrave Macmillan.
United Nations, Development Programme (2014). Human Development Report 2014: Sustaining Human Progress: Reducing Vulnerabilities and Building Resilience. New York: United Nations Development Programme.
van de Ven, W.P.M.M. and van Praag, B.M.S. (1981). The demand for deductibles in private health insurance: A probit model with sample selection. Journal of Econometrics 17(2): 229–252. doi:10.1016/0304-4076(81)90028-2.
Yaqub, S. (2009a). Child migrants with and without parents: Census-based estimates of scale and characteristics in Argentina, Chile and South Africa. Florence, Italy: UNICEF Innocenti Research Centre (Discussion Paper; IWP-2009-02).