ANALYSIS ON PROBLEMS AND MOTIVATION OF POST
90S UNDERGRADUATES' ETIQUETTE
WEIHONG KONG
Department of Social Sciences, Handan College, Handan 056005, Hebei, China
ABSTRACT
At present, the post 90s has become the main part of the college students. The cultivation of excellent college students is not only to develop students' professional skills, but also to cultivate them with etiquette. However, at present the etiquette education in China for the post 90s college students is deficient. In this thesis, based on the multivariate stepwise regression and the Logistic regression in multivariate analysis, the multivariate stepwise regression model and multi-level Logistic regression model are established. At the same time, with the usage of SPSS and SAS software, this thesis carries on a detailed analysis of the post 90s college students' etiquette problems and influencing factors, and obtains a more scientific and objective result.
Keywords: The Post 90s, Multivariate Analysis, Stepwise Multiple Regression, Logistic Regression
1. INTRODUCTION
Multivariate analysis is mainly study relationship among the factors as well as the statistical analysis methods of individuals which contain these factors. It includes: multiple linear regression, discriminate analysis, cluster analysis, principal component analysis, factor analysis, canonical correlation, logistic regression, and cox regression.
Regression analysis is a quantitative study, which mainly studies the dependent degree of the dependent variable on the independent variable, analyses the correlation among the variables and provides basic methods for forecasting. Multiple linear regression studies the dependent degree of one dependent variable on several independent variables, it mainly includes the following methods: full-model, forward selection, backward selection, stepwise selection, and the full-model method has been widely used, its model is as follows:
0 1 1 2 2 p p
y=β +βx +β x + + β x +ε
y is a dependent variable, x x1, 2xp are
independent variables, β0 is the constant term,
1, 2 p
β β β are undetermined parameters (partial regression coefficients ), ε is the random error (residual).β β1, 2βp represent the average change quantity of each y, which was caused by one unit change of a independent variable when other independent variables are fixed. Based on the fitting regression of the preselected independent variables and one dependent variable, tests are carried out on
the effect of each independent variable on the dependent variables' changes. However, some of the results may statistically significant, some may not. Then how to pick and choose those factors which are significant on dependent variables? Usually, the stepwise regression analysis is adopted. According to the size of the role of each independent variable in the equation, introducing them to the equation from big to small. Carrying out a statistical test for each introduced independent variable(including the introducing one) in the regression equation when introducing an independent variable to the regression equation, if any of the independent variables has no statistical significance, then eliminating it. Keeping eliminating the independent variables that has no statistical significance in the equation until there is no independent variables for introducing and non for elimination. Thus those independent variables that may statistical significant for y are all introduced back to the equation, those independent variables which are not statistical significant foryare eliminated.
athlete is suitable for further training in a sports team. Discriminant analysis requires that the variable should be a binary classification or multi-classification attribute variable, then calculating it with Fisher and Bayes criterion. The discriminant function is:
1 1 2 2 k k
z=b x +b x + + b x
Discriminant threshold is used for testing the discriminant ability of discriminant function in practical application.
( )
( )
[
]
( )
( )
0 1 2 1 2
0
/
y n y a n y b n n
y b y y a
= + +
< <
。
Thus, if y>y0 :A category; if y< y0 :B
category.
Multiple linear regression requires y to be a normally distributed continuous random variable. If the independent variable is a categorical variable or a continuous variable then the linear regression analysis is not suitable for analyzing and the Logistic regression should be adopted. Logistic regression belongs to probabilistic regression, which is used for analyzing the relationship between the probability of certain events and their variables. Logistic regression is mainly implicated in the case that the dependent variables are binary variables (or multi-classification ). Its model is as follows: ln 1 j j ij j p
y a b x
p
= = + ∑
−
j
p is the probability of an event under the
(
1 , 2 , 3)
ij j j j mj
x = x x x x condition, 1−pj is the improbability of an event, i=1 ~m, m is the independent variables number, a is the intercept and bi is the estimating parameter. The curve of Logistic regression equation is S-type, the maximum predictive value approaches 1 , the minimum value approaches 0 .
cox regression is also known as the proportional risk model . It uses regressions to express the relationship between the survival time and different factors. It mainly solves effects of the multi-factors ( age, occupation, smoking, alcohol consumption, illness, treatment, etc. ) upon the survival ( recovery) time. The risk function is:
1 1 2 2 3 3
( )
0
( ) ( ) b x b x b x b xp p
h t =h t e + + + +
( )
h t is the risk function which also is known as the risk rate or instantaneous mortality; h t0( ) is the
datum risk function, it is a time-related arbitrary function.
Multivariate analysis theory is clear and simple, which has been widely used in practical applications. In this thesis, SPSS and SAS softwares are adopted for a multivariate analysis of the post 90s college students' etiquette.
2. PRESENT SITUATION ANALYSIS
Along with the expansion of enrollment in colleges and education's popularization, the post90s has become the main part of the college students. They are living in the social transition period and their value orientations, life styles and ideologies are diversified, however, etiquette education for the post 90s college students is insufficient. In China, there are less than 17% colleges and universities open etiquette course, only 48% colleges and universities offer etiquette related courses, The number of the teachers major in etiquette is only 5.5% of the total number of etiquette lessons teachers. The etiquette class accounted for less than 0.7% of all college classes. These data indicate that the issue of the post 90s college students' etiquette is quite severe.
Developed countries have payed more attention to students' comprehensive training, they not only develop students' professional skills but also advocate the etiquette training . However , the etiquette education in most colleges and universities of China is still imperfect. The training philosophy in some colleges is still stuck in a purely professional knowledge teaching, those school neglect the necessity of etiquette education, and more worse, some universities even put etiquette education courses as elective courses ,besides the teaching period is short so the effect is limited.
3. STEPWISE MULTIPLE REGRESSION
ANALYSIS
Table 1: Scores Of The 3000 Undergraduates
item score item score
1 1.918 1.043± 29 2.505 1.243±
2 2.276 1.257± 30 3.104 1.148±
3 2.113 1.194± 31 1.952 1.073±
4 2.804 1.062± 32 1.995 1.195±
5 1.490 0.947± 33 2.660 1.367±
6 1.895 1.135± 34 2.067 1.163±
7 2.384 1.074± 35 1.983 1.243±
8 2.428 1.219± 36 2.303 1.300±
9 2.112 1.043± 37 1.828 1.043±
10 2.137 1.173± 38 2.328 1.219±
11 1.983 1.051± 39 2.764 1.281±
12 2.804 0.945± 40 3.081 1.063±
13 2.665 1.043± 41 3.153 1.083±
14 3.075 0.983± 42 3.277 1.306±
15 3.172 1.159± 43 3.103 1.396±
16 2.236 1.043± 44 2.155 1.243±
17 2.031 1.128± 45 1.718 0.922±
18 1.999 1.143± 46 2.558 1.023±
19 1.918 1.066± 47 1.801 1.009±
20 3.059 1.171± 48 1.883 1.068±
21 1.894 1.126± 49 3.048 1.091±
22 2.954 1.113± 50 2.836 1.219±
23 2.003 1.135± 51 3.236 1.056±
24 1.846 1.062± 52 2.108 1.222±
25 2.221 1.266± 53 1.958 1.063±
26 2.618 1.264± 54 2.415 1.299±
27 3.377 1.167± 55 2.086 1.220±
28 2.189 1.115± 56 2.977 1.029±
Setting the Students' recognition and satisfaction on the etiquette education as independent variables. The assignment of cheating on exams : often = 4, normal = 3, occasionally = 2, never = 1; the assignment of two categorical variables :Yes = 2 , No = 1; the assignment of etiquette course satisfaction : < 40% = 1, 40 % to 65% = 2, 65 % = 3, > 85% = 4 ; putting the dummy variable form of
Table 2 : Results Of The Influencing Factors Of The Post 90s College Students' Etiquette
independent variables β Sβ
standardiz
ed β t value value P
constant term 95.16 6.240 - 15.248 0.000
littering Yes/No -5.254 1.668 -0.070 -3.155 0.002
self-centered Yes/No -6.980 2.800 -0.059 -2.497 0.012
Self-disciplined, respect
for others Yes/No -2.178 0.820 -0.061 -2.671 0.008
copying homework Yes/No -3.412 1.259 -0.060 -2.670 0.007
cheating in the exam
occasionally /
never -9.369 2.322 -0.157 -4.032 0.000 normal / never -11.161 2.680 -0.156 -4.163 0.000 often/ never -15.450 3.651 -0.121 -4.241 0.000
satisfaction with the
etiquette courses 65%~85% -3.832 1.360 -0.066 -2.823 0.006
>85% -4.148 2.350 -0.043 -1.759 0.077
helping each other Yes/No -3.295 1.345 -0.060 -2.472 0.012
social practice Yes/No -10.032 1.971 -0.115 -5.096 0.001
talking loudly Yes/No -6.929 1.258 -0.132 -5.563 0.001
4. LOGISTIC REGRESSION ANALYSIS
Logistic regression belongs to probabilistic regression. If the independent variables are
1, 2, , m
x x x , then the probability of a event is p, the improbability is 1−p , the ratio of them is
1
p odds
p
=
− , the regression model is:
( ) ln 1
p Logit p
p
= −
0 1 1x 2x2 mxm
β β β β ε = + + + + +
0
β is a constant item, β β1, 2,,βm is the summation of the regression coefficients, ε is both the error item and the random variable, E( )ε =0,
var( )ε ≥0
if y is a directional variable, the object can be
divided into k levels:y=1, 2,,k, the quantitative indicators of students investigating are
1, 2, , m
x x x . Setting pi =P y( ≥i i), =1, 2,,k ,
then the multi-level logistic regression model is established:
0 1 1 2 2
ln 1
i
i m m
i
p
x x x
p =β +β +β + +β +ε
−
,i=1, 2,, .k
Firstly, investigating the quantitative indicators of some students:x x1, 2,,xm, secondly, scoring
the level y by experts, finally the estimated values
0, 1, 2, ,
i m
β β β′ ′ ′ β ′ of the regression coefficients
0, 1, 2, ,
i m
β β β β are gained. Setting x x1, 2,,xm into the multi-level logistic regression model, then the achieving ability of each level which belongs to each investigated student is obtained.
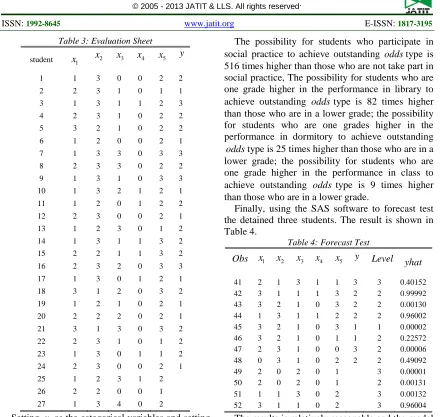
In this thesis, 27 post 90s college students of a university are selected as the research sample. Firstly, dividing the students' performance evaluation of a academic year into five aspects: age x1 , the performance in class x2 , the
performance in dormitoryx3, social practicex4 and
Table 3: Evaluation Sheet
student x1 x2 x3 x4 x5 y
1 1 3 0 0 2 2
2 2 3 1 0 1 1 3 1 3 1 1 2 3
4 2 3 1 0 2 2
5 3 2 1 0 2 2
6 1 2 0 0 2 1
7 1 3 3 0 3 3 8 2 3 3 0 2 2
9 1 3 1 0 3 3
10 1 3 2 1 2 1
11 1 2 0 1 2 2
12 2 3 0 0 2 1 13 1 2 3 0 1 2
14 1 3 1 1 3 2
15 2 2 1 1 3 2
16 2 3 2 0 3 3
17 1 3 0 1 2 1 18 3 1 2 0 3 2
19 1 2 1 0 2 1
20 2 2 2 0 2 1
21 3 1 3 0 3 2
22 2 3 1 0 1 2 23 1 3 0 1 1 2
24 2 3 0 0 2 1
25 1 2 3 1 2
26 2 2 0 0 1
27 1 3 4 0 2
Setting y as the categorical variables and setting
1, 2, , m
x x x as independent variables, the multi-level logistic regression model is established. Using the SAS software and the maximum likelihood estimating method to calculate the regression coefficient:
20 2 3
4 5 30
15.4072, 2.1828,
3.2153, 6.2463, 4.4112, 25.2319
β β β
β β β
′= − ′= ′
′ ′ ′
= = = = −
Thus the regression equation is:
3
2 3 4 5
3
ln 25.2319 2.1828 3.2153 6.2463 4.4112
1
p
x x x x
p = − + + + +
−
2
2 3 4 5
2
ln 15.4072 2.1828 3.2153 6.2463 4.4112
1
p
x x x x
p = − + + + +
−
The possibility for students who participate in social practice to achieve outstanding oddstype is 516 times higher than those who are not take part in social practice, The possibility for students who are one grade higher in the performance in library to achieve outstanding odds type is 82 times higher than those who are in a lower grade; the possibility for students who are one grades higher in the performance in dormitory to achieve outstanding oddstype is 25 times higher than those who are in a lower grade; the possibility for students who are one grade higher in the performance in class to achieve outstanding odds type is 9 times higher than those who are in a lower grade.
[image:5.612.97.294.78.469.2]Finally, using the SAS software to forecast test the detained three students. The result is shown in Table 4.
Table 4: Forecast Test
Obs x1 x2 x3 x4 x5 y Level yhat
41 2 1 3 1 1 3 3 0.40152 42 3 1 1 1 3 2 2 0.99992 43 3 2 1 0 3 2 2 0.00130 44 1 3 1 1 2 2 2 0.96002 45 3 2 1 0 3 1 1 0.00002 46 3 2 1 0 1 1 2 0.22572 47 2 3 1 0 0 3 2 0.00006 48 0 3 1 0 2 2 2 0.49092 49 2 0 2 0 1 3 0.00001 50 2 0 2 0 1 2 0.00131 51 1 1 3 0 2 3 0.00132 52 3 1 1 0 2 3 0.96004
The results is relatively reasonable and the model is in line with the actual situation.
5. CONCLUSION
This thesis by using the multi-level logistic regression model, analyses the problems and the influencing factors of the post 90s undergraduates' etiquette. The results of this study is scientific and objective.
REFERENCES
[1] Y. Jin, “Status and Countermeasures of the Current College Students' Etiquette Education. Journal of Zhengzhou College of Amimal Husbandry Engineering”, Vol.32, No.1, 2012, PP. 56-57.
[3] M. Luo, X. Jiang, “Multivariate analysis on the influencing factors of the classroom teaching quality”, Guangxi College of Education, Vol. 2, 3, 2001, pp. 105-109.
[4] J. Shu, H. Meng, P. Yin, Z. Mao, “Logistic regression analysis on influencing factors of the quality of life in college students”, Chin J Public Health, Vol. 22, No. 9, 2006, pp. 1125-1127.
[5] D. Wang, Q. Chen, X. Wu, “Multivariate Analysis on the Influencing Factors of College Students' Healthy Lifestyle”, Chin J Behav Med & Brain Sci., Vol. 20, No. 5, 2011, pp. 444-446. [6] L. Jin, “The application of Regression Model
--College Students' Employment Situation factor Analysis”, Economic & Trade Update, Vol. 5, No. 63, 2007, pp. 18-19.
[7] H. Sun, J. He, J. Fan, L. Zhang, M. Gong, “Applications of Stepwise Regression and Path Analysis in Principal Component Analysis”, Xinjiang Agricultural Sciences, Vol. 47, No. 3, 2010, pp. 431- 437.
[8] F. Xu, S. Li, Y. Zhang, “Stepwise Regression Method Based on the Double Screening Dependent Variable Partial Least Squares”, Statistics and Decision, Vol. 3, No. 4, 2008, pp. 25-27.
[9] G. Gao, W. Zheng, Y. Wei, “The Principal and Application of Components Improved Logis tic Regression”, Journal of Suzhou University, Vol. 28, No.4, 2008 , pp. 517-520 .
[10] F. Xue, Q. Gao, “The nuclear principal component logistic regression model in a non-linear correlation analysis”, Journal of Shandong University, Vol. 45, No. 5, 2011, pp. 140-146.
[11] H. Wang, “Logistic Regression Modeling Based on R Software”, HLJ Foreign Economic
Relations & Trade, Vol. 3, No. 11, 2010, pp.


![Assessment of Physiological Health Status in Relations to Different Anthropometric and Cardio respiratory Measures of Head Supported Load Carrying Male Porters of Sikkim, India [Article Retracted]](data:image/gif;base64,R0lGODlhAQABAIAAAP///wAAACH5BAEAAAAALAAAAAABAAEAAAICRAEAOw==)