Influence of Ultrasonic Vibrations on Grain Size and
Mechanical Properties of A-356 by Adding Al-5Ti-1B
Master Alloy during Solidification
Sahadeva G N*, A. S. Ravindran**, T Chandrashaker***, H.R.Vitala****
*
Department of Mechanical Engineering, EPCET,Bangalore **
Department of Mechanical Engineering, PNSIT, Bangalore ***
Department of Mechanical Engineering, VIT, Chennai ****
Department of Mechanical Engineering, SJBIT, Bangalore
Abstract- The refinement of the grain size will improve the
mechanical properties of AA-356 alloy by propagating ultrasonic vibrations through the die into the melt and adding Al-5Ti-1B master alloy during solidification. Ultrasonic vibrations produces cavitation effect by reducing pores, degassing and formation of more heterogeneous nucleating sites of AA-356 due to the presence of TiAl3 and Bal2 solutes of master alloy. The melt was vibrated at various frequencies and amplitudes with certain interval of time by adding master alloy (Al-5Ti-1B) at different fractions by using Taguchi Technique. From heterogeneous nucleation experimental results shows that the AA-356 structure was changed from columnar dendrite structure into equi-axed globular grain structure with reduction in grain size. The experimental results shows that due to reduced grain size, the mechanical properties like hardness, ultimate tensile strength were increased.
Index Terms- AA-356, Grain size, Master alloy, Mechanical
properties, Ultrasonic vibrations.
I. INTRODUCTION
luminum and its alloys plays very important role in engineering applications due to their light weight, low density, easy to fabricate, low thermal expansion, physical properties, low wear rate and its excellent corrosion resistance in most environmental conditions(1). AA-356 alloy is used in Aerospace, automobile, marine industry etc.
AA-356 is a hypoeutectic aluminum alloy containing 6.5-7% of silicon and contains about 50 volume % of eutectic phases (2). The final microstructure can be found by eutectic reaction (3).AA-356 is used to improve flowability of the melt and interfacial properties. To optimize the mechanical properties it necessary to control the grain size 0f AA-356 which otherwise solidifies with coarse columnar grain structure. So the grain refinement play a vital role to improve the properties of AA-356.This can be achieved by adding grain refiners like Al-5Ti-1B,Al-10Ti,Al-3B,Al-3Ti-3B etc in to AA-356 melt(4) and also by inducing ultrasonic vibrations(5,6,7). The Mechanical vibrations can be obtained by(8),electro magnetic vibrations(9),Magneto hydrodynamics(6),electro magnetic stirring mechanisms(11) etc,in to the melt through die .
In die casting and squeeze casting process it consists of so many defects like shrinkage, porosity, pores, discontinuity ,hot tears, air or hydrogen is trapped while pouring the molten metal in to the die cavity during solidification of metals(8). The ultrasonic vibration waves produce more heterogeneous nucleation in the melt. This is due to cavitations phenomena occur within the melt. This leads to degassing, reduce in hot cracking, reduction in porosities and formation of equi-axed grains in small size (7 ).
There was so much debate on ultrasonic vibrations that the vibrations are propagates in to the melt produces cavitations with large forces also the temperature variations in the melt (10, 11, 12). These pressure , temperature and force fluctuations induces heterogeneous nucleation and segregation control in the melt with reduced in grain size and formation of globular equi-axed non dendrite structure(13-16).
A fine grain size creates a more uniform distribution of secondary intermetallic interphases in addition to pores which form from the evolution of dissolved in the melt (16). The resultant increase in casting integrity is companied by improvements in both mechanical properties and pressure tightness (17-20).
Ultrasonic vibration treatment was known to induce refining effect in AA-356 alloys (17-22). The basic principle is introduction of acoustic waves with frequency 20 KHz to 30 KHz in to the liquid metal and high amplitude oscillations result in the cavitations of the melt and also promote intense mixing through agitation (23). The reported nucleation through local under cooling and wetting of substrates to fragmentation forming grains.
II. TAGUCHIMETHOD
Taguchi method offers a powerful tool for design of experiments. This methodology has taken the design of experiments from the exclusive world of the statistician and brought it more fully into the world of manufacturing (24). Taguchi method provides a simple, efficient and systematic approach to optimizing designs for performance, quality and cost. Taguchi proposed that engineering optimization of a process or product should be carried out as a three-step approach viz system design. Parameter design and tolerance design (25, 26).
Taguchi method is structured approach for determining the best combination of inputs to produce product or service. Based on design of experiments (DOE) methodology for determining parameters levels. DOE is important tool and is method for quantitatively identifying the right inputs and parameter levels for Making a high quality product and service (27, 28). The major step in Design of experiments is the evaluation of combination of factors and levels which provide desired information. Analysis of experimental results uses a signal to noise ratio to aid in the determination of the best process design using MINITAB software (29).
In present work the ultrasonic vibrations range from 20Khz, 24Khz and 28Khz were induced in to the melt through die during solidification to refine the grain structure from columnar dendrite structure into equi-axed globular grain structure with reduced in
grain size . The ultrasonic vibrations were induced around the die isothermally for different frequencies, amplitudes with certain interval of time for different fractions of master alloy (Al-5Ti-1B) and the effect of grain size and properties have been investigated.
III. EXPERIMENTATION
A. AA-356 alloy
In the present investigation the commercial aluminum AA-356 is used as base material. The composition is as shown in table1.
Table1
Element Si Mg Mn Fe Ni Zn Sn Ti Pb Al Wt % 6.5-7 0.3 0.02 0.1 0.05 0.01 0.01 0.02 0.02 Bal A Teflon coated permanent steel mold die is used in the
experimental setup. A cavity is made around the die to supply water for cooling purpose and the cavity can be closed at the top
[image:2.612.66.549.262.292.2]as shown in fig.1and fig.2. Fig.3 shows the experimental setup used to produce ultrasonic vibrations in the range of 1Hz to 100MHz
Fig 2. Die with copper winding
A copper coil having 3Ω resistance was wound around the die and is connected to the functional signal generator through transistor and D.C supply. A sine wave was generated by signal generator in the range of 1Hz to 1MHz and fed in to the coil as shown in fig.3. These Ultra-sonic vibrations around the die were propagate into the melt . The aluminum AA-356 alloy was melted separately using graphite crucible melting furnace, the melt is maintained at liquids temperature of 614◦C and the temperature was increased to 800◦C for 3hrs to melt completely. The primary Fcc structure of aluminum dendrites starts to form at 614◦C and the binary at 574◦C.Tertiary eutectic and complete intermetallics form at the later stages.
B. Master alloy
The master alloy or grain refiner (Al-5Ti-1B) was prepared separately by electrolysis method and it is cut in to required Wt% fraction and add into the AA-356 melt. The master alloy is added to the AA-356 melt and allow to melt for one more hour,
the mixer is thoroughly mixed using mechanical stirrer for different fractions 0.4Wt%(Al-5Ti-1B),0.6Wt%( ( (Al-5Ti-1B), 0.8Wt%( (Al-5Ti-1B). The castings were prepared according to taguchi method using L9 orthogonal array by taking the molten metal using ladle and poured into permanent steel mold die and it is solidified without inducing ultrasonic vibrations. Further for next experiments was generated using orthogonal arrays and analysis of parameters was done using ANOVA technique ,the molten metal is poured in to the die and ultrasonic vibrations were induced during solidification with 20Khz.24khz,28Khz at 40µm,60µm,80µm amplitude for 40s,80s,120s respectively for different compositions 0.4Wt%(Al-5Ti-1B), 0.6Wt%(Al-5Ti-1B),0.8Wt%(Al-5Ti-1B) etc.
S/N ratio is performed to identify the statically significant parameters.
Fig 3. Circuit diagram of ultrasonic vibration set up
The specimens are prepared using castings according to ASTM standards for grain size, hardness and tensile test, the specimens were polished, etched with use of HCL, HNO3,Cu and water solution for grain size and hardness . On etched
specimens , hardness and tensile specimens were conducted. Compare them with and without ultrasonically treated specimens and analyzed using Taghuchi Method using “Larger the better”.
dB
1
1
log
ratio
S/N
1 2
10
=
∑
= n
i
y
in
Where y1,y2,…..yi are responses. n is number of observations.
L9 test
A Master alloy
B Frequency (kHZ)
C
Amplitude (µm)
D Holding time(s)
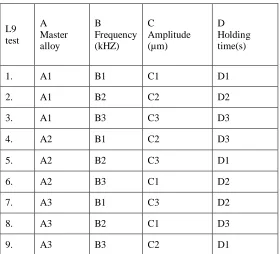
1. A1 B1 C1 D1 2. A1 B2 C2 D2 3. A1 B3 C3 D3 4. A2 B1 C2 D3 5. A2 B2 C3 D1 6. A2 B3 C1 D2 7. A3 B1 C3 D2 8. A3 B2 C1 D3 9. A3 B3 C2 D1
Table2 L9 Orthogonal array of Taguchi
IV. RESULTANDDISCUSSION
The Vickers hardness test carried out in the present investigation and the cast samples before and after the addition of grain refiners with or without ultrasonic vibrations.The main aim of the experimental plan was to find the important factors and
that involves graphing the effects and visually identifying the significant factors.
The results for various combinations of parameter were obtained by conducting the experiments as per the orthogonal array. The measured results were analyzed using the commercial software MINITAB 14 specially used for design of experiment
applications. Table 3 and table 6. Shows the experimental results of average repetitions for hardness and tensile strength.To measure the quality characteristics the experimental values are transformed in to signal to noise ratio. The influence of control parameters such as frequency, amplitude and period of time has been analysed using signal to noise response table.
EX. No
Process parameter level
Hardness
HV
S/N ratio (dB)
A Master Alloy
B
Frequency (KHz)
C
Amplitude (µm)
D Holding Time (Sec)
Test run 1 2 3
1 0.4 20 40 40 62 66 63 64 36.12359948 2 0.4 24 60 80 77 74 71 74 37.38463439 3 0.4 28 80 120 74 73 78 75 37.50122527 4 0.6 20 60 120 67 72 71 70 36.9019608 5 0.6 24 80 40 66 70 68 68 36.65017825 6 0.6 28 40 80 70 76 76 74 37.38463439 7 0.8 20 80 80 74 68 74 72 37.14664993 8 0.8 24 40 120 67 69 74 70 36.9019608 9 0.8 28 60 40 67 64 64 65 36.25826713
Table3 S/N ratio for Hardness (HV)
The mean S/N ratio for each level is summarized in the response table 4. The total mean S/N ratio for the nine experiments is also calculated.
Total mean S/N ratio = 36.98465462
Symbol Process
parameter Level 1 Level 2 Level 3
Optimum level (max. S/N ratio)
A Master Alloy
37.00 36.98 36.77 A1
B Frequency
(KHz) 36.72 36.98 37.05 B3 C Amplitude (µm)
36.80 36.85 37.10 C3
D Holding Time (S) 36.34 37.31 37.10 D2
Table4 Response table for mean S/N ratio for hardness and significant interaction
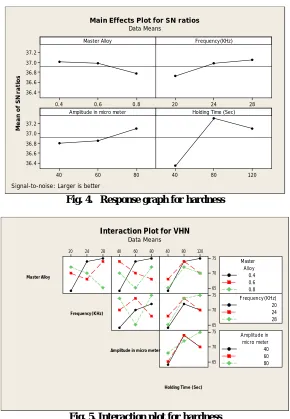
A response graph is drawn using the values from the response table 4. The response graphs exhibit a pictorial view of variation of each parameter and describe what the effect on
0.8 0.6
0.4 37.2 37.0 36.8 36.6 36.4
28 24
20
80 60
40 37.2 37.0 36.8 36.6 36.4
120 80
40 Master Alloy
M
ea
n
of
S
N
ra
ti
os
Frequency(KHz)
Amplitude in micro meter Holding Time (Sec)
Main Effects Plot for SN ratios
Data Means
Signal-to-noise: Larger is better
Fig. 4. Response graph for hardness
28 24
20 40 60 80 40 80 120
75
70
65 75
70
65 75
70
65
Master Alloy
Frequency(KHz)
Amplitude in micro meter
Holding Time (Sec)
0.4 0.6 0.8 Alloy Master
20 24 28 Frequency(KHz)
40 60 80 micro meter Amplitude in
[image:5.612.161.451.51.470.2]Interaction Plot for VHN Data Means
Fig. 5. Interaction plot for hardness
From the response graph, the optimal parameters for maximum hardness are:
• Master Alloy at level 1, A1 = 0.4wt%(Al-5Ti-1B) • Frequency at level 3, B3= 28Khz
• Amplitude at level 3, C3 = 80(µm) • Holding Time at level 2, D2 = 80s
A. Analysis of variance (ANOVA)
The contributing ratio of the control factors in getting the maximum as brought out by ANOVA is shown in table 3 and the
[image:5.612.58.552.636.732.2]corresponding Pareto ANOVA diagram is shown in Fig. 4. It is seen that the F ratio values of parameters A, B , C and D are all greater than F-ratio values at 76% significance level drawn from table . The Pareto analysis shows that the weight fraction of master alloy at 0.4wt% has contributed higher impact on hardness. It is concluded that the weight fraction is the major contributing factor and frequency at 28Khz,amplitude at 80(µm) and holding time 80s were influencing higher imact factor(77.69%)on hardness . The weight fraction of master alloy at 0.4wt% has contributed higher impact on hardness.
Source of variation
Degrees of freedom
Sum of
squares Variance
Pure
variation F-ratio Contribution %
Weight fraction Master Alloy
% - A 2 6.89 3.44 0.934 0.07* 5.48 Frequency
Holding Time (S)-D 2 97.56 48.778 0.011 10.45 77.69
[image:6.612.78.495.51.292.2]Total 8 125.56 100
[image:6.612.175.439.112.287.2]Table 5: Results of analysis of variance for hardness
Fig. 6. Pareto analysis for Hardness
B. Prediction of optimum performance
At the optimum setting condition, the optimum hardness is estimated using following Eq.
Predicted optimal hardness = (A'1 – T) + (B'3 – T) + (C'3 –
T) + T
where A'1 is the average hardness value for first level
weight fraction, B'3 is the average hardness value for third level
of frequency combination, C'3 is the average hardness value for
third level of amplitude and T is the mean hardness value from all experimental data. In calculating the estimate, we use only strong effects.
Predicted optimum value of hardness = (71 – 70.22) + (69 – 70.22) + (70.66 – 70.22) + 70.22 = 70.22
C. Confidence interval
From Eq. 1, the confidence interval of the above predicted estimate at 76% significance = ±1.22 i.e., the experimental values should lie within the predicted range of 70.22±1.22 = 71.44.
D. Confirmation test
A confirmation test was carried out at the optimum settings of the process parameter recommended by the investigation, i.e., 0.4wt% weight fraction, 28Khz frequency, 80 m amplitude and
80s of holding time. The hardness value obtained at the optimum setting is 70.95
EX. No
Process parameter level
Tensile strength (N/mm2)
S/N ratio (dB) A
Master Alloy
B
Frequency (KHz)
C
Amplitude (µm)
D Holding Time (Sec)
1 0.4 20 40 40 175.5 44.8855 2 0.4 24 60 80 173.7 44.796 3 0.4 28 80 120 175.7 44.8954 4 0.6 20 60 120 191.5 45.6434 5 0.6 24 80 40 187.5 45.46 6 0.6 28 40 80 177.8 44.9986 7 0.8 20 80 80 192.8 45.7021 8 0.8 24 40 120 186.7 45.4229 9 0.8 28 60 40 191.7 45.6524
[image:6.612.114.500.478.693.2]The mean S/N ratio for each level is summarized in the response table 4. The total mean S/N ratio for the nine experiments is also calculated.
Total mean S/N ratio = 45.2484
Symbol Process
parameter Level 1 Level 2 Level 3
Optimum level (max. S/N ratio)
A
Master Alloy 44.86 45.37 45.59 A3
B Frequency
(KHz) 45.41 45.23 45.18 B1
C
Amplitude (µm)
45.10 45.36 45.35 C2
D
Holding Time (S)
45.33 45.17 45.32 D1
Table7 Response table for mean S/N ratio for Tensile strength and significant interaction
0.8 0.6
0.4 45.6
45.4
45.2
45.0
28 24
20
80 60
40 45.6
45.4
45.2
45.0
120 80
40 Master Alloy
M
ea
n
of
S
N
ra
ti
os
Frequency(KHz)
Amplitude in micro meter Holding Time (Sec)
Main Effects Plot for SN ratios
Data Means
[image:7.612.151.463.287.493.2]Signal-to-noise: Larger is better
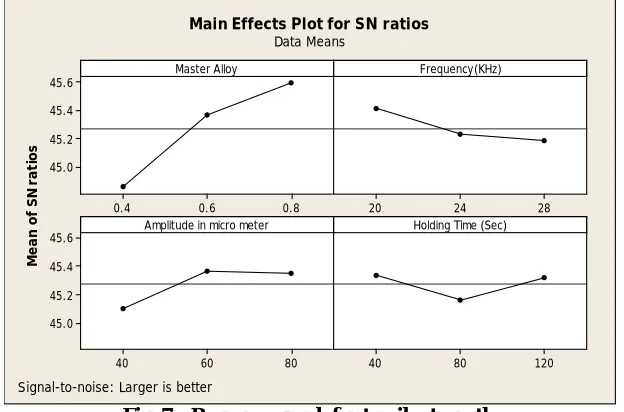
Fig. 7. Response graph for tensile strength.
A response graph is drawn using the values from the response table 8. The response graphs exhibit a pictorial view of variation of each parameter and describe what the effect on system performance would be, when a parameter shifts from one level to another. Fig.7 shows the response graph for tensile strength.
From the response graph the optimal parameters for maximum tensile strength are,
• Master Alloy at level 3, A3 = 0.8wt%(Al-5Ti-1B) • Frequency at level 1, B3= 20Khz
• Amplitude at level 2, C2 = 60(µm) • Holding Time at level 1, D1 = 40s
E. Analysis of variance (ANOVA)
Source of variation
Degrees of freedom
Sum of
squares Variance
Pure
variation F-ratio
Contribution %
Weight fraction Master Alloy
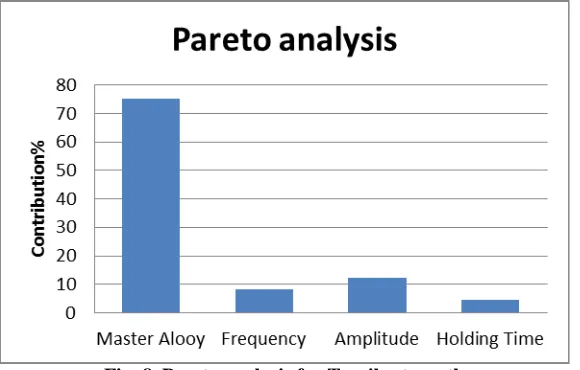
% - A 2 374.3 187.17 0.056 16.76* 75.29 Frequency
(KHz) - B 2 40.23 20.11 0.357 1.8* 8.09 Amplitude (µm)- C 2 60.27 30.13 0.270 2.7 12.13 Holding Time (S)-D 2 22.33 11.16 0.270 2.7 4.49
[image:8.612.83.527.54.216.2]Total 8 497.13 100
Table 8: Results of analysis of variance for tensile strength
F. Prediction of optimum performance
At the optimum setting condition, the optimum tensile strength is estimated using following Eq.
Predicted optimal hardness = (A'3 – T) + (B'1 – T) + (C'2 –
T) + (D’1-T) + T
where A'3 is the average tensile strength value for third level weight fraction, B'1 is the average tensile value for first
level of frequency combination, C'2 is the average tensile
strength value for second level of amplitude, D’1 is the average tensile strength of first level and T is the mean tensile strength
value from all experimental data. In calculating the estimate, we use only strong effects.
Predicted optimum value of tensile strength = (190.4 – 183.65) + (174.96 – 183.65) + (185.6 –183.65) + 183.65 = 183.66
G. Confidence interval
From Eq. 1., the confidence interval of the above predicted estimate at 77.7% significance = ± 1.22 i.e., the experimental values should lie within the predicted range of 183.66 ± 1.22 = 184.88 N/mm2.
Fig. 8 Pareto analysis for Tensile strength
H. Confirmation test
A confirmation test was carried out at the optimum settings of the process parameter recommended by the investigation, i.e., 0.8wt% weight fraction, 20Khz frequency, 60 m amplitude and
40s of holding time. The tensile strength value obtained at the optimum setting is 185.01
I. Tensile strength
The results for various combinations of parameters were obtained by conducting the experiments as per the orthogonal array. The data on the Tensile stength was analyzed by using Taguchi method by using MiniTab-15 software. The contributions of the input variables and their interaction are shown in main effects plot fig 4. According to Signal to-noise
ratio for larger is the better, the higher mean value of ultimate tensile strength is given by 0.8wt%(Al-5Ti-1B), 28KHz,60µm and 40s holding time as shown in fig 7.
[image:8.612.164.454.388.573.2]V. CONCLUSION
In present investigation high intensity ultrasonic vibrations eliminate coarse grains and forms globular equi-axed grains small grains approximately 25µm, which shows that the grains are refined is related to nucleation (hetrogeneuos) and survival of small nuclei or embryos of grains formation by improving mechanical properties like hardness and ultimate tensile strength. From the confirmation test it is concluded that the optimum settings of the process parameter recommended by the investigation, for hardness i.e., 0.4wt% weight fraction, 28Khz frequency, 80 m amplitude and 80s of holding time. The
hardness value obtained at the optimum setting is ----
Again from the confirmation test it is concluded that the optimum settings of the process parameter recommended by the investigation, for tensile strength i.e., 0.8wt% weight fraction, 28Khz frequency, 80 m amplitude and 40s of holding time. The
tensile strenth value obtained at the optimum setting is ---- The experimental result shows that the overall results the hardness and ultimate tensile strength is increased by around 13% and 16% respectively compare to pure AA-356 when it is treated ultrasonically when it is compare with the pure aluminum AA-356 without ultrasonic treatment.
It can be seen that for hardness 0.4wt % (Al-5Ti-1B), 28KHz,80µm and 80s of holding time is more effective and for ultimate tensile strength 0.8wt%(Al-5Ti-1B)grain refiner is more effective when it is treated 20KHz frequency with amplitudes 80µm for 80 se. This is due to cavitations assisted fragmentation is the main contributor to grain refinement to produce small grain size to increase tensile strength.
The microstructure shows that the porosities are reduced to larger extent under ultrasonic treatment which leads to better flow properties for fluidity of complex mold designs.
REFERENCES
[1] ASTM Hand book Vol.2. “Properties and selection non ferrous alloys and special purpose materieals”. USA; ASM interaction, The material information society;.1990.
[2] S.R Sharma Z.Y.Ma,R.S Mishara, “Effect of friction strirr processing on fatigue behavior of A- 356 alloy”, Scripta materials,51(2004),237-241. [3] Jain X,Xu.H Meek TT,Han Q. “Refinement of eutectic silicon phase of
aluminium AA-356 alloy using high intensity ultrasonic vibrations”. Scripta materialia 54(2006) P893-896.
[4] K T.Kashyap ,T.Chandrashekar. “Effects and mechanism of grain refinement in aluminium alloys”. Mater sc. Vol.24,no4.2001.P345-353. [5] Jain X,Xu.H Meek TT,Han Q “Effect of power ultrasound on solidification
of AA-356 alloy,Meter.lett 2005 59,P190-193.
[6] G.I Eskin. “Ultrasonic treatment of light alloy melts”. Amasterdom,Gordon and Breach publishers. 1998,P 155.
[7] Sahadeva G.N, A.S Ravindran,H.R.Vitala,T.Chandrashekar, “Grain refinement of AA-356 by inducing ultrasonic vibrations and adding grain refiners during solidification”. IJMMR,(2014),pp 723-730.
[8] Chaowalik limmance, v.chiitr,songwid pongana npanya, Kajornchaiyakal.”Metallurgica structure of AA-356 alloy solidified under mechanical vibrations”.2009,Materials and design Elseware 30,3925-3930. [9] Charles Vives. “Grain refinement in aluminium alloy by means of
electromagnetic vibrations including cavitation phenominona”. 1998 vol.50 no2 JOM.
[10] Songli zang,yutoo zhao,Xico nongchand.”High energy ultrasonic field effect on microstructure and mechanical bevaviur of AA-356 alloys”.Journal and component ,470(2009),168-172
[11] Jain X,Xu.H Meek TT,Han Q “Effect of power ultrasound on solidification of AA-356 alloy,Meter.lett 2005 59,P190-193.
[12] A.Das and H.R Kotadia, “Study of high intensity ultrasonic irradiation on the modification of solidification microstructure in a Si-rich hypoeutectic Al-Si alloy,” Mater.Chem. Phys, 125(2011)P.853-859.
[13] S.L Zang et al. “High intensity ultrasonic field effects on the microstructure and mechanical behavior of A-356 alloy,” J. alloys compd, 47 (2009),P. 168-172.
[14] A.H.Freedom and J.F. Wallance, “Yhe influence of vibrations on solidifying metals,” Trans. AFS 56 (1997), P. 578-597.
[15] N. Abu-Dheir et al., “Silicon morphology modifications in the eutectic Al-Si alloy using mechanical vibrations.” Mater. Sci.Eng. A.393A (2005).P. 109-117.
[16] Han y,Li.K Wang J,Shu.D.sun B. “Influence of high intensity ultrasound on grain refinement of Al-5Ti-1B alloy on aluminium”.Mater Sc Engg 2005 A405,p306-312.
[17] H.Ghadami,S Hossein Nedjhad,B.Egballi. “Enhanced grain refinement of cast aluminium by thermal and mechanical treatment of Al-5Ti-1B master alloy.” Trans.Nonferrous Met Soc Chaina 23(3013) 1563-1569.
[18] V Abramov,O Abramov,V Bunlga Kov, Fsommer. “solidification of aluminium alloys under ultrasonic irradiation using water cooled resonator”. Materials letters 37 (1998) p27-34 .elseware.
[19] J.L Laborde,A Hita,. “Ultrasonics” 38(2000) P297-300 .Elseware.
[20] L.Zang, D.G Eskin, A Miroux and Katgermanl. “Formation of microstructure in Al-Si alloys under ultrasonic melt treatment”. Light metals,2012,TMS ,P 999-1004.
[21] T.V. Alamanenko etal. “Criteria of grain refinement induced by ultrasonic melt treatment of aluminium alloy containing Zr and Ti”. Matall.Mater Trans.41A(2010),P 2056-2066.
[22] D.G Eskin et al. “Onthe mechanism of grain refinement by ultrasonic treatment in the presence of transition metals”.Light metals. (2010) P607 – 611.
[23] D.G Eskin, L.Zang and L Katgerman. “Influence of ultrasonic melt treatment on the formation of primary intermetallics and related grain refinement in alumium alloys”. J.Master sc. 46,(2011),P5252-5229. [24] Shim Taguchi and Hioshi Yano, :Taguchi’s quality engineering handbook”,
John Wiley and sons.
[25] Ross PJ, “Taguchi’s technique for quality engineering”, McGraw-Hill, (1988).
[26] Park S.H., “Robust design and analysis for quality engineering”, Chapman and Hall (1996).
[27] G. Taguchi, “Introduction to quality engineering”.Asian productivity organization,1990.
[28] Ross PJ, “Taguchi’s technique for quality engineering”, McGraw Hill publications, Newyork.Ny,USA,2nd edition, 1996.
[29] Mintab User manual (Release 13.2), Making data analysis Esier,MINITAB,State college, Pa, USA,2001.
AUTHORS
First Author – Sahadeva G N, M.E., (Ph.D), EPCET Bangalore, [email protected]
Second Author – Dr. A. S. Ravindran, M.E., Ph.D, PNSIT Bangalore.
Third Author – Dr. T Chandrashaker, M.E., Ph.D, VIT Chennai.
Fourth Author - – Dr. H.R.Vitala, M.E., Ph.D, SJBIT Bangalore.
Correspondence Author - Sahadeva G N ,