EVALUATION OF CAST IRON SURFACE ROUGHNESS USING IMAGE
PROCESSING AND MACHINE VISION SYSTEM
N. Nithyanantham1 and P. Suresh2 1Karpagam University, Coimbatore, India
2Department of Mechanical Sciences Karpagam College of Engineering (Autonomous) Coimbatore, Tamilnadu, India E-Mail: [email protected]
ABSTRACT
In recent years, with the beginning of high-speed general-purpose computers and powerful high speed vision systems image analysis have become easier, faster and more flexible. Images of surfaces captured using vision system can be used to identify, analyze and quantify surface texture after the implementation of quality improvement algorithms. Unlike the stylus instruments, the computer vision systems have the advantages of being non-contact and are capable of measuring an area of the surface rather than a single line which makes it a 3D evaluation. In this paper, optical surface roughness parameter 'Ga' has been obtained from an image and is compared with the widely used conventional average surface roughness 'Ra' obtained from the stylus instrument for ground, milled and shaped surfaces.
Keywords: cast iron, image processing, MVS, surface roughness.
INTRODUCTION
Surface texture is an important characteristic for the analysis of many types of images. This is particularly true in the case of mechanical surfaces. An image texture is described by the number and types of its primitives or layout of its primitives. Image texture can be qualitatively evaluated as having one or more of the properties of fineness, coarseness, smoothness, granulation and irregular. A solution to the texture analysis problem will greatly advance the image processing fields and it will also bring much benefit to many applications in the areas of industrial automation and remote sensing.
The measurement of engineering surface roughness is becoming increasingly important [1]. Current techniques of surface measurement use surface profilometers and some optical techniques to estimate the nature of the surfaces. With the advent of automation surface characterization needs to be totally computerized so that the task of inspection (of surfaces) is greatly simplified [2]. Bradley et al. [3] employed a fiber optics
sensor for surface roughness measurement. In their work, changes in the surface topography are manifested as phase changes of the incident and reflected light on the surface. Hisayoshi Sato et al. [4] worked on the estimation of
surface roughness using a scanning electron microscope. They showed that the profile of a surface could be obtained by processing back scattered electron signals which are in proportion to the surface inclination along the electron beam scanning, which meant that the profile of the surface roughness can be derived by integrating the intensity of the back scattered electron signal. Bjuggern et al. [5] developed a total integrated infrared scatterometer
to perform the rms roughness measurements of engineering surfaces. In this paper, a non contact method using computer vision for inspecting surface roughness of components produced using varying manufacturing
processes which include shaping, milling and grinding has been presented. Several investigations have been carried out by earlier researchers to inspect surface roughness of a work piece based on computer vision technology [6, 7]. Gary Wagner [8] described geometric search as the most accurate and appropriate method for improving the quality of images by enhancing the edges in image processing.
Luk et al. [9] utilized statistical parameters, derived from
the grey level intensity histogram such as the range and the mean value of the distribution and correlated them with the Ra value determined from the stylus method. After capturing the images of surfaces using machine vision systems manufactured by various processes including shaping, milling, grinding etc. Kiran et al. [10]
have utilized the grey level intensity histograms etc., for establishing new optical parameters for roughness evaluation. Al-Kindi et al. [11] implemented a technique
utilizing a roughness parameter based on both the spacing between grey level peaks and the number of grey level peaks per unit length of a scanned line in the grey level image to estimate the surface roughness.
Figure-1. Experimental setup.
Experimental Procedure
The basic experimental set-up consists of a vision system (CCD camera: Pulnix -TM6, 512 x 512 pixels, with Image, LC processing hardware with 4 frame buffers and 1/30 s grabbing speed) and an appropriate lighting arrangement shown in Figure-1. Illumination of the specimens was accomplished by a diffuse, white light source which was situated at an angle of approximately 45° incidence with respect to the specimen surface. The experiments were carried out by preparing flat specimens manufactured using different machining processes such as grinding, milling and shaping. Surfaces
with different textures were obtained by controlling the machining parameters of these processes as shown in Tables-1, 2 and 3. Surface images as shown in Figure-3a, 4a and 5a were grabbed using a CCD camera and were then pre-processed to eliminate effects due to illumination and noise.
Geometric Search Technique
In geometric search approach the grayscale patterns in a raw image, particularly the edges are enhanced which are mainly the characteristic features to evaluate the surfaces. Vision challenges such as contrast reversal and intensity gradient that would be daunting to a correlation-based system are no longer the issues because the technique is not only keyed to gray scale values, but also to the position of edges. The surface images of the specimens are grabbed using the CCD camera and are pre-processed to eliminate the effects due to improper illumination and noise. Low pass filter is applied to the image obtained, hence reducing the salt and pepper effect. In this technique, given an input image 'I' with a resolution m x n, the goal is to extract edges and replace the original low quality image with the output image 'O' with the same resolution m x n. Let 'T' denote the list of pixels such that an edge has been detected at T(q), where 'q'
and 5b. The
geometric search technique used is explained using a flow chart shown in Figure-2..
Table-2. Machining parameters used (Shaping) and the corresponding roughness values of the components.
Table-3. Machining parameters used (Grinding) and the corresponding roughness values of the components.
Figure-2. Flowchart for the geometric search technique.
CALCULATION OF OPTICAL SURFACE ROUGHNESS PARAMETER
Figure-3(a). : Image of shaped surface (a) Before applying geometric search (Ga=20.321).
Figure-3(b). Image of shaped surface After applying geometric search. (Ga=18.986).
Figure-4(a).Image of milled surface before applying geometric search (Ga=22.14).
Figure-4(b). Image of milled surface After applying geometric search. (Ga=20.467).
Figure-5(a). Image of ground surface before applying geometric search (Ga=7.89).
Figure-6(a). Correlation of estimated roughness values (Ground surfaces) using vision approach and stylus
approach (Ra) , Before applying geometric search.
Figure-6(b). Correlation of estimated roughness values (ground surfaces) using vision approach and stylus
approach (Ra) , After applying geometric search.
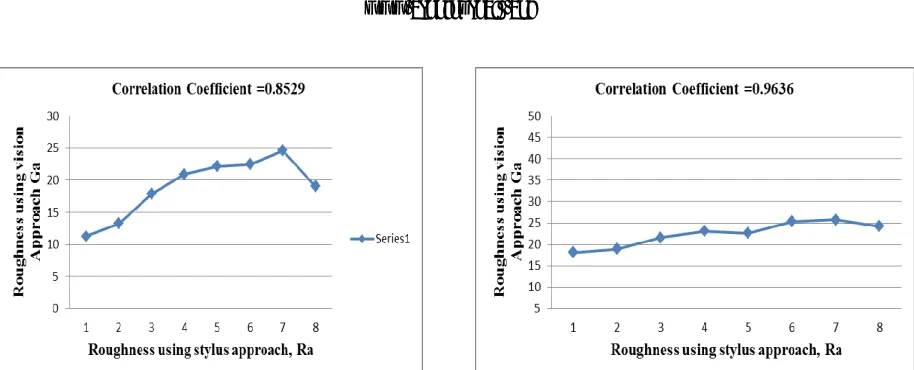
Figure-7(a). Correlation of estimated roughness values (milled surfaces) using vision approach and stylus approach (Ra) , Before applying geometric search.
Figure-7(b). Correlation of estimated roughness values (Milled surfaces) using vision approach and stylus
approach (Ra),After applying geometric search.
Figure-8(a). Correlation of estimated roughness values (ground surfaces) using vision approach and stylus
approach (Ra), Before applying geometric search technique.
[image:5.612.80.537.82.267.2] [image:5.612.77.538.86.703.2] [image:5.612.75.291.524.689.2]DISCUSSION OF RESULTS
Roughness measurements were performed on a mild steel specimens manufactured by shaping, milling and grinding processes and their values are presented in Tables-1, 2 and 3. After preprocessing initially using low pass filter, the geometric search technique is applied to enhance further the quality of images. A set of values of Ga values before and after applying geometric search technique was obtained. These were plotted against Ra obtained from the stylus instrument. A curve of best fit was obtained to show the trend as shown in Figure-6, 7 and 8. It was observed that the Ga after applying geometric search technique have a good correlation with Ra. This clearly indicates that the Ga of the image intensities after applying geometric search technique could be used as a roughness parameter for evaluation.
CONCLUSIONS
The present work clearly indicates that the Machine vision approach can be used to evaluate the surface roughness of machined surfaces and it is established as well that there is a good linear relationship between Ra and Ga with a high level of accuracy. The calculation of Ga, optical roughness value, after applying geometric search technique had a better correlation (i.e. higher correlation coefficient) with the average surface roughness (Ra) measured using a conventional and widely accepted stylus type instrument for the components manufactured particularly using shaping, milling and grinding processes, indicating its effectiveness in quantification of surface roughness using machine vision. The manufactured surfaces using shaping, milling and grinding with a surface finish range of Ra, 0.3 to 30 μm are evaluated in this work for their surface quality using a machine vision system using a parameter Ga. The Ra values only are calibrated using standard specimens using the stylus instrument. But, it is to be mentioned in particular that Ga has excellent correlation with Ra in most of the cases.
REFERENCES
[1] R. Broadmann and G. Thun, Optical RoughnessMeasuring Instrument for Fine Machined Surfaces,Opt.Eng., 24 (1985) 408-413.
[2] S. Damodarasamy and S. Raman, Texture Analysis Using Computer Vision, Computers in Industry 16 (1991) 25-34.
[3] C. Bradley, J. Bohlmann and S. Kurada, A FiberOptic Sensor for Surface Roughness Measurement, Journal of Manufacturing Science and Engineering 120 (1998) 359-367.
[4] Hisyoshi Sato and Masanori O-Hori, Surface Roughness Measurement by Scanning Electron Microscope, Annals of CIRP 31 (1982) 457-462.
[5] Mans Bjuggren, Laurent Krummenacher and Lars Mattsson, Non Contact Surface Roughness Measurement of Engineering Surface by Total Integrated Infrared Scattering", Precision engineering 20 (1997) 33-45.
[6] B. Ramamoorthy and V. Radhakrishnan,Statistical Approaches to Surface Texture Classification, International Journal of Wear 167 (1993) 155-161.
[7] E.S. Gadelmawla, M.M..Koura and H.H. Soliman Extraction of Roughness Properties from Captured Images of Surfaces , IMechE. 215 (2001) 555- 564.
[8] G. Wagner, Geometric search : Accurate Machine Vision in Challenging Conditions, The Images Report Autumn (2000) 32-33.
[9] F. Luk, V. Hyunh and W. North, Measurement of Surface Roughness by a Machine Vision System, Journal of Physics E Scientific Instruments 22 (1989) 977-980.
[10] M.B. Kiran, B. Ramamoorthy and V.Radhakrishnan Evaluation of Surface Roughness by Vision System, Int.J. of Machine Tools & Manufacture 38 (1998) 685-690.
[11] G.A. Al-Kindi, R.M. Baul and K.F. Gill, An Application of Machine Vision in the Automated Inspection of Engineering Surfaces, International Journal of Production Research 2 (1992) 241-253.
[12] Rajneesh Kumar, P. Kulashekar, B. Dhanasekar and B. Ramamoorthy, Application of Digital Magnification for Surface Roughness Evaluation Using Machine Vision, International Journal of Machine Tool and Manufacture 45 (2005) 228- 234.
[13] M.A.Younis, On Line Surface Roughness Measurements Using Image Processing Towards an Adaptive Control, Computers Ind. Engg. 35 (1998) 49-52.