Georgia State University
ScholarWorks @ Georgia State University
Public Health Theses School of Public Health
Spring 5-11-2018
Evaluating Hand Hygiene Compliance Among
Healthcare Workers in a Specialized Pediatric
Hospital
Abigail Monteiro
Follow this and additional works at:https://scholarworks.gsu.edu/iph_theses
This Thesis is brought to you for free and open access by the School of Public Health at ScholarWorks @ Georgia State University. It has been accepted for inclusion in Public Health Theses by an authorized administrator of ScholarWorks @ Georgia State University. For more information, please contact [email protected].
Recommended Citation
Monteiro, Abigail, "Evaluating Hand Hygiene Compliance Among Healthcare Workers in a Specialized Pediatric Hospital." Thesis, Georgia State University, 2018.
ABSTRACT
EVALUATING HAND HYGIENE COMPLIANCE AMONG HEALTHCARE WORKERS IN A SPECIALIZED PEDIATRIC HOSPITAL
By
ABIGAIL MONTEIRO
APRIL 6,2018
INTRODUCTION: Hand hygiene(HH) is an important prevention measure for reducing healthcare-associated infections(HAIs), but adherence to HH compliance is suboptimal by healthcare workers(HCWs).
AIM:The aim of this study was to measure the adherence of HH compliance of HCWs and to
identify hindrances in non-compliance in a specialized care pediatric hospital in the United States.
METHODS: An observational study of compliance of HH practices among HCWs using the direct observation method was conducted over a two-month period in 2017 at two campuses of a pediatric hospital, by one trained observer. HH opportunities were defined by the World
Health Organization’s“Five Moments for Hand Hygiene” and the Clean-in and Clean-out
Campaign.
RESULTS: A total of 2236 HH opportunities were observed during the two-month period with a compliance of 75%. HH compliance for both hospitals campuses differed upon entry and exit. Compliance did not vary significantly among hospital units and HCWs. Three barriers to HH compliance by HCWs appeared to be the most frequent; improper use of gloves, frequent entry and exit, and hands full with supplies.
DISCUSSION:The overall HH compliance among HCWs in the study was 76%, which exceeds the
EVALUATING HAND HYGIENE COMPLIANCE AMONG HEALTHCARE WORKERS IN A SPECIALIZED PEDIATRIC HOSPITAL
by
ABIGAIL MONTEIRO
B.S., GEORGIA STATE UNIVERSITY
A Thesis Submitted to the Graduate Faculty of Georgia State University in Partial Fulfillment
of the
Requirements for the Degree
MASTER OF PUBLIC HEALTH
APPROVAL PAGE
EVALUATING HAND HYGIENE COMPLIANCE AMONG HEALTHCARE WORKERS IN A SPECIALIZED PEDIATRIC HOSPITAL
by
ABIGAIL MONTEIRO
Approved:
Dr. Christine Stauber Committee Chair
Dr. Lisa Casanova Committee Member
Cary Hilbert Hansen, PhD Committee Member
ACKNOWLEDGMENTS
I would like to sincerely thank my thesis advisors Dr. Christine Stauber and Dr. Lisa Casanova for their continued guidance and patience throughout the development of my thesis. To my
preceptor Cary Hilbert, thank you for allowing me to work on this project and providing me with your support and input in this process. I could not have asked for a better committee; without your help this thesis would not have been possible. I would also like to thank my family, friends, and Alex for their unwavering love and encouragement throughout this process and for
AUTHORS’S STATEMENT PAGE
In presenting this thesis as a partial fulfillment of the requirements for an advanced degree from Georgia State University, I agree that the Library of the University shall make it available for inspection and circulation in accordance with its regulations governing materials of this type. I agree that permission to quote from, to copy from, or to publish this thesis may be granted by the author or, in his/her absence, by the professor under whose direction it was written, or in his/her absence, by the Associate Dean, School of Public Health. Such quoting, copying, or publishing must be solely for scholarly purposes and will not involve potential financial gain. It is understood that any copying from or publication of this dissertation which involves potential financial gain will not be allowed without written permission of the author.
TABLE OF CONTENTS
ACKNOWLEDGMENTS ...4
LIST OF TABLES………...7
LIST OF FIGURES………...8
INTRODUCTION...9
1.1 Background……….………...9
1.2 Definitions Related to HH………10
1.3 Purpose of the study………11
LITERATURE REVIEW...13
2.1Healthcare-associated infections and the impact it has in the pediatric population…...13
2.2Barriers to Hand Hygiene………...15
2.3Assessing various methodologies for Hand Hygiene measurement……….15
METHODS………...18
3.1 Study Design & Data Collection………. 18
3.2 Data Analysis...21
RESULTS...23
4.1 Overall HH Compliance among both hospitals……….………...23
4.2 HH compliance by Hospital A………...25
4.3 HH compliance by Hospital B...27
4.4 HH compliance by Hospital A PICU unit...29
4.5 HH compliance by Hospital B PICU unit...29
4.6 Barriers to HH...32
DISCUSSION AND CONCLUSION...34
5.1 Discussion of Research Questions...34
5.2 Study Strengths and Limitations...35
5.3 Implications of Findings...35
5.4 Recommendations and Prevention Strategies……….…………...38
5.5 Conclusions………38
LIST OF TABLES
Table 1. Distribution of Hand hygiene Compliance for both Hospital Campus………24
Table 2. Hand Hygiene Compliance for Hospital A………..26
Table 3. Hand Hygiene Compliance for Hospital A, Examined by Unit and Unit Size………..26
Table 4. Hand Hygiene Compliance for Hospital B………..28
Table 5. Hand Hygiene Compliance for Hospital B, Examined by Unit and Unit Size………..28
Table 6. Hospital Unit PICU for Hospital A (N=386) ………30
Table 7. Hospital Unit PICU for Hospital B (N=281) ………31
LIST OF FIGURES
Evaluating Hand Hygiene Compliance Among Healthcare Workers in a Specialized Pediatric Hospital
Introduction
Healthcare-associated infections (HAI’s) are recognized as the root cause of increased morbidity, mortality, and escalating healthcare costs. HAIs can result in prolonged hospital stays, higher readmission rates, and can ultimately pose a significant risk to patient safety (WHO, 2011). According to a report by the Centers for Disease Control and Prevention (CDC) in 2011, hospital patients acquire an estimated 722,000 infections each year in the United States, which is about 1 infection for every 25 patients (CDC, 2016). The most vulnerable group to these HAIs is hospitalized infants and children. Young infants and children are susceptible to many infections because they have not yet fully developed their immune systems. Also, their behavioral characteristics such as incontinence, inadequate hygiene, frequent mouthing of hands, objects, and drooling facilitate the spread of infection (Moore, 2001). Patients can be exposed to a variety of microorganisms (bacteria, viruses, fungi and, parasites) during hospitalization. Some of the most common sources of infectious agents that could potentially be a source of HAI’s is
the patient itself, contaminated medical equipment, surrounding hospital environment, healthcare personnel, etc. (Collins, 2008).
healthcare workers’ hands (Chavali, 2016). “On average, healthcare providers clean their hands
less than half the number of times they should” (CDC, 2017). Increasing hand hygiene has been shown to markedly reduce infections rates and considerably reduce the cross-transmission of multidrug-resistant pathogens (WHO, 2014). While hand hygiene has been proven to be a major infection control prevention approach, hand hygiene compliance remains alarmingly low, in the range of 30% to 50% (Boyce, 1999). Hand hygiene compliance levels are considered excellent at 90% or higher (WHO, 2014). It is believed that non-compliance by healthcare workers is triggered by inadequate time, heavy workloads, lack of education, and overall skepticism about hand hygiene as a preventative practice (Pittet, 2001). The challenge is to sustain high
compliance rates among healthcare workers who directly work with patients and their immediate environments.
There are several different methods of measuring hand hygiene performance, such as direct observation of performances, conducting surveys using self-report of hand hygiene performance measuring product use and more recently using video and electronic surveillance monitoring systems. However, direct observation is the gold standard for measuring hand
hygiene compliance. This approach is favored by the World Health Organization(WHO) as it can detect all hand hygiene opportunities, known as the “Five Moments for Hand Hygiene” (WHO,
2009). This method provides observers with quantitative and qualitative information to help identify barriers to compliance. The five moments for hand hygiene emphasizes hand hygiene before touching a patient, before clean/aseptic procedures, after body fluid exposure risk, after
touching a patient, and after touching patient surroundings. Another movement that also
identifies appropriate hand hygiene is the Clean-in and Clean-out Campaign, which asks all
exit a patient’s room. The act of performing adequate hand hygiene is extremely important and is
measured by CDC’s recommended technique for using alcohol-based hand sanitizer and washing
hands with soap and water. With alcohol-based hand sanitizer, each healthcare worker should
perform adequate hand hygiene by putting the product on the hand and covering all surfaces of
hands until dry with the recommended time of 20 seconds. With washing hands with soap and water, the technique is to wet hands first and then to apply the product to hands, rubbing hands
vigorously for 15-20 seconds, covering all surfaces of the hands and fingers then rinsing hands with water and using disposable towels to dry and to turn off faucet.
Although the direct observation method of hand hygiene compliance is the standard practice, it is also subjected to biases such as the Hawthorne effect and interobserver variation (Guanche, 2017). The Hawthorne effect, also known as observer effect, refers to the tendency of people being observed in a research setting to alter their behavior from the way they would otherwise (Srigley, 2014). In this case, when a healthcare worker realizes that they are under observation, hand hygiene performance usually improves. Observer and selection bias can be minimized by validated observers, randomly choosing hospital units, healthcare workers and assessing compliance at various time points (Karaaslan, 2014).
While there have been several studies focused on healthcare worker’s compliance and
barriers, there are a lack of studies and attention relating to hand hygiene compliance in a pediatric hospital setting. This gap in the literature is surprising, children have developing immune systems and there is an overall lack of personal hygiene when they encounter physical contact with their peers, which can likely lead children to succumb to acute respiratory infections and gastrointestinal problems (Randle, 2013). Due to the limited studies on hand hygiene
Literature Review
I. Healthcare-associated infections and the impact it has in the pediatric population
Defined by CDC, HAI’s are infection(s) that develops during hospitalization and after 48 hours or more following admission or within 10 days after being discharged following patient care (Collins, 2008). This new onset of the infection is unrelated to the illness that initially brought the patient into the hospital. HAI’s occur in both adult and pediatric patients, however, bloodstream infections, viral lower respiratory tract infections such as pneumonia and urinary tract infections are the more prevalent HAI’s associated with the pediatric age groups (Revelas,
2012). Amongst the pediatric population, infants with extremely low birth weight <1000 grams, children younger than 1 year and children in either the PICU or NICU have higher rates of HAIs (Revelas, 2012).
HAI’s are most commonly caused by viral, bacterial, and fungal pathogens (Collins,
2008). During hospitalization, patients can be exposed to a variety of exogenous microorganisms through healthcare workers, visitors and via patient’s own normal flora, which can harbor
residual bacteria on the skin, mucosal membranes, gastrointestinal tract, or respiratory tract and may become invasive after surgical procedures or after the insertion of devices/catheters.
equipment, and medications). Based on a scientific review of 1,022 outbreak investigations, the most common sources of infectious agents causing HAI’s, are the individual patient, medical
equipment or devices, the hospital environment, the healthcare personnel, contaminated drugs, contaminated food, and contaminated patient care equipment (Gastmeier, 2005). Among patients and healthcare personnel, microorganisms are transmitted to others by indirect contact via staff hands because hand hygiene is neglected or performed inadequately (Hans, 2012). Airborne spread is also another frequent mode of transmission; this is when small-particle-size
microorganisms remain suspended in the air for long periods of time, they can spread to other people (Collins, 2008). The CDC has described an approach to reduce transmission of
microorganisms through airborne spread by proper use of personal protective equipment (e.g., gloves, masks, gowns), aseptic technique, hand hygiene, and environmental infection control measures are primary methods to protect the patient from transmission of microorganisms from other patients and most importantly from healthcare worker (Collins, 2008).
There is a varying vulnerability in which patients can acquire an infection after exposure to an infectious organism. Patients who are immunocompromised due to age such as neonates and children have an increased likelihood of infection and susceptibility of pathogenic organisms due to their underlying disease condition, the severity of illness, immunosuppressive
medications, or medical/surgical treatments (Collins, 2008). HAI’s result in a prolonged length of stay, mortality and healthcare costs. In 2002, there were an estimated 1.7 million healthcare-associated infections occurred in the United States which resulted in 99,000 deaths
II. Barriers to hand hygiene
There have been several reported barriers to appropriate hand hygiene. Some of the main reasons reported by health-care workers for the lack of adherence with hand hygiene
recommendations include skin irritation, insufficient time, high workload, understaffed, high priority of patient needs, wearing gloves, forgetfulness, ignorance and disagreement with guidelines and protocols, inaccessible supplies, and lack of education on appropriate hand hygiene and scientific information demonstrating impact of improved hand hygiene on hospital infection rates, inconveniently located numbers of sinks; low risk for acquiring infection from patients and belief that glove use obviates need for hand hygiene (Pittet, 2001).
There is a perceived thought that wearing gloves might represent a barrier for compliance with hand hygiene, however, failure to remove gloves after patient contact or between dirty and clean body site care for the same patient constitutes noncompliance with the recommendations. The act of washing or reusing gloves between patient contact is ineffective, and handwashing or disinfection should be strongly encouraged after glove removal (Pittet, 2001).
III. Assessing various methodologies for hand hygiene measurement
The three main methods for measuring hand hygiene performance include measuring product use, conducting surveys and direct observation. Each method has its own advantages and disadvantages yet using more than one method to measure hand hygiene compliance can likely generate more reliable results than using one single method (The Joint Commission, 2009).
towels used in each area of the organization. This method is less expensive than observing healthcare workers directly and does not require as many staff members or as much training as the direct observation method (The Joint Commission, 2009). Measuring product use can be done at any time and in any place, and it permits the tracking of trends in the organization over time. Since measuring product use is discreet, it is less likely than the direct observation method to influence healthcare workers to change their hand hygiene behavior (The Joint Commission, 2009). Some disadvantages of this method are that measuring product use does not reveal
whether healthcare workers are performing hand hygiene when it is indicated or whether they are performing it appropriately. This method does not generate any contextual information about when or why hand hygiene guidelines are not adhered to, and it often does not tell you who is or is not practicing hand hygiene (The Joint Commission, 2009). Furthermore, there are many elements make this measurement method prone to inaccuracy, including product waste or spillage, product use by patients and family members, and the borrowing of product between units (The Joint Commission, 2009).
Another indirect method of measuring hand hygiene is surveying healthcare workers, patients, and family members. These surveys can be conducted in person, over the telephone, electronically, on paper, through in-person interviews and focus groups which can yield
information about perceptions, attitudes, and behavior related to hand hygiene. Through surveys, health care workers reveal what they know and think about hand hygiene as well as why they adhere (or do not adhere) to guidelines (The Joint Commission, 2009). Surveys can reveal whether health care workers’ perceptions of their own hand hygiene behavior match the
guidelines when questioned and may inaccurately recall their past hand hygiene behavior (The Joint Commission, 2009). Using a well-designed and carefully administered survey whose validity and reliability have been established can help you achieve the most accurate results possible (The Joint Commission, 2009).
Direct observation, considered the gold standard of measurement according to the WHO, involves directly watching and recording hand hygiene behavior of healthcare workers and the physical environment. This direct method is the only way to assess the various aspects of hand hygiene such as observing the hand hygiene method that was used, the thoroughness of cleaning one’s hands and the use of gloves. Most importantly it gives a visual to see the discipline of
healthcare workers performing hand hygiene staff are performing hand hygiene when there is an opportunity to do so (The Joint Commission, 2009). These observations also create an
opportunity to provide prompt feedback when improvement is deemed necessary. It can also provide quantitative and qualitative information about when and why noncompliance in hand hygiene occurs (The Joint Commission, 2009). Conversely, there are also limitations of the direct observation method. It can be labor-intensive and expensive and it requires the careful selection and training of those who will observe and record data (The Joint Commission, 2009). One of the biggest disadvantages of this method is that it can influence the behavior of those who know they are being observed (Hawthorne effect). This method requires strict guidelines in order to be successful such as who is going to be observed; who will conduct the observations; and when, where, and how often to observe the practice (The Joint Commission, 2009). The success of this method also depends on the accurate calculation of adherence rates and the careful
and appropriate timing when hand hygiene action would be required in the sequence of care (WHO, 2009)
Methods
Study Design & Data Collection
The study of compliance of hand hygiene practices among healthcare workers was
conducted over a two-month period in the Summer of June 2017 to the beginning of August
2017 at a pediatric hospital located in Metropolitan Atlanta, Georgia. Approved by the
Institutional Review Board, study number H18259, to use secondary de-identified data of covert
observations at two hospital campuses, by one trained observer. Hand hygiene surveillance performed at the first campus (Hospital A) included four intensive care units, four general patient care floors, and one other specialty care unit. Similarly, observations were also performed at the second campus (Hospital B) which is comprised of five intensive care units, four general patient care floors, and a specialty care unit.
The healthcare workers that were observed included physicians/residents/physician assistant’s/nurse practitioner, nurses, allied health workers, techs, nursing/respiratory students,
observation periods per day for the entire 2-month period. In total there were 2237 individuals
observed during this two-month period, 1229 audits in hospital A and 1007 audits in hospital B.
The observer was trained to identify appropriate hand hygiene opportunities defined by the WHO’s “Five moments for hand hygiene” and the Clean-in and Clean-out Campaign. The unit of observation was an opportunity for hand hygiene, defined as both before (one
opportunity) or after (another opportunity) any contact with a patient or with an inanimate object inside the patient's room. For each opportunity, a type of hygiene such as handwashing, hand
disinfection, glove change alone (without later hygiene), or no action and the timing of the activity (opportunity prior to or after an activity) were collected. Hand hygiene performance was not recorded or differentiated based on the type of washing, alcohol-based hand cleaner or soap
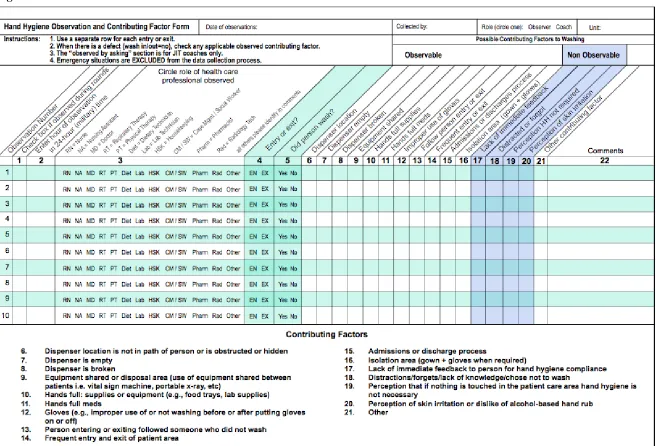
and water. Using the Joint Commission Center for Transforming Healthcare hand hygiene targeted solutions tool, the compliance of healthcare workers was recorded. The data collection
tool displayed in Figure 1. illustrates where the observer can note which healthcare workers were being observed and whether hand hygiene was performed on entry or exit. If a compliance
opportunity was missed, a list of observable reasons can be recorded along with a comment
section to note details of the observation being examined. Only the observable contributing
factors section to washing was used for this study and the variables to non-compliance (missed
• Hands full of supplies: Hand hygiene was not performed due to healthcare
provider’s hands being full of supplies or equipment (e.g., food trays, lab
supplies)
• Frequent entry and exit: Frequent entry and exit of patient care area without
performing hand hygiene.
• Improper use of gloves: Healthcare provider did not wash hands before putting
on gloves or after taking gloves off.
• Isolation area (gown + gloves): Prior to entering or exiting the isolation patient
care area, the healthcare provider did not wash hands before or after putting on personal protective equipment (e.g., gloves or gowns, when required).
• Hands full of meds: Healthcare provider’s hands are full of medications. • Equipment shared: Healthcare provider did not wash hands due to the use of
shared equipment between patients (e.g., vital sign machine, portable x-ray, etc.). • Admissions or discharge process: Lack of streamlined admission or discharge
process led to unnecessary, frequent entry or exit o the patient care area by the health care provider.
• Follow person entry or exit: Healthcare providers entering or exiting the patient
care area followed someone who did not wash hands.
• Dispenser broken: The alcohol-based hand-rub dispenser(s) accessible to the
observed health care provider is broken or not functional.
• Dispenser empty: The alcohol-based hand-rub dispenser(s) accessible to the
• Dispenser location: The alcohol-based hand-rub dispenser(s) is not optimally
located in the path of the health care provider’s workflow, and/or the access to
the dispensers are either obstructed or hidden.
This same practice was followed thoroughly throughout the course of two months.
Data Analysis
All the secondary, de-identified data observed and collected using the tool was entered
into the hospitals electronic data capture system (REDcap). Access to the hand hygiene
compliance database system was granted in order to analyze hand hygiene compliance for this
study. The Institutional Review Board(IRB) approved the study and the analysis was exempt
from IRB since there was no identifying information.
All the observations from each day were summarized and each observable missed
Results
Overall HH Compliance among both hospitals
In the two-month data collection period, a total of 2236 hand hygiene opportunities were collected from hospital A and hospital B from each of the hospital’s main wards, the intensive
care units (ICU’s) and general care areas. Overall hand hygiene compliance among both the hospitals was approximately 76% (Table 1). Hand hygiene compliance among the healthcare worker role ranged from a low 56% (for dietary workers) to an above average 86% (for physical/occupational therapists). Since there was such varying compliance among healthcare workers, the roles were further examined by grouping into those who had direct patient contact and those who did not have direct patient contact. When examining healthcare workers by categories and hand hygiene compliance, there was no statistical significance between those who had direct contact 75.8% (1535 of 2025) versus those who had indirect contact 74.4% (157 of 211) (p =0.6734). However, compliance differed by healthcare worker role as follows: physical therapist/occupational therapist had the highest compliance of 86%, EVS workers 80.6%,
physicians/residents/PA/NP 80.3%, techs 76.7%, Nurses 76.3%, ancillary workers and other staff 75%, radiology 67%, respiratory therapists 65.2% and the lowest compliant group, dietary
workers 56%.
Table 1. Distribution of Hand hygiene Compliance for both Hospital Campus Percent HH Compliance
N (%)
P-Value
Hospital Campuses 0.0749
Hospital A 948/1229 (77.1%)
Hospital B 744/1007 (73.9%)
Total 1692/2236 (75.7%)
Entering or Exiting <.0001
Exit 890/1076 (82.7%)
Entry 802/1160 (69.1%)
Hospital Units 0.0453
General Care 515/656 (78.5%)
ICU 1177/1580 (74.5%)
Role of HCW’s 0.6734
Direct Care HCW’s 1535/2025(75.8%)
Physical Therapist (PT)/Occupational Therapist (OT)
43/50 (86%) Physician/Resident/Physician Assistant
(PA)/ Nurse Practitioner (NP)
331/412 (80.3%)
Nurse 908/1190 (76.3%)
Tech 66/86 (76.7%)
Respiratory Therapist 187/287 (65.2%)
Indirect Care HCW’s 157/211(74.4%)
EVS 79/98 (80.6%)
Ancillary & Other Staff 48/64 (75%)
Radiology 16/24 (66.7%)
Dietary 14/25 (56%)
HH compliance by Hospital A
The hand hygiene compliance for Hospital A was 77.1% with a total of 1229
observations collected. Compliance among the role of healthcare workers ranged from 60% to 87%. However, there was no statistically significant difference between compliance among healthcare workers that had direct patient contact 77.3% (841 of 1088) versus those who had indirect patient contact 75.9% (207 of 242) (Table 2).
However, there was variability among the nine healthcare worker groups examined and their compliance differed as follows; EVS workers 87.5%, Physicians/PA/NP 84.5%, physical therapists/occupational therapists 80.8%, nurses 78.3%, techs 77.6%, ancillary workers and other staff 73.5%, respiratory therapists 66.7%, dietary workers 62.5% and the lowest compliant group, radiology staff workers at 60%.
Conversely, in examining hand hygiene opportunities in regards to entry and exit, there was a substantial compliance difference (p <.0001). With an approximate 12% difference, compliance when entering a patient’s room was remarkably lower at 71.6% than when exiting a patient’s room at 83.5%. Assessing the relationship between hospital units and hand hygiene,
Table 2. Hand Hygiene Compliance for Hospital A
Percent HH Compliance N (%)
P-value
Entering or Exiting <.0001
Exit 480/575 (83.5%)
Entry 468/654 (71.6%)
Hospital Units 0.4234
General Care 309/393 (78.6%)
ICU’s 639/836 (76.4%)
Role of HCW’s 0.7492
Direct Care HCW’s 841/1088(77.3%)
Physician/PA/NP 136/161 (84.5%)
PT/OT 21/26 (80.8%)
Nurse 519/663 (78.3%)
Tech 45/58 (77.6%)
Respiratory Therapist 120/180 (66.7%)
Indirect Care HCW’s 107/141(75.9%)
Ancillary & Other Staff 36/49 (73.5%)
EVS 49/56 (87.5%)
Dietary 10/16 (62.5%)
Radiology 12/20 (60%)
* p-value is significant at the level 0.05
Table 3. Hand Hygiene Compliance for Hospital a Examined by Unit and Unit Size Hospital Units Room Type Number of
beds in each unit
Total number of observations in each unit Percent HH compliance by each unit ICU
PICU Single Room 38 386 79.8%
NICU Bay room/Single room 35 203 74.9%
TICU Single Room 11 166 72.9%
CIRU Single Room 29 81 71.6%
General Care
PCA 1 Single Room 22 76 81.6%
PCA 2 Single Room 35 72 72.2%
PCA 3 Single Room 35 89 79.8%
PCA 4 Single Room 65 137 78.8%
[image:27.612.68.550.488.689.2]HH compliance by Hospital B
Hand hygiene compliance for Hospital B was approximately 74% with a total of 1007 observations collected. Compliance among the role of healthcare workers ranged from 44% to 100%. However, there was no statistical significance in comparing hand hygiene compliance among healthcare workers that had direct patient contact 74% (694 of 937) versus those who had indirect patient contact 71.4% (50 of 70) (Table 4). Among the healthcare worker groups
examined, there was variability by healthcare worker role as follows: radiology staff workers at 100%, physical therapists/occupational therapists 91.7%, ancillary workers and other staff 80%, physician/residents/NP 77.7%, Techs 75%, Nurses 73.8%, EVS workers 71.4%, respiratory therapists 62.6%, and the lowest compliant group, dietary workers at 44.4%.
Similar to Hospital A, when examining the hand hygiene opportunities in regards to entry and exit, there was also a substantial compliance difference (p <.0001). With an approximate 16% difference, compliance when entering a patient’s room was significantly lower at 66% than when exiting a patient’s room at 81.8%. Assessing the relationship between hospital units and
Table 4. Hand Hygiene Compliance for Hospital B Percent HH Compliance
N (%)
P-value
Entering or Exiting <.0001
Exit 410/501 (81.8%)
Entry 334/506 (66%)
Hospital Units 0.0604
General Care 206/263 (78.3%)
ICU’s 538/744 (72.3%)
Role of HCW’s 0.6722
Direct Care HCW’s 694/937(74%)
PT/OT 22/24 (91.7%)
Physician/Resident/NP 195/251 (77.7%)
Tech 21/28 (75%)
Nurse 389/527 (73.8%)
Respiratory Therapist 67/107 (62.6%)
Indirect Care HCW’s 50/70(71.4%)
Radiology 4/4(100%)
Ancillary & Other Staff 12/15 (80%)
EVS 30/42 (71.4%)
Dietary 4/9 (44.4%)
* p-value is significant at the level 0.05
Table 5. Hand Hygiene Compliance for Hospital B Examined by Unit and Unit Size Hospital Units Room Type Number of
beds in each unit
Total number of observations in each unit Percent HH compliance by each units ICU
PICU Single Room 36 281 58.7%
NICU Bay room/Single room 45 59 86.4%
TICU Single Room 10 81 88.9%
CICU Bay room/Single room 27 166 69.3%
CSU Single Room 27 157 86%
General Care
4 East Single Room 28 73 76.7%
4 West Single Room 17 66 78.8%
5 East Single Room 32 73 80.8%
5 West Single Room 18 35 80%
[image:29.612.69.551.478.694.2]HH compliance by Hospital A PICU unit
A total of 386 hand hygiene observations were recorded from the PICU from Hospital A. The total compliance with this unit was approximately 80% (308 opportunities taken, out of 386). Also presenting similar results when examining entry and exit variable, compliance rates with hand hygiene procedures was substantially different among entry/exit (p = 0.0014). Performing hand hygiene after exiting a patient’s room had higher compliance rates (86.4%)
compared to when entering a patient’s room (73.8%). (Table 6). Compliance among the role of healthcare workers ranged from 36.4% to 100%. However, there was no statistical significance (p = 0.0745) in comparing hand hygiene compliance among healthcare workers that had direct patient contact 80.9% (285 of 352) versus those who had indirect patient contact 67.6% (23 of 34). Among the healthcare worker groups examined, there was variability by healthcare worker role as follows: physical therapists/occupational therapists and ancillary workers and other staff 100%, tech 94.4%, nurses 80.4%, physicians/PA/NP 79.7%, respiratory therapists 79.5%, EVS workers 75%, dietary workers 50% and the lowest compliant group, radiology staff at 36.4%. There were four barriers to hand hygiene compliance that were examined in this unit. Improper use of gloves (39 of 386), frequent entry and exit (21 of 386), isolation area (14 of 386) and hands full of supplies (10 of 386).
HH compliance by Hospital B PICU unit
54.2% to 100%. However, there was no statistical significance (p = 0.1657) in comparing hand hygiene compliance among healthcare workers that had direct patient contact 58% (154 of 267) versus those who had indirect patient contact 83%(15 of 18). Among the healthcare worker groups examined, there was variability by healthcare worker role as follows: physical
therapists/occupational therapists, ancillary workers and other staff, techs, radiology staff 100%, EVS 75%, physicians/residents/NP 64.1%, dietary worker 60%, respiratory therapists 56.5% and the lowest compliant group, nurses at 54.2%. There were five barriers to hand hygiene
[image:31.612.73.486.362.700.2]compliance observed in this unit. Frequent entry and exit (51 of 281), improper use of gloves (39 of 281), hands full of supplies (16 of 281), isolation area (11 of 281) and hand full of meds (3 of 281)
Table 6. Hospital Unit PICU for Hospital A (N=386)
Percent HH Compliance HH opportunities/N (%)
P-Value
HH Compliance
PICU 308/386(79.8%)
Entry/Exit 0.0014
Entry 155/210 (73.8%)
Exit 152/176 (86.4%)
Role of HCW’s 0.0745
Direct Care HCW’s 285/352(80.9%)
Nurses 160/199(80.4%)
Respiratory Therapist 58/73(79.5%)
MD/PA/NP 47/59(79.7%)
Tech 17/18 (94.4%)
PT/OT 3/3(100%)
Indirect Care HCW’s 23/34(67.6%)
Radiology 4/11(36.4%)
Ancillary & Other Staff 11/11(100%)
EVS 6/8(75%)
Dietary 2/4(50%)
Barriers to HH Compliance Missed HH Opportunities
Improper Use of gloves 39/386(10.1%)
Frequent Entry or Exit 21/386(5.4%)
Isolation Area (gown + gloves) 14/386(3.6%)
Table 7. Hospital Unit PICU for Hospital B (N=281)
Percent HH Compliance HH opportunities/N (%)
P-Value
HH Compliance
PICU 165/281(58.7%)
Entry/Exit 0.0024
Entry 76/151 (50.3%)
Exit 89/130(68.5%)
Role of HCW’s 0.1657
Direct Care HCW’s 154/267(58%)
Tech 2/2 (100%)
PT/OT 2/2(100%)
MD/Residents/NP 41/64(64.1%)
Respiratory Therapist 26/46(56.5%)
Nurses 83/153(54.2%)
Indirect Care HCW’s 15/18(83%)
Ancillary & Other Staff 5/5(100%)
Radiology 4/4(100%)
EVS 3/4(75%)
Dietary 3/5(60%)
Barriers to HH Compliance Missed HH Opportunities
Frequent Entry or Exit 51/281(18.2%)
Improper Use of gloves 39/281(13.9%)
Hands full of Supplies 16/281(5.7%)
Isolation Area (gown + gloves) 11/281(3.9%)
Hands full of Meds 3/281 (1.1%)
Barriers to HH
Among all the hand hygiene opportunities that were recorded and identified, there were 544 missed opportunities that were detected, from which barriers to hand hygiene were acknowledged. From all of the observable barriers listed on the Joint Commission Center for Transforming Healthcare hand hygiene targeted solutions tool, only 6 barriers for non-compliance were recorded. Based on the analysis, it appeared that healthcare workers appeared to be less compliant with performing hand hygiene when gloves were improperly used, frequently entering and exiting a patient’s room and when their hands were full with supplies (Table 8). The other 3
barriers, isolation area (gown and gloves), equipment shared and hand full of meds, were also reported in the healthcare worker’s non-compliance; however, the these barriers were less
frequently observed.
Table 8. Barriers to Hand Hygiene Compliance by HCW (N=544) Observable
Barriers
Definition Role of HCW Non-Compliant Total
N (%)
Improper Use of gloves
No HH before or after putting on gloves Direct Nurse Physician/Resident/PA/NP Respiratory Therapist PT/OT Tech Indirect EVS
Ancillary & Other staff Dietary Radiology 220 121 58 34 6 1 35 15 9 6 5 255 (46.9%) Frequent Entry or Exit
Frequently entering or exiting a patients room without HH
Direct Nurse Respiratory Therapist Tech Physician/Resident/PA/NP Indirect
Ancillary & Other staff EVS Dietary 171 100 46 13 12 9 5 3 1 180 (33.1%)
Hands full of Supplies
No HH performed due to hands full with supplies, equipment, food tray, etc. Direct Nurse Respiratory Therapist Tech Physician/Resident/PA/NP Indirect Dietary
Ancillary & Other staff EVS Radiology 70 38 22 9 1 10 6 2 1 1 80 (14.7%) Isolation Area (gown + gloves)
Gown or gloves are not used when required Direct Nurse Physician/Resident/PA/NP Respiratory Therapist PT/OT Indirect Radiology
Ancillary & Other staff
51 31 10 9 1 5 3 2 56 (10.3%) Equipment Shared Equipment used between patients Direct Nurse Respiratory Therapist 18 14 4 18 (3.3%)
Hands full of Meds
No HH due to hands full with medication
Direct Nurse Indirect
Ancillary & Other staff
Discussion
Effective hand hygiene plays a significant role in the well-being of patients and
healthcare workers. If hand hygiene compliance is not consistent and well maintained throughout hospitals, it can lead to health threats and put a major risk to patient safety, one being HAI’s. The
WHO’s “Five moments for Hand Hygiene” and the Clean-in and Clean-out Campaign,
represents a standardized approach for monitoring and implementing hand hygiene compliance.
The main aim of this study was to assess the adherence to hand-hygiene compliance and to identify hindrances in non-compliance among healthcare workers in a pediatric hospital. Such studies focused on pediatric populations is limited and have not been done previously in the United States and which solely examines healthcare workers' hand hygiene practices and factors that prevent proper hand washing. Unlike other studies on hand hygiene compliance, this study utilized the tools and methodology developed by WHO and the Clean-in and Clean-out
Campaign to measure hand hygiene compliance among all respective hospital units and among
all categories of healthcare workers that either exhibit direct patient care or indirect patient care
when working in the hospital.
and bed space, alcohol-based hand rubs were strategically located and placed in clear eye-view
so that hand hygiene performance cannot be missed. In addition, there were various hand
hygiene posters placed strategically throughout the entire hospital, specifically on large display
boards in the ICU and above most alcohol-based hand rubs to promote the importance of hand
hygiene.
Direct observation in measuring hand hygiene adherence was the only method used in this study. Considered the gold standard in measuring hand hygiene compliance by WHO and also the preferred measure of compliance to similar studies in the literature, direct observation can help to determine the areas of weaknesses in hand hygiene behavior, to identify the number of hand hygiene opportunities and their indications, to assess techniques, and to provide
feedback to healthcare workers. One of the biggest strengths of the study is that there was a large number of observations collected which gives a great overview on hand hygiene compliance within this pediatric setting. However, direct observation has its limitations; it is
In this covert observation study, when healthcare workers were not aware they were being observed, hand hygiene compliance exceeded the national average reported compliance rate of 50% in similar studies done in other countries. Nevertheless, this study helped determine compliance among all variables such as hand hygiene performance upon entry and exit,
compliance among healthcare disciplines, hospital units and the identification of hand hygiene barriers to determine further improvement in hand hygiene practices.
Direct observation helped reveal a particular low rate of hand hygiene compliance among healthcare workers upon entering patient rooms that was prevalent in both hospital campuses and in the largest intensive care unit, PICU. It was found that healthcare workers performed hand hygiene more often after patient contact when exiting a patient’s room, while poorer hand
hygiene adherence was observed on entry before having direct contact with patients. There have also been similar hand hygiene practice findings reported in literature which identifies that this gap in practice may be explained by lack of knowledge of hand hygiene guidelines or the desire on the part of healthcare workers to protect themselves from transmissible pathogens
(Muhammad Ali Anwar, 2009).
Generally, while physicians and nurses tend to play a more direct role in patient care it is important to not overlook other specific healthcare disciplines that may also work with patients directly or indirectly. Often these disciplines are unobserved and have gone unmonitored in past studies, when they can also perform a substantial role in a patient’s overall health care. The
findings of this study displayed that PT/OT were the highest compliant in direct group, but it is important to point out that the number of observations in their discipline is also significantly less compared to other direct care roles. Respiratory therapists, being the third largest role observed had a compliance rate of 65%. While, this compliance is above the average rate of 50%, it still has much needed room for improvement. Since these staff members may come into more
frequent contact with patients and near touch sites, thus theses healthcare staff need to be further evaluated in future studies.
when healthcare workers had equipment in hand or procedure supplies and their hands were too full to perform hand hygiene. These barriers indicate some factors affecting compliance with hand hygiene such as lack of time, patients need taking priority and lack of knowledge of importance of hand hygiene in preventing cross infection. While these factors can only be assumed based on the barriers, it is important in future studies to get verbal feedback from healthcare workers when hand hygiene non-compliance is being observed.
There are numerous strategies developed by WHO and The Joint Commission for
Transforming Healthcare, that have been implemented to increase hand hygiene compliance that have had an impact on healthcare worker’s performance. The main tools that both organizations use is training, education, providing evaluation and feedback. These organization focus on the importance on educating all staff members and providing regular training on the importance of hand hygiene, based on the “My five moment’s for hand hygiene” approach and on the correct
procedure for hand rubbing and handwashing to all healthcare workers. Emphasis is placed on getting all healthcare workers into the habit of always washing in and washing out upon entering/ exiting a patient care area and before and after patient care. Strategies to improve compliance is also to monitor hand hygiene practices and infrastructure on a frequent basis. This along with engaging staff about related perceptions about hand hygiene can aid in an increase in
References
1. World Health Organization (WHO) Report on the Burden of Endemic Health Care-Associated Infection Worldwide A systematic review of the literature.Geneva, Switzerland: World Health Organization; 2011. Available
at: http://www.who.int/gpsc/country_work/burden_hcai/en/ (accessed December 5, 2017 ).
2. Centers for Disease Control and Prevention. (2016). HAI Data and Statistics. Retrieved from https://www.cdc.gov/hai/surveillance/index.html
3. Collins AS. Preventing Health Care–Associated Infections. In: Hughes RG, editor. Patient Safety and Quality: An Evidence-Based Handbook for Nurses. Rockville (MD): Agency for Healthcare Research and Quality (US); 2008 Apr. Chapter 41. Available from: https://www.ncbi.nlm.nih.gov/books/NBK2683/
4. WHO Guidelines on Hand Hygiene in Health Care: First Global Patient Safety Challenge Clean Care Is Safer Care. Geneva: World Health Organization; 2009. 1, Hand hygiene as a performance indicator Available
at: http://www.who.int/gpsc/5may/tools/who_guidelines-handhygiene_summary.pdf https://www.ncbi.nlm.nih.gov/books/NBK144028/ (accessed December 5, 2017). 5. Hassan Ahmed, K., Aftab, A., & Riffat, M. (2015). Nosocomial infections and their
control strategies. Asian Pacific Journal Of Tropical Biomedicine, Vol 5, Iss 7, Pp
509-514 (2015), (7), 509. doi:10.1016/j.apjtb.2015.05.001
6. Chavali, S., Menon, V., & Shukla, U. (2014). Hand hygiene compliance among healthcare workers in an accredited tertiary care hospital. Indian Journal Of Critical
7. Centers for Disease Control and Prevention. (2017). Hand Hygiene in Healthcare Settings. Retrieved from https://www.cdc.gov/handhygiene/index.html
8. World Health Organization (WHO) Evidence of hand hygiene to reduce transmission and infections by multi-drug resistant organisms in health-care settings. World Health Organization; 2014. Available at: http://www.who.int/gpsc/5may/MDRO_literature-review.pdf (accessed December 5, 2017 ).
9. Boyce, J. M. (1999). It is time for action: improving hand hygiene in
hospitals. Annals Of Internal Medicine, 130(2), 153-155.
10. Pittet, D. (2001). Improving adherence to hand hygiene practice: a multidisciplinary approach. Emerging Infectious Diseases, 7(2), 234-240.
11. WHO Guidelines on Hand Hygiene in Health Care, 2009. Available from: http://www.whqlibdoc.who.int/publications/2009/9789241597906_eng.pdf. 8th August 2017
12. Randle, J., Firth, J., & Vaughan, N. (2013). An observational study of hand hygiene compliance in paediatric wards. Journal Of Clinical Nursing, 22(17/18), 2586-2592. doi:10.1111/j.1365-2702.2012.04103.x
13. https://www.cdc.gov/handhygiene/providers/index.html
14. The Joint Commission Center for Transforming Healthcare. Data Collection Tool by the Hand Hygiene Targeted Solution Tool. Retrieved from:
15. Klevens RM, Edwards JR, Richards CL, Jr, Horan TC, Gaynes RP, Pollock DA, et al. Estimating healthcare-associated infections in US hospitals, 2002. Public Health Rep. 2007;122:160–6.[PMC free article] [PubMed]
16. Revelas, A. (2012). Healthcare – associated infections: A public health problem. Nigerian Medical Journal : Journal of the Nigeria Medical
Association, 53(2), 59–64. http://doi.org/10.4103/0300-1652.103543
17. Gastmeier P, Stamm-Balderjahn S, Hansen S, et al. How outbreaks can contribute to
prevention of nosocomial infection: analysis of 1,022 outbreaks. Infect Control Hosp Epidemiol. 2005 Apr;26:357–61.
18. Hans Jørn Kolmos (2012). Health Care Associated Infections: Sources and Routes of Transmission, Infection Control - Updates, Dr. Christopher Sudhakar (Ed.), InTech, DOI: 10.5772/36470. Available from: https://www.intechopen.com/books/infection-control-updates/sources-and-routes-of-infection
19. Moore, D. L. (2001). Essentials of paediatric infection control. Paediatrics & Child
Health, 6(8), 571–579.
20. Guanche Garcell, H., Villanueva Arias, A., Ramírez Miranda, F., Rubiera Jimenez, R., & Alfonso Serrano, R. N. (2017). Direct observation of hand hygiene can show differences in staff compliance: Do we need to evaluate the accuracy for patient safety? Qatar Medical Journal, 2017(2), 1. http://doi.org/10.5339/qmj.2017.1 21. Karaaslan, A., Kepenekli Kadayifci, E., Atıcı, S., Sili, U., Soysal, A., Çulha, G., …
Bakır, M. (2014). Compliance of Healthcare Workers with Hand Hygiene Practices in
Perspectives on Infectious Diseases, 2014, 306478. http://doi.org/10.1155/2014/306478
22. Srigley JA, Furness CD, Baker GR, et al. Quantification of the Hawthorne effect in hand hygiene compliance monitoring using an electronic monitoring system: a retrospective cohort study.BMJ Qual Saf Published Online First: 07 July 2014. doi: 10.1136/bmjqs-2014-003080