International Journal of Emerging Technology and Advanced Engineering
Website: www.ijetae.com (ISSN 2250-2459,ISO 9001:2008 Certified Journal, Volume 5, Issue 3, March 2015)
225
Analysis of Customer Churn in Mobile Industry using Data
Mining
Aishwarya churi
1, Mayuri Divekar
2, Sonal Dashpute
3, Prajakta Kamble
41,2,3,4
Student, Pursuing B.E., Information Technology, Atharva College of Engineering, Maharashtra, India
Abstract— Customer churn prediction in Mobile industry is a latest research topic in recent years. A huge amount of data is generated in Mobile industry every minute. Data mining techniques have also developed in various ways. Customer churn is considered as one of the major issues in Mobile industry. The research signifies that it is more expensive to gain a new customer than to retain an existing one. The knowledge extracted from Mobile industry helps to understand the reasons of customer churn and Telecom providers use the data to retain existing customers. This paper surveys the commonly used data mining techniques to identify customer churn patterns. Classification and association models are the two most commonly used models for data mining in Customer Relationship Management. This study focuses on data mining techniques for reducing customer churn and also likely to reduce error ratio. The recent literature in the area of predictive data mining techniques in customer churn behavior is reviewed and a discussion on the future research directions is offered.
Keywords— Customer churn, Customer retention, Customer relationship management (CRM), Data mining, C4.5, Naive Bayes classifier.
I. INTROUCTION
Telecommunication companies are routinely give and depot tremendous quantity of superiority data, hugely rich customer base and changing rapidly with highly competitive environment[15]. In this fiercely competitive market, the subject of customer retention, loyalty, and churn is receiving attention in many industries. The most difficult problem faced by Mobile industry is customer churn. Customer churn refers to the periodic loss of customers in an organization. Customers are able to choose among multiple service providers and actively exercise their rights of switching from one service provider to another. When a customer leaves, we lose not only the future revenue from this customer but also the resources we spent to acquire the customer in the first place like new recruits of manpower, cost of publicity and discounts. Attracting thousands of new subscribers is worthless if an equal number are leaving.
Attracting new customers costs almost five to six times more than retaining the old customers.[13] The company should know why a customer decides to go for other company is essential in the product-range or services by detecting faults. Attracting new customers costs almost five to six times more than retaining the old customers. The requirement of retaining customers craves for accurate customer churn prediction models. A model should be developed to identify the reasons to churn and the improvements required to retain customers.
The paper will provide an application to telecommunication companies who want to know about their customers and details of their customers that who are existing and loyal to them and who are going to leave or quitting from their products. Also to know about who are loyal to them so that they can give them some extra benefits and make better campaign for customer retention. The most common churn prediction models are based on older statistical and data-mining methods. In this paper we’ll be using Naïve Bayes probabilistic data mining algorithm and C 4.5 decision tree algorithm. For the purpose of this study, a publicly available telecommunications churn problem dataset is used. Customer churn refers to the periodic loss of customers in an organization. Customer churn is a very common problem of every organization all over the world. In the competitive market it’s a very big challenge for any organization to retain their customers and build a valuable place in the market to gain more customers.
In such companies it is very lavish process because users are switching frequently from one service to another according to their interests and needs and market competition growing increasingly. Many organizations are also facing this problem. So we are going to build a classification model for churn prediction in telecommunication companies.
International Journal of Emerging Technology and Advanced Engineering
Website: www.ijetae.com (ISSN 2250-2459,ISO 9001:2008 Certified Journal, Volume 5, Issue 3, March 2015)
[image:2.612.50.291.156.297.2]226
Table -1:
Annual Churn Rate of some International Companies.
Telecommunication Company
Annual Churn
Rate
Year Operating Country
Globe 31 2003 PHILPINES
Virgin Mobile 14 2005 G.BRITAIN
Vodaphone 17.2 2005 ITALY
Nextel 16 USA
Hutchison Telecom 20 2005 INDIA Average Churn
Rate 20.6
II. DATA MINING PROCESS
Data mining is the process of discovering patterns and analyzing data (typically, business or market related) from different perspectives, finding relationships between variables, and summarizing it into useful information to help companies focus on the most important information in their data warehouses. This process involves data base, data collection, data storage, data preprocessing and data preparation.
A.Data Collection:
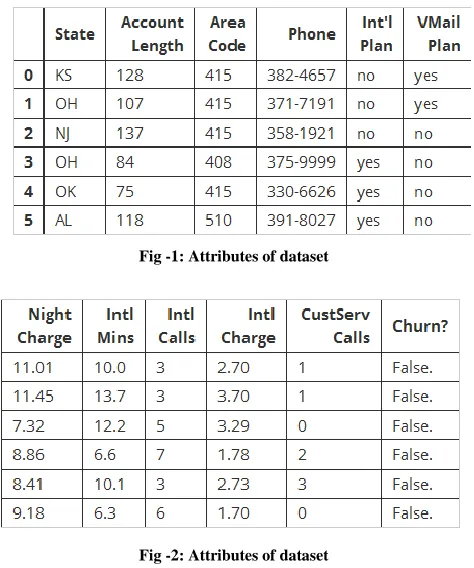
In this paper, the dataset is obtained from Yhat (pronounced y-hat) , a data science technology company that provides tools and systems that allow enterprises to turn data insights into data-driven products. The data is straightforward. Each row represents a subscribing telephone customer. Each column contains customer attributes such as phone number,call minutes used during different times of day, charges incurred for services, lifetime account duration, and whether or not the customer is still a customer. The database contains 21 attributes and information about 3334 instances of the company with the details of the customer.
B.Data Preparation:
Before data can be used for data mining they need to be cleaned and prepared in required format. Initially multiple sources of data is combined under common key.
Some missing values on the call detail records like call_date,call_time, and call_duration was found, such records were ignored.
[image:2.612.327.564.202.486.2]At this stage, attributes such as V-mail plan were eliminated since records in such attributes were not necessary. Data set was initially in MS-Excel format which was later converted into SQL format. In order to perform further tasks SQL server were used.
Fig -1: Attributes of dataset
Fig -2: Attributes of dataset
C.Evaluation and Implementation:
International Journal of Emerging Technology and Advanced Engineering
Website: www.ijetae.com (ISSN 2250-2459,ISO 9001:2008 Certified Journal, Volume 5, Issue 3, March 2015)
[image:3.612.69.277.143.399.2]227
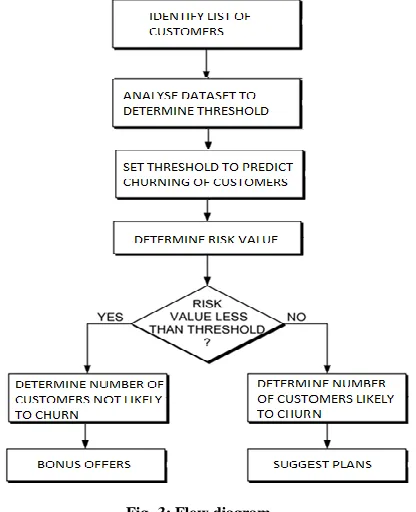
Fig -3: Flow diagram
III. DATA MINING TECHNOLOGIES
A.Decision Tree
A decision tree is a decision support tool that has a flowchart like tree structure. It serves as a basis of several commercial rule induction systems. The decision tree[14] is a structure that has an internal node which is also called as non-leaf node. It represents a test on an attribute. Each branch represents an outcome of the test. Each leaf node or terminal node holds a class label. The topmost node in the tree is the root node. Decision trees can produce binary trees as well as non-binary trees. Decision trees are widely used because they can easily be converted to classification rules.
The following decision tree is for the concept – play_badminton indicating the weather conditions in which one can play badminton.
Fig -4: Example of Decision tree
B.C4.5
The decision tree can be generated by using C4.5 algorithm. This algorithm is developed by Ross Quinlan. C4.5 is a successor to the Quinlan’s earlier ID3 algorithm. The C4.5 generated decision trees can be used for classification, and because of this reason, C4.5 is also referred to as a statistical classifier. In C4.5, the decision trees are generated in a top-down recursive manner, using the divide and conquer rule[14].
The general algorithm for building C4.5 decision trees is:[2]
1.Create a node N
2.If tuples in Data Partition D are all of the same class C , then
3. Return N as a leaf node labeled with the class C
4.If attribute_list is empty then
5. Return n as a leaf node labeled with the majority class in D
6.Apply attribute_selection_method to find best splitting_criteria
7.Label node N with splitting_criteria 8.If splitting_criteria is dicrete valued and Multi-way splits allowed then
[image:3.612.361.530.144.294.2]International Journal of Emerging Technology and Advanced Engineering
Website: www.ijetae.com (ISSN 2250-2459,ISO 9001:2008 Certified Journal, Volume 5, Issue 3, March 2015)
228 9. For each outcome j of splitting_criteria
10. Let Dj be the set of data tuples in D satisfying outcomes j
11. If Dj is empty then
12. Attach leaf labeled with the majority class in D to node N
13. Else attach the node return by generate_decision_tree to node N
Endfor 14. Return N
C.Bayesian Classifier
The Baye’s Theorem is the basis for the Bayesian classifier. Bayesian classifiers are also known as the statistical classifiers. Bayesian classifier can very well predict the probability that a given tuple belongs to a particular class. Bayesian classifier calculates explicit probabilities for hypothesis, among the most practical approaches to certain types of learning problems, representing probabilistic learning. Naïve Bayes is a very well known probabilistic classifier which is also comparatively simpler.
D.Naïve Bayes:
The Naïve Bayes’[21] classifier is based on Bayesian theorem with independence assumptions between predictors. This model is easy to build, with no complicated iterative parameter estimation which makes it particularly useful for very large datasets. Despite its simplicity, the Naive Bayesian classifier often does surprisingly well and is widely used because it often outperforms more sophisticated classification methods. Bayes theorem provides a way of calculating the posterior probability, P(c|x), from P(c), P(x), and P(x|c). Naive Bayes classifier assume that the effect of the value of a predictor (x) on a given class (c) is independent of the values of other predictors. This assumption is called class conditional independence[4]s.
P(C = c|X = x) = P(C = c) Πi P (Xi |C = c) P(X = x)
P(c|x) is the posterior probability of class (target) given predictor (attribute).
P(c) is the prior probability of class.
P(x|c) is the likelihood which is the probability of predictor given class.
P(x) is the prior probability of predictor.
The posterior probability can be calculated by first, constructing a frequency table for each attribute against the target.
Then, transforming the frequency tables to likelihood tables and finally use the Naive Bayesian equation to calculate the posterior probability for each class. The class with the highest posterior probability is the outcome of prediction.
IV. RESULTS
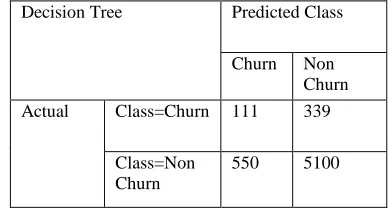
[image:4.612.334.530.356.463.2]The model is predicting over 85.43% of the false churner means loyal customers, correctly but only 66% of true churners. If we wanted to correctly predict the loyal customers who will not churn at the expense of the other types this would appear to be a reasonable model. On the other hand, if we wanted to predict those customers that were going to cause the company a loss by churning, this model would only predict correctly in about two third of the increases.
Table -2:
Confusion Matrix for Decision tree model for demographic attributes
The accuracy of the model is calculated using the following formula,
Number of Correct Predictions
Accuracy = Total Number of Predictions
= 111+5100
111+339+550+5100
Accuracy = 85.43%
Number of Wrong Predictions
Error rate = Total Number of Predictions
= 550+339
6000
Error Rate = 14.57%
Decision Tree Predicted Class
Churn Non Churn Actual Class=Churn 111 339
Class=Non Churn
International Journal of Emerging Technology and Advanced Engineering
Website: www.ijetae.com (ISSN 2250-2459,ISO 9001:2008 Certified Journal, Volume 5, Issue 3, March 2015)
229 From the above calculations, we observed the predictive accuracy of 85.43% and error rate of 14.57% for our decision tree model. Similarly, the predictive accuracy and other measures are calculated.
V. CONCLUSION AND FUTURE WORK
This study provides another very powerful statistical tool survival analysis to predict customer churn. Therefore, to build an effective and accurate customer churn prediction model, has become an important research problem for both academics and practitioners in recent years. This paper suggests that data mining techniques can be a promising solution for the customer churn management and we can establish an early-warning model for this non-steady-state customer system. The final model summary in this paper concludes that the model gives more than 92% overall accuracy for the prediction of the customer churn. Overall, this study is helpful in customizing marketing communications and customer treatment programs to optimally time their marketing intervention efforts.
For future work, several issues can be considered. First, as the data pre-processing stage in data mining is a very important step for the final prediction model performance, the dimensionality reduction or feature selection step can be involved in addition to data reduction. Second, along with naive bayes algorithm, other popular prediction techniques can be applied in combination, such as support vector machines, genetic algorithms, neural networks, etc to develop hybrid models. Finally, the current methodology of churn prediction can be tested for other sectors like banking, insurance or airline and comparisons can be done for predicting accuracy .
Acknowledgement
We express our gratitude to our project guide Prof. Reena Mahe, who provided us with all the guidance and encouragement and making the lab available to us at any time. We are eager to express our gratitude to the Head of the Information Technology Dept. Prof Neelima Pathak, for her approval of this project. We are also thankful to her for providing us the needed assistance, detailed suggestions and also encouragement to do the project. We would like to deeply express our sincere gratitude to our respected principal Prof. Dr. Shrikant Kallurkar and the management of Atharva College of Engineering for providing such an ideal atmosphere to build up this project with well equipped library with all the utmost necessary reference materials and up to date IT Laboratories. We are extremely thankful to all staff and the management of the college for providing us all the facilities and resources required,
REFERENCES
[1] Narander Kumar, Vishal Verma, Vipin Saxena, ― Cluster Analysis in Data Mining using K-Means Method‖, International Journal of Computer Applications , Vol. 76, No. 12, August 2013, pp. 11-14. [2] S. Balaji, S.K. Srinivasta, ―Naïve Bayes Classification approach for
Mining Life insurance Databases for Effective Prediction of Customer Preferences over Life Insurance Products‖, International Journal of Computer Applications, Vol.51, No. 3,2012.
[3] Prabha Dhandayudam, Dr.Illango Krishnamurthi , ―An improved Clustering Algorithm for customer segmentation‖, International Journal of Engineering Science and Technology, Vol. 4, No. 2, Feburary 2012, pp.
[4] Md. Faisal Kabir, Alamgir Hossain, Keshav Dahal, ― Enhanced Classification Accuracy on Naïve Bayes Data Mining Models‖, International Journal of Computer Applications, Vol. 28, No. 3, August 2011, pp. 9-16
[5] Indranil Bose, Xi Chen, ―Hybrid models using Unsupervised Clustering for Prediction of Customer Churn‖, Proceedings of the International MultiConference of Engineers and Computer Scientists, Vol. 1, March 18-20, 2009, Hong Kong.
[6] Yaya Xie, Xiu Li, E.W.T. Ngai, Weiyan Ying, ― Customer churn prediction using improved balanced random forests‖, An International Journal of Expert System with Applications , Vol . 36, 2009, pp. 5445-5449
[7] Bart Baesens, Geert Verstraeten, Dirk Van den Poel, Michael Egmont – Petersen, Patrick Van Kenhove, Jan Vanthienen, ― Bayesian network classifiers for identifying the slope of the customer lifecyele of long life customers‖, European Journal of Operational Research, Vol. 156, 2004, pp. 508-523
[8] G. Kraljevíc and S. Gotovac, ―Modeling data mining applications for
prediction of prepaid churn in telecommunication
services,‖ Automatika, vol. 51, no. 3, pp. 275–283, 2010
[9] John Hadden, Ashutosh Tiwari, Rajkumar Roy, and Dymtr Ruta World Academy of Science, Engineering and Technology 19 2006 churn prediction using complaints data
[10] Ms Ranju Marwaha, ―Data Mining Techniques and Applications in Telecommunication Industry‖, International Journal of Advanced Research in Computer Science and Software Engineering, Volume 4, Issue 9, September 2014
[11] Dr. M.Balasubramanian, M.Selvarani, ―churn prediction in mobile telecom system using data mining techniques‖, International Journal of Scientific and Research Publications, Volume 4, Issue 4, April 2014
[12] Clement Kirui, Li Hong , Wilson Cheruiyot and Hillary Kirui, ―Predicting Customer Churn in Mobile Telephony Industry Using Probabilistic Classifiers in Data Mining‖ International Journal of Computer Science Issues, Vol. 10, Issue 2, No 1, March 2013. [13] Amal M. Almana , Mehmet Sabih Aksoy and Rasheed Alzahrani,
―Data Mining Techniques In Customer Churn Analysis For Mobile industry‖ Amal M. Almana et al Int. Journal of Engineering Research and Applications ISSN : 2248-9622, Vol. 4, Issue 5( Version 6), May 2014, pp.165-171.
International Journal of Emerging Technology and Advanced Engineering
Website: www.ijetae.com (ISSN 2250-2459,ISO 9001:2008 Certified Journal, Volume 5, Issue 3, March 2015)
230
[15] N.Kamalraj and Dr.A.Malathi, ―Applying Data Mining Techniques in Telecom Churn Prediction‖, Volume 3, Issue 10, October 2013. [16] Ionut Brandusoiu andGavril Toderean, ―Churn Prediction in The
Telecommunications Sector Using Support Vector Machines‖, ISSUE #1, MAY 2013.
[17] Anuj Sharma and Dr. Prabin Kumar Panigrahi, ―A Neural Network based Approach for Predicting Customer Churn in Cellular Network Services‖,International Journal of Computer Applications (0975 – 8887) Volume 27– No.11, August 2011.
[18] Nastaran Mohammadhossein, Dr. Nor. Hidayati Zakaria, ,‖ CRM Benefits for Customers: Literature Review (2005 – 2012) ― , International Journal of Engineering Research and Applications ,Vol. 2, Issue 6, December 2012, pp.1578-1586.
[19] Vivek Bhanbri, ―Data Mining as a Tool to Predict Churn Behavior of Customers‖, International journal of Computer & Organizatio Trends , Vol. 2, Issue. 3, 2012, pp. 85-88.
[20] Rahul J. Jadhav and Usharani T. Pawar ―Churn Prediction in Telecommunication Using Data Mining Technology ― , International Journal of Advanced Computer Science and Applications, Vol. 2, No.2, February 2011.
[21] Aditya Kumar Gupta and Chakit Gupta ―Analyzing Customer Behavior Using Data Mining Techniques: Optimizing Relationships with Customer‖ , Research Scholar, Indian Institute of Professional Studies, Lucknow, Vol. VI, No. 1; June, 2010.