International Journal of Emerging Technology and Advanced Engineering
Website: www.ijetae.com (ISSN 2250-2459, ISO 9001:2008 Certified Journal, Volume 7, Issue 9, September 2017)
425
Study for Residual Compressive and Flexural Strength of
Different Structural Members in R.C.C. Framed Hospital
Building by Using Different Grades of Concrete under Extreme
Temperature Conditions
Manish Nigam
1, Rajendra Kumar Srivastava
21Associate Professor, PSIT College of Engineering, Kanpur, U.P. (INDIA), 2
Ex. Enginner-in Chief (U.P. P.W.D.) Abstract---This research aims to provide the suitable grade
of concrete for hospital building in case of extreme fire exposure for better structural integrity of structure to save patient and other human lives. Human safety in the event of fire is one of the considerations in the design of hospital buildings. Concrete has a good service record in this respect. Concrete structures are currently being designed for fire resistance using prescribed methods that are based on experimental fire tests. These laboratory test results involve specifying minimum grade of concrete, minimum cross sectional size of structural members and minimum concrete cover. As new codes are moving towards performance based design, there is a need for design the structural members of hospital building structure during extreme fire conditions. The present work shows the behavior of concrete at different eminent temperatures, and its effect on the residual compressive strength of concrete. The study shows comparison of different grades of concrete with respect to elevated temperature. Ten samples of each grades M20 (Air cooled and quenched), M20 with water repellent powder(to affect their permeability characteristics), M25, M30, M35, M40 (Air cooled and quenched) were tested at temperature of 600°C, 800°C and 1100°C to compare their residual compressive strength. Six samples each of M20, M25 and M30 were tested for comparison of permeability of different grades. The permeability test and effect of water-cement ratio shows spalling problem in concrete and this study is for grades of concrete commendation in admired structures like framed R.C.C. structures of hospital buildings, we are focusing on hospital building because we famine to increase the fissure between safe structural stability enactments and evacuation time because hospital building requires fore evacuation time in appraisal to other same building structures.
Keywords--- Bond strength, Cover, Flexural strength of Slab, Flexural strength of Beam, Grade of concrete, Hospital building, Permeability, Residual compressive strength, Spalling, tensile strength, Water-Cement ratio and yield strength.
I. INTRODUCTION
Fire is a disaster, from which no structure, remains unaffected and it became more serious in venerable building structure like hospital building. Due to increased
incidents of major fires in buildings; analysis,
maintenances and rehabilitation of fire impaired structures has become a subject of concentration. RCC in relation to fire is relatively less explored because of the lesser use of RCC structures in Europe/USA as compared to steel structures. In India, there is more use of RCC structure as compared to steel and composite structure. There is an urgent need to collect more data & lay more emphasis on design oriented “Passive measures” rather than just relying on firefighting measures known as “Active measures”. Ignorance on part of the consultants & civic authorities has resulted in structures that are sub-standard from fire resistance view point. There is an urgent need to gather additional information about performance of R.C.C. under fire in order to create a general awareness & improve the existing practices & Code provisions.
International Journal of Emerging Technology and Advanced Engineering
Website: www.ijetae.com (ISSN 2250-2459, ISO 9001:2008 Certified Journal, Volume 7, Issue 9, September 2017)
426
of RC members. High temperature substantially reduces strength of concrete and causes significant increase in cracking, spalling, strains and deflections. Load bearing capacity of structure decreases and may fail at critical points.II. METHODOLOGY AND EXPERIMENTAL SETUP
Tests performed:
Two tests were performed during experiment work:
1. Compressive strength test of concrete[1]
2. Permeability test of concrete
3. Flexural Strength test of Beam and Slab
Structural components analyzed:
1. Beam
2. Slab
Compressive Strength Test:
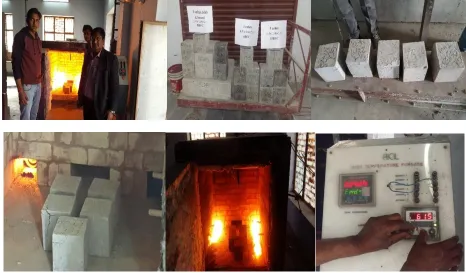
The samples were heated at the rate of 6.67°C/min up to the three different temperatures of 600°C, 800°C and 1100°C in the diesel furnace. Residual compressive Strength Test after 28 days curing were performed on samples of different grades of concrete M20 (air cooled and quenched), M20 with water repellent powder, M25, M30, M35, M40 (Air cooled and quenched) at 600°C, 800°C and 1100°C.[5]
The specimens casted and fire exposure condition of specimens are shown below in figure (1).
Figure (1) shows Diesel furnace and the samples of different grades of concrete tested at different elevated temperatures Compressive Test readings of concrete cubes after 28 days curing at 600°C:-
[image:2.612.72.538.313.586.2]International Journal of Emerging Technology and Advanced Engineering
Website: www.ijetae.com (ISSN 2250-2459, ISO 9001:2008 Certified Journal, Volume 7, Issue 9, September 2017)
427
21.87 20.5 21.55 21.73 20.41 20.11 19.97 21.43 20.29 21.34 19 19.5 20 20.5 21 21.5 22 22.5 M20 Co m press iv e st re ng th ( N/m m ²)f
ck →Sample→
Graph (1).
M20 at 600°C
sample 1 sample 2 sample 3 sample 4 sample 5 sample 6 sample 7 sample 8 sample 9 sample 10 18.27 19.74 20.52 20.26 18.6 18.34 19.95 18.91 19.12 20.59 17 17.5 18 18.5 19 19.5 20 20.5 21 M20 (QUENCHED)
C
ompre
ssi
ve
stre
ng
th
(N
/m
m²)
f
ck →Sample→
graph (2).
M20 (Quenched)
at 600˚C
sample 1 sample 2 sample 3 sample 4 sample 5 sample 6 sample 7 sample 8 sample 9 sample 10 18.65 19.79 17.82 18.21 19.27 17.69 18.83 19.66 18.97 18.51 16.5 17 17.5 18 18.5 19 19.5 20
M20 + Powder
C
ompre
ssi
ve
stre
ng
th
(N
/m
m²)
f
ck →Sample→
graph (3).
M20+Powder
at 600°C
sample 1 sample 2 sample 3 sample 4 sample 5 sample 6 sample 7 sample 8 sample 9 sample 10 18.45 20.13 17.52 18.09 19.87 18.35 19.43 19.77 18.79 20.7 15 16 17 18 19 20 21 M25
C
ompre
ssi
ve
stre
ng
th
(N
/m
m²)
f
ck →Sample→
Graph (4).
M25
at 600°C
International Journal of Emerging Technology and Advanced Engineering
Website: www.ijetae.com (ISSN 2250-2459, ISO 9001:2008 Certified Journal, Volume 7, Issue 9, September 2017)
428
Compressive Test readings of concrete cubes after 28 days curing at 800°C:-
The graphs below show the compressive strength of 10 samples of sizes of 150mm x 150mm x 150mm of each grades mentioned above at 800°C
15.77 16.87 17.12
18.82
16.5 18.31
18.68 16.36 18.06 19.41 0 5 10 15 20 25 M30 C o m p ress iv e str en g th ( N/m m ²) fck →
Sample→
Graph (5).
M30
at 600°C
sample 1 sample 2 sample 3 sample 4 sample 5 sample 6 sample 7 sample 8 sample 9 sample 10 17.132 16.069 15.86 16.392 17.016
16.183 16.232
15.12 16.02 15.236 14 14.5 15 15.5 16 16.5 17 17.5 M35 C o m p ress iv e str en g th ( N/m m ²) fck →
Sample→
Graph (6).
M35
at 600°C
sample 1 sample 2 sample 3 sample 4 sample 5 sample 6 sample 7 sample 8 sample 9 sample 10 15.68 16.357 16.763 17.44 15.5 16.08 17.62 17.13 15.99 17.04 14 14.5 15 15.5 16 16.5 17 17.5 18 M40 (Aircooling) C o m p ress iv e str en g th ( N/m m ²) fck →
Sample→
Graph (7).
M40(Air-cooling)
at 600°C
sample 1 sample 2 sample 3 sample 4 sample 5 sample 6 sample 7 sample 8 sample 9 sample 10 15.7 13.94 15.88 15.39 14.25 15.023 15.3
14.34 13.76 14.617 12.5 13 13.5 14 14.5 15 15.5 16 16.5 M40(Quenched) C o m p ress iv e str en g th ( N/m m ²)
fck→
Sample→
Graph (8).
M40(Quenched)
at 600°C
International Journal of Emerging Technology and Advanced Engineering
Website: www.ijetae.com (ISSN 2250-2459, ISO 9001:2008 Certified Journal, Volume 7, Issue 9, September 2017)
429
17.11 16.55 17.91 18 15.87 17.62 17.23 16.67 15.78 16.16 14.5 15 15.5 16 16.5 17 17.5 18 18.5 M20 (QUENCHED) C o m p ress iv e str en g th ( N/m m ²) fck →Sample→
Graph (10).
M20 (Quenched)
at 800˚C
sample 1 sample 2 sample 3 sample 4 sample 5 sample 6 sample 7 sample 8 sample 9 sample 10 17.48 19.54 18.71 19.49 17.53 19.88 18.31 17.82 19.2 17.14 15.516 16.517 17.518 18.519 19.520 20.5 M20 Co m p re ss iv e str en g th (N/m m ²) fck →
Sample→
Graph (9).
M20 at 800°C
sample 1sample 2 sample 3 sample 4 sample 5 sample 6 sample 7 sample 8 sample 9 sample 10
14.03 15.41 14.6 16.29 15.95
13.58 14.37 14.91 16.74 15.72 0 2 4 6 8 10 12 14 16 18
M20 + Powder
C o m p ress iv e str en g th ( N/m m ²) fck →
Sample→
Graph (11).
M20+Powder
at 800°C
sample 1 sample 2 sample 3 sample 4 sample 5 sample 6 sample 7 sample 8 sample 9 sample 10
15.25 15.71 14.45 15.2 17.1
16.85 17.31 15.46 17.36 18.11 0 5 10 15 20 M25 C o m p ress iv e str en g th ( N/m m ²) fck →
Sample→
Graph (12).
M25
at 800°C
sample 1 sample 2 sample 3 sample 4 sample 5 sample 6 sample 7 sample 8 sample 9 sample 10 15.92 14.11 13.6 14.36 16.65 15.313.74 15.55 16.06 13.01 0 2 4 6 8 10 12 14 16 18 M30 C o m p ress iv e str en g th ( N/m m ²) fck →
Sample→
Graph (13).
M30
at 800°C
sample 1sample 2 sample 3 sample 4 sample 5 sample 6 sample 7 sample 8 sample 9 sample 10 11.35 12.89 13.36
11.4 12.71 13.41
11.87 13.59 11.17 12.05
0 5 10 15 M35 C o m p ress iv e str en g th ( N/m m ²) fck →
Sample→
Graph (14).
International Journal of Emerging Technology and Advanced Engineering
Website: www.ijetae.com (ISSN 2250-2459, ISO 9001:2008 Certified Journal, Volume 7, Issue 9, September 2017)
430
Compressive Test readings of concrete cubes after 28 days curing at 1100°C:-
The graphs below show the compressive strength of 10 samples of sizes of 150mm x 150mm x 150mm of each grades mentioned above at 1100°C
Graph (17). Graph (18). 9.164 11.984 8.37 9.954 10.968 9.862 9.386 11.19 10.492 10.4 0 2 4 6 8 10 12 14 M40 (Aircooling) C o m p ress iv e str en g th ( N/m m ²) fck →
Sample→
Graph (15).
M40(Air-cooling)
at 800°C
sample 1 sample 2 sample 3 sample 4 sample 5 sample 6 sample 7 sample 8 sample 9 sample 10 7.28 9.04 8.18 7.41 9.39 8.76 9.66
7.9 9.57 7.55 0 2 4 6 8 10 12 M40(Quenched) C o m p ress iv e str en g th ( N/m m ²)
fck→
Sample→
Graph (16).
M40(Quenched)
at 800°C
sample 1 sample 2 sample 3 sample 4 sample 5 sample 6 sample 7 sample 8 sample 9 sample 10 11.7 11.886 12.846 10.76 11.16 12.426
11.74 11.826
10.862 12.724 9.5 10 10.5 11 11.5 12 12.5 13 13.5 M20 C o m p ress iv e s tren gth (N/mm ²) fck →
Sample→
M20
at 1100˚C
sample 1sample 2 sample 3 sample 4 sample 5 sample 6 sample 7 sample 8 sample 9 sample 10 10.44 9.92 8.48 9.7 10.58 8.43 9.14 9.36
10.63 8.62 0 2 4 6 8 10 12 M20 (QUENCHED) C o m p ress iv e str en g th ( N/m m ²) fck →
Sample→
M20 (Quenched)
at 1100˚C
International Journal of Emerging Technology and Advanced Engineering
Website: www.ijetae.com (ISSN 2250-2459, ISO 9001:2008 Certified Journal, Volume 7, Issue 9, September 2017)
431
4.22 4.483.78 4.92 3.5 5.2 4.72 5.33 3.37 3.98 0 1 2 3 4 5 6
M20 + Powder
C o m p ress iv e str en g th ( N/m m ²) fck →
Sample→
Graph (19).
M20 + Powder
at 1100˚C
sample 1 sample 2 sample 3 sample 4 sample 5 sample 6 sample 7 sample 8 sample 9 sample 10 9.61 10.39 11.25
10.65 11.1 9.87 11.94
9.01 9.16 8.32
0 2 4 6 8 10 12 14 M25 C o m p ress iv e str en g th ( N/m m ²) fck →
Sample→
graph (20).
M25
at 1100°C
sample 1 sample 2 sample 3 sample 4 sample 5 sample 6 sample 7 sample 8 sample 9 sample 10
10.21 9.82 10.67 9.08 8.23 8.63 10.41 8.69 10.27 8.49 0 2 4 6 8 10 12 M30 C o m p ress iv e str en g th ( N/m m ²) fck →
Sample→
Graph (21).
M30
at 1100°C
sample 1 sample 2 sample 3 sample 4 sample 5 sample 6 sample 7 sample 8 sample 9 sample 107.58 8.2 8.94
9.84
7.91 7.7 8.48 9.72
9.51 9.22
0 2 4 6 8 10 12 M35 C o m p ress iv e str en g th ( N/m m ²) fck →
Sample→
Graph (22)
International Journal of Emerging Technology and Advanced Engineering
Website: www.ijetae.com (ISSN 2250-2459, ISO 9001:2008 Certified Journal, Volume 7, Issue 9, September 2017)
432
The average compressive strength after 28 days of curing of each grade of M20 (Air cooled and quenched), M20 with water repellent powder, M25, M30, M35, M40 (Air cooled and quenched)
From graph (25), it can be seen that:
(1) As increasing temperature, the loss of compressive strength occur for each grade concrete. (2) At a particular temperature,the decrease in residual compressive strength in high strength concrete is more than that of low strength concrete.
Percentage Residual and Loss in compressive strength after 28 days curing of different grades of concrete at 600°C, 800°C and 1100°C.
4.73 5.74 5.58
6.59
4.63 5.38
6.69
5.94 5.81 5.51
0 1 2 3 4 5 6 7 8 M40(Air-cooling) C o m p ress iv e str en g th ( N/m m ²) fck →
Sample→
Graph (23).
M40 (Air-cooling)
at 1100˚C
sample 1 sample 2 sample 3 sample 4 sample 5 sample 6 sample 7 sample 8 sample 9 sample 10 0.81 1.69 1.792.67 2.02 1.46 2.76 0.72 2.05 1.43 0 0.5 1 1.5 2 2.5 3 M40(Quenched) C o m p ress iv e str en g th ( N/m m ²) fck →
Sample→
Graph (24).
M40 (Quenched)
at 1100˚C
sample 1 sample 2 sample 3 sample 4 sample 5 sample 6 sample 7 sample 8 sample 9 sample 10 20.9219.43 19.11
17.59
16.126 16.56 14.82
18.74 18.51
16.89 16.28
14.83 12.38 10.177 8.47 15.16 11.793
9.53 10.13 9.45 8.71
International Journal of Emerging Technology and Advanced Engineering
Website: www.ijetae.com (ISSN 2250-2459, ISO 9001:2008 Certified Journal, Volume 7, Issue 9, September 2017)
433
100% 97.15%
76.44%
58.64%
46% 41.40% 37%
93.70% 0% 2.85%
23.56% 41.36%
54% 58.60% 63%
6.30%
0% 10% 20% 30% 40% 50% 60% 70% 80% 90% 100%
com
pr
es
si
v
e
st
reng
th
samples→
Graph (26).
Percentage Residual and Loss in Strength at 600°C
LOSS IN STRENGTH RESIDUAL STRENGTH
93%
84.45%
65.12%
49.44% 35%
25.44% 21%
75.80% 7%
15.55%
34.88% 50.56%
65%
74.56% 79%
24.20%
0% 10% 20% 30% 40% 50% 60% 70% 80% 90% 100%
com
pr
es
si
v
e
st
reng
th
samples→
graph (27).
Percentage Residual and Loss in Strength at 800°C
International Journal of Emerging Technology and Advanced Engineering
Website: www.ijetae.com (ISSN 2250-2459, ISO 9001:2008 Certified Journal, Volume 7, Issue 9, September 2017)
434
Percentage residual and loss in strength of each grade at different temperatures: 59%
47.65% 40.52% 31.50%
25% 14.15%
4% 21.75% 41%
52.35% 59.48% 68.50% 75%
85.85% 96% 78.25%
0% 20% 40% 60% 80% 100%
com
pr
es
si
v
e
st
reng
th
samples→
Graph (28).
Percentage Residual and Loss in Strength at 1100°C
LOSS IN STRENGTH
RESIDUAL STRENGTH
100
%
0%
M20 at 600°C
% Residual Strength
% Loss in strength
92.5
5%
7.45
%
M20 at 800°C
% Residual Strength
% Loss in strength
59%
41%
M20 at 1100°C
International Journal of Emerging Technology and Advanced Engineering
Website: www.ijetae.com (ISSN 2250-2459, ISO 9001:2008 Certified Journal, Volume 7, Issue 9, September 2017)
435
97.1
5%
2.85
%
M20 (Quenched) at
600°C
% Residual Strength
% Loss in strength
84.4
5%
15.5
5%
M20 (Quenched)
at 800°C
% Residual Strength
% Loss in strength
52.3
5%
47.6
5%
M20 (Quenched)
at 1100°C
% Residual Strength
% Loss in strength
76.44
%
23.56
%
M25 at 600°C
% Residual Strength
% Loss in strength
65.1
2%
34.8
8%
M25 at 800°C
% Residual Strength
% Loss in strength
40.5
2%
59.4
8%
M25 at 1100°C
International Journal of Emerging Technology and Advanced Engineering
Website: www.ijetae.com (ISSN 2250-2459, ISO 9001:2008 Certified Journal, Volume 7, Issue 9, September 2017)
436
58.6
4%
41.3
6%
M30 at 600°C
% Residual Strength
% Loss in strength
49.4
4%
50.5
6%
M30 at 800°C
% Residual Strength
% Loss in strength
31.5
%
68.5
%
M30 at 1100°C
% Residual Strength
% Loss in strength
46%
54%
M35 at 600°C
% Residual Strength
% Loss in strength
35.3
7%
64.6
3%
M35 at 800°C
% Residual Strength
% Loss in strength
25%
75%
M35 at 1100°C
International Journal of Emerging Technology and Advanced Engineering
Website: www.ijetae.com (ISSN 2250-2459, ISO 9001:2008 Certified Journal, Volume 7, Issue 9, September 2017)
437
41.4
%
58.6
%
M40+A at 600°C
% Residual Strength
% Loss in strength
25.4
4%
74.5
6%
M40+A at 800°C
% Residual Strength
% Loss in strength
14.1
5%
85.8
5%
M40+A at 1100°C
% Residual Strength
% Loss in strength
37%
63%
M40+Q at 600°C
% Residual Strength
% Loss in strength
21.1
7%
78.8
3%
M40+Q at 800°C
% Residual Strength
% Loss in strength
4%
96%
M40+Q at 1100°C
International Journal of Emerging Technology and Advanced Engineering
Website: www.ijetae.com (ISSN 2250-2459, ISO 9001:2008 Certified Journal, Volume 7, Issue 9, September 2017)
438
Graph (29). Representation of percentage residual and loss in compressive strength of individual grades at different temperatures.
Note: ‘A’ stands or Air cooled and ‘Q’ stands for Quenched.
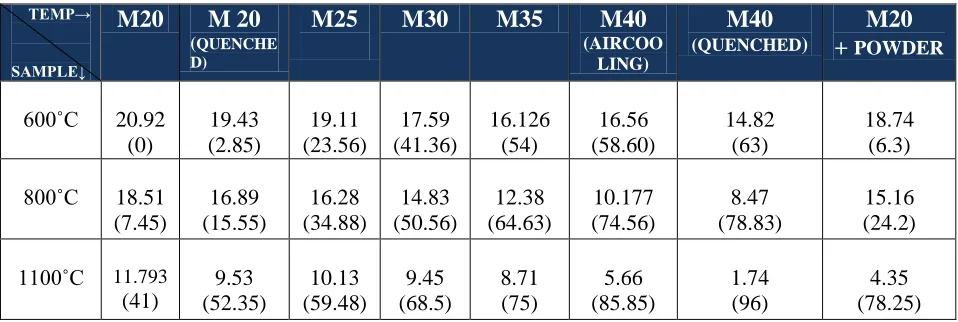
III. COMPRESSIVE STRENGTH AT DIFFERENT TEMPERATURES (BRACKET VALUE SHOWS PERCENTAGE LOSS IN
STRENGTH): Table (1).
Results obtained from compressive tests in tabulated form
TEMP→
SAMPLE↓
M20
M 20
(QUENCHE
D)
M25
M30
M35
M40
(AIRCOO LING)
M40
(QUENCHED)
M20
+
POWDER600˚C
20.92
(0)
19.43
(2.85)
19.11
(23.56)
17.59
(41.36)
16.126
(54)
16.56
(58.60)
14.82
(63)
18.74
(6.3)
800˚C
18.51
(7.45)
16.89
(15.55)
16.28
(34.88)
14.83
(50.56)
12.38
(64.63)
10.177
(74.56)
8.47
(78.83)
15.16
(24.2)
1100˚C
11.793(41)
9.53
(52.35)
10.13
(59.48)
9.45
(68.5)
8.71
(75)
5.66
(85.85)
1.74
(96)
4.35
(78.25)
IV. PERMEABILITY TEST OF CONCRETE
In this test specimens cast in laboratory obtained by cutting out cores from existing structure.
The test consists in subjecting the mortar or concrete specimen of known dimensions, contained in a specially designed cell, to a known hydrostatic pressure from one side, measuring the quantity of water percolating through it during a given interval of time and computing the
coefficient of permeability as per IS-3085:1965.
93.7
%
6.3%
M20+Powder at
600°C
% Residual Strength
% Loss in strength
75.8
%
24.2
%
M20+Powder at
800°C
% Residual Strength
% Loss in strength
21.7
5%
78.2
5%
M20+Powder at
1100°C
[image:14.612.67.546.450.611.2]International Journal of Emerging Technology and Advanced Engineering
Website: www.ijetae.com (ISSN 2250-2459, ISO 9001:2008 Certified Journal, Volume 7, Issue 9, September 2017)
439
The test permits measurement of the water entering the specimen as well as that leaving it.[2] [3]These results are obtained by performing test on 18 samples of different grades of conventional concrete at pressure difference of 5 Pa.
3.01 3.39
2.98 3.59
3.21 3.62
0 0.5 1 1.5 2 2.5 3 3.5 4
M20
p
e
rm
e
ab
ili
ty
(X
10
^⁻¹⁴
cm/
sec)
Grade of Concrete
Graph (30
)
M20
SAMPLE1 SAMPLE2 SAMPLE3 SAMPLE4 SAMPLE5 SAMPLE6
1.22 0.985
1.16
1.64 1.58 1.815
0 0.2 0.4 0.6 0.8 1 1.2 1.4 1.6 1.8 2
M25
p
e
rm
e
ab
ili
ty (X
10^
⁻¹⁴
c
m
/sec
)
Grade of Concrete
Graph (31)
M25
SAMPLE1 SAMPLE2 SAMPLE3 SAMPLE4 SAMPLE5 SAMPLE6
0.62
0.731
0.75
0.669 0.78
0.65
0 0.1 0.2 0.3 0.4 0.5 0.6 0.7 0.8 0.9
M30
pe
rmea
bil
it
y
(X
1
0
^⁻¹⁴
cm
/sec)
Grade of Concrete
Graph (32).
M30
SAMPLE1 SAMPLE2
SAMPLE3 SAMPLE4
International Journal of Emerging Technology and Advanced Engineering
Website: www.ijetae.com (ISSN 2250-2459, ISO 9001:2008 Certified Journal, Volume 7, Issue 9, September 2017)
440
From graph(33) and graph(34) , it can be seen that the permeability of concrete decreases towards high strength concrete and the water-cement ratio decreases as moving towards high strength concrete respectively.IV. FLEXURAL STRENGTH TEST OF SLAB AND BEAM
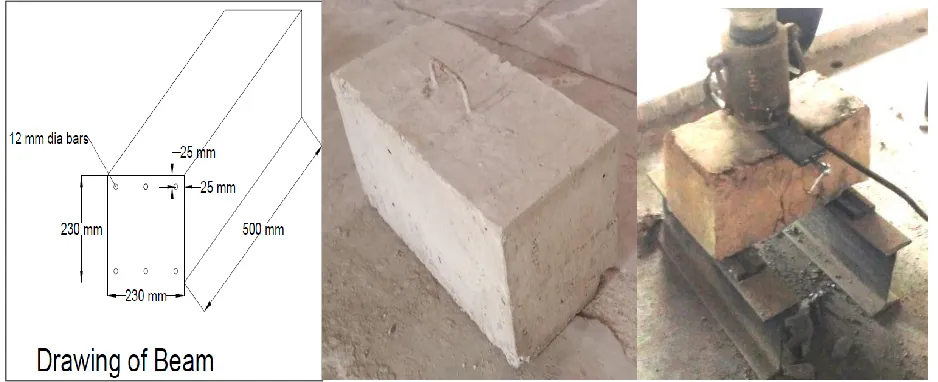
Study on reinforced concrete members (beam and slab) shows that there is loss of flexural strength of reinforced
concrete beam and slab when subjected to elevated temperatures. The flexural strength test was performed on beam and slab by center point loading method. This test is performed at the temperature of 100°C, 600°C and 800°C to find the flexural behavior of beam and slab. [5]
The test set up and specimens testing is shown in figure (2) and figure (3).
Figure (2). Drawing, specimen and test set up for beam
M20 M25 M30
PERMEABILI TY (X 10^⁻¹⁴ cm/sec)
3.3 1.4 0.7
0 0.5 1 1.5 2 2.5 3 3.5
P
ERM
EABI
LITY
(
X
10
-14
cm
/sec
)
Average Permeability of concrete
0 0.1 0.2 0.3 0.4 0.5 0.6
0 20 40 60
m
ax
.
W
/C
ratio
Grade of concrete →
MAX. W/C RATIO
Graph (33). Permeability of M20, M25, M30 Grades of
[image:16.612.73.542.507.698.2]International Journal of Emerging Technology and Advanced Engineering
Website: www.ijetae.com (ISSN 2250-2459, ISO 9001:2008 Certified Journal, Volume 7, Issue 9, September 2017)
441
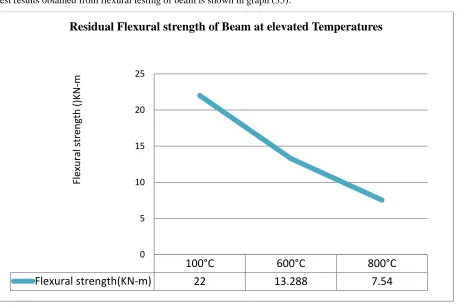
Figure (3). Drawing, specimen and test set up for slab The test results obtained from flexural testing of beam is shown in graph (35).
Graph (35.) Residual flexural strength of beam at different elevated temperature
100°C
600°C
800°C
Flexural strength(KN-m)
22
13.288
7.54
0 5 10 15 20 25
Fl
ex
u
ral
stre
n
gth
()K
N
-m
[image:17.612.80.539.331.637.2]International Journal of Emerging Technology and Advanced Engineering
Website: www.ijetae.com (ISSN 2250-2459, ISO 9001:2008 Certified Journal, Volume 7, Issue 9, September 2017)
442
Percentage residual and loss in flexural strength of beam:
Graph (36). Individual representation of Percentage residual and loss in flexural strength of beam at different temperature
Graph (37). Comparative representation of percentage residual and loss in flexural strength at different temperatures. 100%
0
Beam at 100°C
% Residual
% Loss
60% 40%
Beam at 600°C
% Residual
% Loss
34% 66%
Beam at 800°C
% Residual
% Loss
100°C 600°C 800°C
%Loss 0% 40% 66%
%Residual 100% 60% 34%
100%
60%
34% 0%
40%
66%
0% 10% 20% 30% 40% 50% 60% 70% 80% 90% 100%
Fle
xu
ra
l Stengt
h
in
P
erce
n
tage
→
International Journal of Emerging Technology and Advanced Engineering
Website: www.ijetae.com (ISSN 2250-2459, ISO 9001:2008 Certified Journal, Volume 7, Issue 9, September 2017)
443
Test results obtained from flexural testing of slab is shown in graph (38).
Graph (38.) Residual flexural strength of slab at different elevated temperature Percentage residual and loss in flexural strength of slab:
Graph (39). Individual representation of Percentage residual and loss in flexural strength of slab at different temperature.
100°C
600°C
800°C
Flexural strength(KN-m)
48.38
29.028
16.55
0 10 20 30 40 50 60
Fl
ex
u
ral
stre
n
gth
()K
N
-m
Residual Flexural strength of Slab at elevated Temperatures
100
%
0%
Slab at 100°C
% Residual
% Loss
60% 40%
Slab at 600°C
% Residual
% Loss
34%
66%
Slab at 800°C
% Residual
International Journal of Emerging Technology and Advanced Engineering
Website: www.ijetae.com (ISSN 2250-2459, ISO 9001:2008 Certified Journal, Volume 7, Issue 9, September 2017)
444
Graph (40). Comparative representation of percentage residual and loss in flexural strength at different temperatures. From the flexural testing result obtained , it is clear that
at 100°C there is no loss of flexural strength but at 600°C there is 40% loss of strength in case of both beam and slab. And also find that at 800°C there is about 66 loss of flexural strength.
V.FLEXURAL ANALYSIS OF STRUCTURAL COMPONENTS: In this analytical section of study, structural members such as beam and slab which are already tested as per IS-516:1959 are analyzed by use of IS-456:2000 and Eurocode-1992-1-2. In case of without fire, members are analyzed by Indian standard [4] and after fire exposure members are analyzed by Euro code [6].
Euro code suggests two methods for analysis of structural members (Beam and Slab) after different defined extreme temperature exposure:
(1) Zone method:-In this method, cross-section is
subdivided into several zones is. This method, although more laborious, provides a more accurate method than the 500°C isotherm method especially for columns. The method is applicable to any fully developed fire curve, but data are only provided in this code for the standard temperature-time curve.
(2) 500°C isotherm method:- This is method which is
pertinent to both a standard fire exposure and any fire curves, which cause similar effect in the fire exposed members. Concrete section with temperature slower than 500°C is assumed to have full strength and those with higher value are discarded.
In this paper, 500°C isotherm method is adopted for analysis of beam and slab.The basic design procedure as per 500°C isotherm method available in EN 1992-1-2:2004 (E) is given below[6][7][8].
1)500°C isotherm for the specified fire exposure is
calculated using standard fire or parametric fire.
2) A reduced width bf and effective depth df of the
cross-section is obtained by excluding the concrete outside the 500°C isotherm. The temperature of the individual reinforcing bars is evaluated from the temperature profiles in Annex A of EN 1992-1-2:2004 (E). Those reinforcing bars which fall outside the reduced cross-section may also be included in the calculation of the ultimate load carrying capacity of the fire exposed cross section. In the present study for lower exposure times, all reinforcement bars fall inside the reduced cross-section. But as the time of exposure increases the cross-section size decreases and hence some reinforcement bars fall outside the reduced cross-section. In those cases, those reinforcements are accounted to calculate ultimate load capacity.
100°C 600°C 800°C
%Loss 0% 40% 66%
%Residual 100% 60% 34%
100%
60%
34% 0%
40%
66%
0% 10% 20% 30% 40% 50% 60% 70% 80% 90% 100%
Fle
xu
ra
l Strengt
h
in
P
erce
n
ta
ge
International Journal of Emerging Technology and Advanced Engineering
Website: www.ijetae.com (ISSN 2250-2459, ISO 9001:2008 Certified Journal, Volume 7, Issue 9, September 2017)
445
3) The reduced strength of the reinforcement due to the
temperature is determined according to Cl. 4.2.4.3 of EN 1992-1-2:2004 (E). The corresponding reduction factor is shown in Table A1 of Appendix I of Euro code 3.2(a) EN-1992-1-2[6]
4) The conventional calculation methods for the
determination of the ultimate strength based on limit-state design specified in Indian code is used to find the ultimate load-carrying capacity for reduced cross-section with strength of the reinforcing bars as obtained from step 3.
5) The ultimate load-carrying capacity is compared with
the design capacity or, alternatively, the estimated fire resistance with the required resistance.
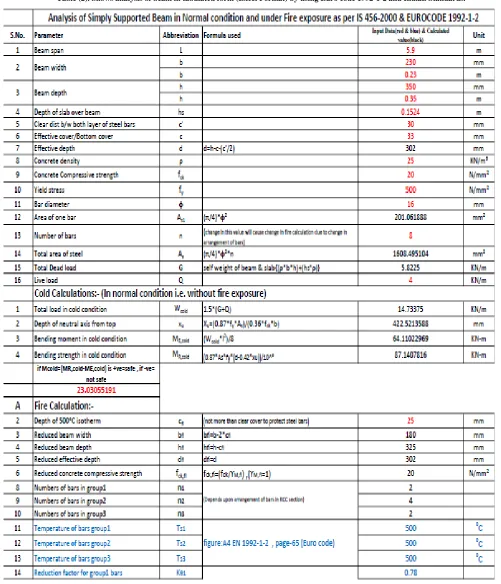
Formula used for calculating flexural strength either for beam or slab is as follows:
Bending Strength= (0.87*As*fy*(d-0.42*
x
u)) N-mm(1)
Xu =(0.87*fy*As)/(0.36*fck*b)
(2) The above formula is used for cold calculation but for fire calculation there is change cross-section due to discarding of thickness which have temperature >=500°CAnd yield strength of steel in fire =
K
θx f
y(3)K
θis known as reduction factor depends upontemperature of reinforcement, value of
K
θ is obtained fromTable 3.2(a) EN-1992-1-2.In this analytical model the specifications for beam and slab are taken from IS-456:2000 and the calculation and formulae used in analysis of beam & slab are taken from Eurocode-1992-1-2 [4] [6].
Flexural Analysis of Beam:-
International Journal of Emerging Technology and Advanced Engineering
Website: www.ijetae.com (ISSN 2250-2459, ISO 9001:2008 Certified Journal, Volume 7, Issue 9, September 2017)
446
[image:22.612.45.546.146.730.2]International Journal of Emerging Technology and Advanced Engineering
Website: www.ijetae.com (ISSN 2250-2459, ISO 9001:2008 Certified Journal, Volume 7, Issue 9, September 2017)
447
Value of Mfire from (A) of Table (2) shows the difference
of bending strength (BS) and bending moment (BM) when
temperature is below critical temperature and value of Mfire
from (B) of Table (2) shows difference of BS & BM when steel reaches critical temperature.
International Journal of Emerging Technology and Advanced Engineering
Website: www.ijetae.com (ISSN 2250-2459, ISO 9001:2008 Certified Journal, Volume 7, Issue 9, September 2017)
448
From graph (41), it is found that for given specification of beam is safe up to 5.90 m and beyond this span bending moment increases and cross the permissible limit so beam will not be safe in flexure for span more than 5.90 m.Flexural Analysis of Slab:
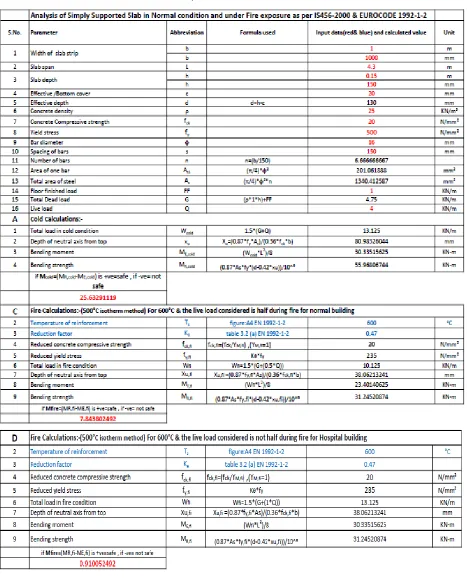
The table below shows the analysis of column in cold condition as well as in fire condition by 500°c isotherm method.
The red values in column 4 are variables, which can be changed and the effect of the change in variables can be seen by red values in column 2, which is the difference of bending strength and bending moment. If this difference is positive slab will be safe otherwise not safe in case of flexure.
0 10 20 30 40 50 60 70 80 90
4.7m 5m 5.3m 5.6m 5.9m 6.2m 6.5m 6.8m
B
en
d
in
g M
om
en
t
in
K
N
-m
Span of Beam→
Graph (41)
Flexural Strength of Simply Supported Beam at 600°C
Bending Moment Developed (KN-m)
International Journal of Emerging Technology and Advanced Engineering
Website: www.ijetae.com (ISSN 2250-2459, ISO 9001:2008 Certified Journal, Volume 7, Issue 9, September 2017)
449
[image:25.612.74.541.148.726.2]International Journal of Emerging Technology and Advanced Engineering
Website: www.ijetae.com (ISSN 2250-2459, ISO 9001:2008 Certified Journal, Volume 7, Issue 9, September 2017)
450
Result from C&D of table (3): - At the temperature 600°C, slab is not safe in fire condition in case of Hospital Building due to loss of yield stress almost 50% & no decrease in live load.Result from A & C table (3): - At the temperature 600°C, slab is not much safe in fire condition than cold
condition in case of normal building due to loss of yield stress almost 50%.
From above table (3), by changing span of slab , there is a change in bending moment develops and bending strength(BM) and bending strength remain fixed which is represented below in graph (42).
0 5 10 15 20 25 30 35 40 45
3.3m 3.6m 3.9m 4.2m 4.3m 4.5m 4.8m 5.1m
B
e
n
d
in
g M
o
m
e
n
t
in
KN
-m
Span of Slab→
Graph 42
Flexural Strength of Simply Supported Slab at 600°C
Bending Moment Developed (KN-m)
International Journal of Emerging Technology and Advanced Engineering
Website: www.ijetae.com (ISSN 2250-2459, ISO 9001:2008 Certified Journal, Volume 7, Issue 9, September 2017)
451
From graph (42), it is found that for given specifications of slab, it is safe up to span of 4.3 m and beyond this it is not safe due to excessive bending moment.VI. RESULTS AND DISCUSSIONS
After testing the different grades of concrete at different time exposure and different degree of exposure we found different parameters related to residual strength of concrete, permeability, role of water cement ratio for spalling of concrete cover, type of cement, yielding of reinforcement, bond strength and flexural strength of beam and slab and different findings related to above discussed points are given below:
1. Normal Strength Concrete and High Strength Concrete :-
a)Residual Compressive Strength:- From the laboratory test, it is clear that the residual compressive strength of high strength concrete structure is less than that of Normal Strength after fire exposer at each temperature (600°C, 800°C and 1100°C).
b)Permeability:-. From the graph obtained from laboratory test of different grade, it can be seen that permeability of high strength concrete is less than normal strength concrete. It means the moisture present inside the pores of concrete has less chances of expulsion in case of high strength concrete during fire. Due to this strong pressure gradient develops close to the surface
c)Water-Cement ratio: -from the Graph (34) drawn from IS: 456-2000, it is clear that as increasing grade of concrete, the water-cement ratio decreases. It
means compactness of concrete increases
(permeability) decreases.
So, from graph (33) and (34), moisture content present inside the concrete gets converted into vapor due to rise in temperature and vapor pressure. This vapor pressure causes development of tensile stress inside concrete(due to low permeability) , when it reaches up to tensile strength of concrete then crack develops on the surface of concrete and fall off from surface of concrete member, which is called as Spalling of concrete[9].
d)From laboratory test on M20(with water repellent), it
can be seen that the spalling of “M20+P” is less than M20 without water repellent for same Water-Cement ratio but the residual compressive strength of “M20+P” is less than that of M20 without powder.
2. The cement with more percentage of fly ash (up to 50%) has more residual compressive strength than that of cement with less percentage of fly ash. It is also clear that the cement without fly ash (OPC) has less compressive strength than that of PPC [10].
3. From various literature review, it is found that the concrete cover mainly affects the temperature of the steel reinforcement. Therefore, as increasing the concrete cover, temperature of reinforcement decreases, protects it from fire.
4. As test result shows that there is no loss of flexural strength at 100°C but at 600°C flexural strength loss in beam and slab exposed to fire with each 25 mm cover thickness is up to 40% of the flexural strength. And about 65% loss of flexural strength of both structural components at 800°C. So, at 600°C structural components retain about 60% of its strength which can be retrofitted for future serviceability.
5. There is a most considerable decrease in the bond strength between reinforcement and concrete after 400°C and rate of decrease of bond strength is greater than that of compressive strength. [11]
6. The very important aspect for the residual strength of concrete is the dimensions of the core of the column. For the same fire duration, higher residual strength is given by the larger core area. The more the thickness of the cover, the earlier it tends to fall off. The strength of the column mainly depends on the core of concrete. Therefore, as the core area increases, the RC column will have a higher residual strength after elevated temperature exposure. The factors affecting development and propagation of cracks are also important for the stability of RC column and it will depend upon fire exposure time, RC column concrete cover thickness, and provided reinforcement ratio. However, the existence and the characteristics of surface cracking after fire are not directly related to strength loss. The temperature in the interior part of the RC column rise even after extinguishing of fire which shows that, the temperature of the exterior part of the column was decreasing while the temperature of the interior part of the column was increasing. [12]
VII. RECOMMENDATIONS
International Journal of Emerging Technology and Advanced Engineering
Website: www.ijetae.com (ISSN 2250-2459, ISO 9001:2008 Certified Journal, Volume 7, Issue 9, September 2017)
452
Use of M20 grade of concrete is preferable for construction of R.C.C. framed hospital building because this grade of concrete is having more residual compressive strength in appraisal to others at different high elevated temperatures, Use of PPC cement is recommended for construction of R.C.C. framed hospital building, Use of high yield strength steel bars Fe500 in hospital building construction due to requirement of more yield strength is required at elevated temperature, Keep Water-Cement ratio as low as possible to avoid spalling of cover problem for different structural members, which further create the delinquent of exposure of steel to heat , in design of R.C.C framed hospital building bond strength between steel and concrete must be considered carefully and for normal specification and parameters regarding to span of beam and span of slab result shows beam is safe up to 5.90 m andslab is safe up to slab span up to 4.3 m at 6000C
temperature and further more research is required for different section of above said structural components , if we follow above said parameters in designing or construction of R.C.C. framed structures of hospital building definitely we have more structure stability against extreme fire conditions and more evacuation time to escape without any trapping due to structural failure since of this we can protect more lives. The RC column should be provided with larger core area and proper reinforcement ratio and cover thickness by considering drawing and design in case of fire exposure.
REFERENCES
[1] C. B. K.Rao, Rooban Kumar, A Study on Behavior of Normal Strength Concrete and High Strength Concrete Subjected to Elevated Temperatures (2015)
[2] IS-3085:1965, Method of test for Permeability of Cement Mortar and Concrete.
[3] Sai Sindhu K, Suresh Babu T, Study and Comparision of Mechanical Properties, Durability and Permeability of M15, M20, M25 Grades of Pervious Concrete with Conventional Concrete (2015)
[4] IS 456:2000, Plain and Reinforced Concrete -Code of Practice [5] ]IS 516:1959Methods of tests for strength of concrete.
[6] Eurocode 2 (EN 1992-1-2): Design of concrete structures - Part 1-2: General rules - Structural fire design (2004)
[7] Aneesha Balaji*, Praveen Nagarajan, and Madhavan Pillai, Validation of Indian Standard Code Provisions for Fire esistance of Flexural Elements (2015)
[8] Annelies De Wit, Behavior and structural design of concrete structures exposed to Fire (2011)
[9] Takeshi Morita, Akira Nishida, Nobuyuki Yamazaki, An Experimental Study on Spalling of High Strength Concrete Elements under Fire Attack (2000)
[10] Md. Akhtar Hossain*, Mohammad Nurul Islam, Md. Rajibul Karim, Fire Resistance of Cement Mortar Containing High Volume Fly Ash (2006)
[11] Éva Lublóy, L. György, Temperature Effects on Bond between Concrete and Reinforcing Steel (2014)