International Journal of Emerging Technology and Advanced Engineering
Website: www.ijetae.com (ISSN 2250-2459,ISO 9001:2008Certified Journal, Volume 4, Issue 5, May 2014)392
Implementation of a PIC-based, Photovoltaic Maximum Power
Point Tracking Control System
Adel A. Elbaset
1,
Ahmed Emad-Eldin Hussein2, Ayman Brisha2,Ramadan Mahmoud Mostafa
21
Faculty of Engineering, Minia University, Minia, Egypt.
2Faculty of Industrial Education, Beni-Suef University, Egypt
Abstract—Maximum power point tracking (MPPT) is used in photovoltaic (PV) systems to maximize the PV array output power, irrespective of the temperature and irradiation conditions and the load electrical characteristics. This paper presents a practical implementation of perturbation and observation (P&O) and incremental conductance (IncCon) algorithms based on PIC18F452 microcontroller for tracking of the maximum power generation from PV system. These algorithms are widely used because of its low-cost and ease of realization. Proposed P&O and IncCon algorithms are implemented and tested under different loads, and the test results are analyzed and compared. The results show the performance of the IncCon algorithm in tracking MPP is better than the P&O algorithm and the experimental results of IncCon algorithm indicate that the feasibility and improved functionality of the system with has high-efficiency.
Keywords—Photovoltaic (PV), Maximum Power Point Tracking (MPPT), Perturb and Observe (P&O), Incremental Conductance (IncCon).
I. INTRODUCTION
PV power systems are one of today’s fastest growing renewable energy technologies, providing more secure power sources and pollution free electric supplies. Unfortunately, PV systems have high fabrication cost and low energy conversion efficiency. Since the PV electricity is expensive compared to the electricity from the utility grid, utilization of maximum PV system output power is desired. Therefore, the PV system should be operating at their maximum output power (MPP) in any environmental
conditions(1). The system’s operating point is at the
intersection of the I-V curves of the PV system and load, when a PV system is directly connected to a load. The MPP of PV system is not attained most of the time. The problem is overcome by using a MPPT algorithm which maintains the PV system operating point at the MPP. There are several MPPT continuously searches algorithms that have been proposed in the literature which uses different characteristics of solar panels and the location of the MPP, including perturb-and-observe method, open- and short-circuit method, incremental conductance algorithm, fuzzy
logic and artificial neural network(1-14).
To extract the maximum power from the solar PV module and transfer that power to the load, a MPPT system has been developed using Boost type DC-DC converter. A DC-DC boost converter transfers maximum power from the solar PV system to the load and it acts as an interface between the load and the system. Maximum power is transferred by varying the load impedance as seen by the source and matching it at the peak power of it when the duty cycle is changed. In order to maintain PV array’s operating at its MPP, different MPPT techniques are studied. In the literature many MPPT techniques are proposed such as, the P&O method, IncCon method, Fuzzy Logic Method etc(1,10,14). Of these, the two most popular MPPT techniques P&O and IncCon methods are
studied(15,16,17). This paper presents a practical
implementation of P&O and IncCon algorithms based on PIC18F452 microcontroller for tracking of the maximum power generation from PV system under a rapid change in the radiation level. The proposed control system algorithm obtains the Data from the PV system through microcontroller’s Analog and Digital ports to perform the pulse width modulation to the DC-DC boost converter. These techniques vary in many aspects as: simplicity, convergence speed, digital or analogical implementation, sensors required, cost, range of effectiveness, and in other aspects. Incremental conductance algorithm is used to track the MPP because it performs precise control under rapidly changing atmospheric conditions.
II. MATHEMATICAL MODELING OF PV MODULE
International Journal of Emerging Technology and Advanced Engineering
Website: www.ijetae.com (ISSN 2250-2459,ISO 9001:2008Certified Journal, Volume 4, Issue 5, May 2014)393
Rp Rs
+
VPV VD
IPH
ID
IPV
[image:2.612.92.235.142.210.2]-Ropt
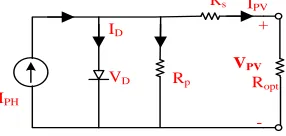
Fig. 1. Single-diode circuit model of PV cell
The mathematical equation describing the I-V
characteristics of a PV solar cells module are given by(7),
(18), (19-20).
( )
Iph : The generated current of solar cells module. This
current varies with temperature according to the following equation:
( )
Where;
KI : The short circuit current temperature coefficient.
T
H
: The average radiation on the tilted surface,kW/m2.and the diode characteristic is:
( )
[ [
] ]
Where;
IPV : The output photovoltaic cell current , Ampere
VPV : The output photovoltaic cell voltage, Volt
A : The ideality factor for p-n junction. T : The temperature, Kelvin.
KB : The Boltzman's constant in Joules per Kelvin, 1.38*10-23 J/k.
q : The charge of the electron in Coulombs, 1.6*10-19C.
RP : Parallel resistance, Ohm
RS : Series resistance , Ohm
ID : The diode saturation current , Ampere
VD : The diode voltage , Volt
Io : The reverse saturation current, Amp. This current
varies with temperature as follows:
[ ] [
( )]
Where;
Tr : The reference temperature, oK.
Ego: The band-gap energy of the semiconductor used in
solar cells module.
Ior : The saturation current at Tr, Amp.
The output of the solar cells module can be calculated by the following equation:
[
[ [
] ]
]
From the above equations, it can be concluded that the output current and power of a PV module are affected by solar insolation and operating cell temperature. Figure 2 illustrates the I/V characteristics of a PV module and a
resistive load Ropt. The resistance characteristic is a line of
slope 1/Ropt. The operating point is located at the
intersection of the two curves. In the AB region of the curve the PV behaves as a current generator and in the CD region it behaves like a voltage source. In the intermediate zone BC, the characteristic of the PV is nonlinear, it is in this area that we find the MPP for which the PV provide its full power for certain atmospheric conditions. The resistance value corresponding to this point is denoted Ropt
(17)
.
D Vmpp
Impp
Isc
MPP
C B
A Icell
Vcell
Voc
1/Ropt
1/R
Fig. 2. I/V Characteristics of the PV and a resistive load
III. MATCHING STAGE BETWEEN A PV SYSTEM AND A LOAD
[image:2.612.346.530.483.607.2]International Journal of Emerging Technology and Advanced Engineering
Website: www.ijetae.com (ISSN 2250-2459,ISO 9001:2008Certified Journal, Volume 4, Issue 5, May 2014)394
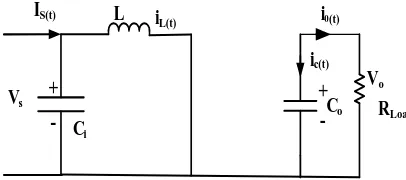
A. DC/DC Boost converter
Figure 3 Shows a DC/DC Boost converter which converts a DC voltage into another DC voltage of higher value. DC/DC converter has two modes, a continuous Conduction Mode, CCM for efficient power conversion and Discontinuous Conduction Mode DCM.
-
-+ +
RLoad
Co
Ci
D
S
IS(t) iL(t) id(t)
ic(t)
i0(t)
ton toff
T Vs
[image:3.612.361.535.161.242.2]S L
Fig. 3. Basic of Boost Converter Topology
Continuous Inductor Current(21) Mode 1 (0 <t ) “Transistor on”
Mode 1 begins when the switching transistor is switched
on t=0 and it terminates at t= . The equivalent circuit for
mode 1 shown in Fig. 4. The diode is reversing biased since the voltage drop across the switching transistor is small than the output voltage. The inductor current iL(t)
greater than zero and ramp up linearly. The inductor voltage is Vs.
-
-+ +
RLoad
Co
Ci
IS(t)
ic(t)
i0(t)
Vs
L iL(t)
[image:3.612.88.303.195.323.2]Vo
Fig. 4. Mode 1 equivalent circuit for the boost converter (o<tton ).
The output current during this interval is supplied entirely
from the output capacitor, Co, which is chosen large enough
to supply the load current during ton with a minimum
specified drop in output Current. Stored energy in the inductor is:
(9)
Mode 2 ( <t T) “Transistor off”
Mode 2 begins when MOSFET is switched off at t=ton and terminates at t=Ts. The equivalent circuit for the mode 2 is shown in Fig. 5. The inductor current decrease until the
MOSFET is turned on again during the next cycle. The voltage across the inductor in this period is Vs-Vo.
-
-+ +
RLoad Co Ci
IS(t)
ic(t)
Vs
L iL(t) i o(t)
Vo
Fig. 5. Mode 2 equivalent circuit for the boost converter (ton<tT)
Since the current in the inductor cannot change instantaneously, the voltage in the inductor reverses its polarity in an attempt to maintain a constant current. The current that was flowing through the switching transistor will now flow through L, C, diode, and the load. The inductor current decreases until the switching transistor is turned on again during the next cycle. The inductor delivers its stored energy to the output capacitor C, and charges it up via Duty cycle to a higher voltage than the input voltage. This energy supplies the current and replenishes the charge drained away from the output capacitor when it alone was supplying the load current during the on time.
Discontinuous Inductor Current
If the current flowing through the inductor falls to zero before the next turn-on of the switching transistor, the boost converter is said to be operating in the discontinuous inductor current. The voltage conversion ratio of the boost converter for the discontinuous inductor current of operation can be derived by imposing a constant volt-second requirement on its inductor. The critical inductance, Lc, is given by the inductance at the boundary
edge between continuous and discontinuous modes and is defined as:
(10)
where;
R : The equivalent load, .
fs : The switching frequency, Hz
[image:3.612.84.287.447.537.2]International Journal of Emerging Technology and Advanced Engineering
Website: www.ijetae.com (ISSN 2250-2459,ISO 9001:2008Certified Journal, Volume 4, Issue 5, May 2014)395
IV. MPPTCONTROL ALGORITHMS(22)
MPPTs play a main role in PV power systems because they maximize the power output from a PV system for a given set of conditions, and therefore maximize the array
efficiency. Thus, a MPPT(22) can minimize the overall
system cost. There are many algorithms for maximum power point tracking methods available. In this paper P&O and IncCon techniques are used and described in the following subsection, because these require less hardware
complexity and low-cost implementations(14,23). MPPT
operate at very high frequencies, usually in the 20-80 kHz range. The advantage of high frequency circuits is that they can be designed with small components. In present work, the boost converter is used as load matching device between input and output by changing the duty cycle of the converter circuit. A major advantage of boost converter is that high voltage can be obtained from the available voltage according to the application.
A. Perturb and Observe technique
P&O technique(17,22,25) operate by periodically perturbing (i.e. incrementing or decrementing) the array terminal voltage or current and comparing the PV output power with that of the previous perturbation cycle. P&O strategy states that a small change in the PV module working voltage
causes the following effects(25)
If the corresponding variations in power P are
positive, a change fall towards the maximum power point and continue variations in the same track until MPP is reached.
If the change in P is negative, this implies that a
changes are going far as of MPP and so the change in the perturbation direction is needed.
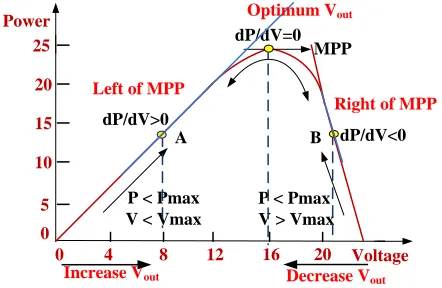
Fig. 6, shows an illustration of the PV panel output power against panel voltage at a given irradiation. The spot indicated shows the MPP.
Let us define two operating positions as point A (dP/dV> 0) and B (dP/dV<0). The point A is perturbed in a given direction and that the power increases (dP/dV> 0), then it is clear that the perturbation has moved the operating point toward the MPP. The P&O algorithm will continue to perturb the tension in the same direction. In contrast, the point B locates in such a way around the maximum power point, so as to move nearer to that specific operational point by giving a negative variation to the voltage (dP/dV<0) then the perturbation has moved the operating point away from the MPP. The technique will reverse the direction of the next perturbation. The process is periodically repeated until the MPP is reached. The system oscillates around MPP, which causes power loss.
The oscillation can be minimized by decreasing the size of the perturbation. One drawback of the P&O algorithm is that it can fail during a rapidly changing climatic conditions(17).
Right of MPP
A B
Power
Voltage
P < Pmax P < Pmax V < Vmax V > Vmax
0 0
4 8 12 16 20
5 10 15 20 25
dP/dV>0
dP/dV<0 dP/dV=0
MPP
Left of MPP
Decrease Vout Increase Vout
[image:4.612.336.557.187.331.2]Optimum Vout
Fig 6. Sign of dP/dV at different positions of the power characteristic curve
B. Incremental Conductance Method
IncCon offers good performance under rapidly changing atmospheric conditions. The IncCon method based on the fact that, the slope of the PV array of the power curve is zero at the MPP, positive on the left of the MPP. And
negative on the right of the MPP(7-12). This can be given by,
(11)
(12)
(13)
The above equations can be written in terms of voltage and current as follows.
(14)
If the operating point is at the MPP, the equation (14)becomes:
(15)
(16)
If the operating point is at the left side of the MPP, the equation (14) becomes:
(17)
(18)
If the operating point is at the right side of the MPP, the equation (14) becomes:
(19)
[image:4.612.319.565.448.725.2]
International Journal of Emerging Technology and Advanced Engineering
Website: www.ijetae.com (ISSN 2250-2459,ISO 9001:2008Certified Journal, Volume 4, Issue 5, May 2014)396
We can observe that the left side of the Eqs. 16, 18, and 20 represent incremental conductance of the PV module, and the right side of the equations represents its instantaneous conductance as shown in Fig. 6
V. IMPLEMENTATION OF HARDWARE
Prototype hardware are implemented to test the performance of the proposed MPPT algorithms is shown in Fig. 7. The circuit consists of one PV panel, a DC/DC converter, a microcontroller kit, PC-based application, Voltage sensor and Current sensor as well as other peripherals for ensuring the robustness of the system. The voltage and current sensors are used to periodically sample the panel's voltage and current. These sensors are passed to signal conditioning to improve the quality of the signal. Followed by that, these signals are fed into the microcontroller through the analog to digital (A/D) channels. The microcontroller performs process to the voltage and current readings, to calculate the direction and the value of the next step-size. The output of the microcontroller is the pulse-width-modulation (PWM) signal to control the boost DC/DC converter.
-
-+ + R
Load
Co
Ci
D
S S L
PIC 18F452 µC
MOSFET DRIVER IC
Current sensor PWM Control
PWM
Voltage sensor
Temp sensor A / D1
A / D3 A / D2
Ouput +
-Rsens
PV Panel
Vo
Sun
Fig. 7. Schematic hardware of the proposed MPPT.
A. PV module
The electrical characteristics of a PV module, given by manufacture’s data sheet at the nominal temperature of 25
°C and irradiation of 1000W/m2, The PV module
[image:5.612.324.564.209.305.2]specifications are given by the manufacturer are shown in Table I. The panel equipped with LM35 temperature sensor to monitor its temperature during experiments.
TABLE I
ELECTRICAL CHARACTERISTICS OF A PV MODULE
Parameter Value
Number of series cells 36
Maximum power rating 30Wp
Open circuit voltage (Voc) 21 V
Short circuit current (Isc) 1.94 A
Maximum power voltage (Vmp) 16.8 V
Maximum power current (Imp) 1.78 A
B. DC/DC converter
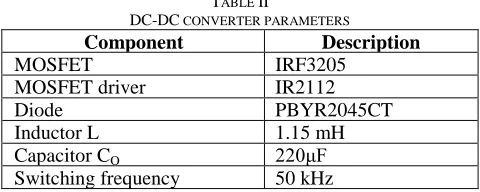
In this work The DC/DC converter is a 50W boost converter working at a switching frequency of 50 kHz, it is used to interface the PV panel output to the load and to track the maximum power point of the PV panel. The parameters of the converter are given in Table II.
TABLE II
DC-DC CONVERTER PARAMETERS
Component Description
MOSFET IRF3205
MOSFET driver IR2112
Diode PBYR2045CT
Inductor L 1.15 mH
Capacitor CO 220μF
Switching frequency 50 kHz
C. Microcontroller-based control board
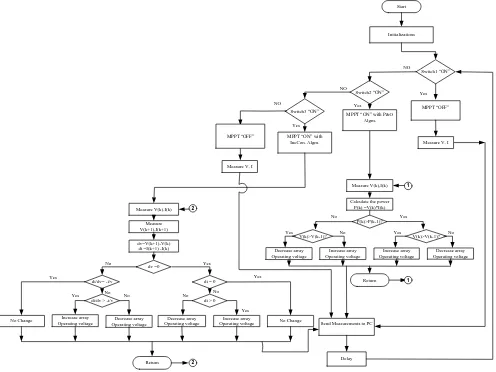
The implementation of the MPPT algorithms can be performed using a Microchip PIC18F452 µC. This microcontroller features a 10-bit, eight channel A/D converter that used by the control program to calculate the PV panel output current, voltage and panel temperature. Also, it features PWM outputs with program controlled duty cycle that used to control the DC/DC converter to track the MPP. PIC18F452 µC was selected because it has the necessary features that required for the proposed system, such as great memory size, on-chip A/D converter, PWM outputs, low-power consumption and low cost. PIC18F452 µC has programmed using mikro C compiler that produced by Microelectronic. The developed program performs P&O and IncCon. Choosing between the two algorithms can be operated during the running of the experiment using switches that connected to PIC18F452 µC ports. The flow chart of the developed program is shown in Fig. 8.
D. PC-based application software.
[image:5.612.57.275.383.492.2]International Journal of Emerging Technology and Advanced Engineering
Website: www.ijetae.com (ISSN 2250-2459,ISO 9001:2008Certified Journal, Volume 4, Issue 5, May 2014)397
Switch2 “ON” Start
Switch1 “ON”
Switch3 “ON” NO
NO
NO
Yes
Yes
Yes
MPPT “ON” with IncCon. Algm. MPPT “OFF”
MPPT “ON” with P&O Algm.
Initializations
MPPT “OFF”
Send Measurements to PC Decrease array
Operating voltage
Increase array Operating voltage Increase array
Operating voltage
Decrease array Operating voltage Calculate the power
P(k) =V(k)*I(k) Measure V(k),I(k)
P(k)>P(k-1)?
V(k)>V(k-1)? V(k)>V(k-1)?
Return No
Yes Yes
Yes
No No
Delay di/dv > -i/v
Increase array Operating voltage
Decrease array Operating voltage Decrease array
Operating voltage
Increase array Operating voltage dv=V(k+1)-V(k)
di =I(k+1) -I(k) Measure V(k),I(k)
dv =0
di = 0
di > 0 di/dv= -i/v
Measure V(k+1),I(k+1)
No Change No Change
Return
Yes No
Yes
Yes Yes
Yes
No No
No
No
Measure V, I
Measure V, I
2
1 2
[image:6.612.64.560.128.500.2]1
Fig. 8. PIC18F452 µC Firmware flow chart
VI. EXPERIMENTAL RESULTS
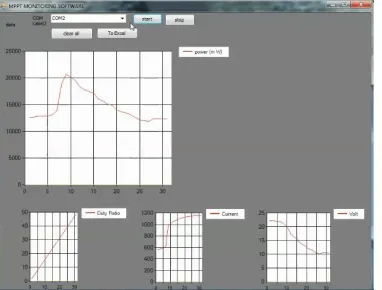
An extensive measurements and testing for the selected techniques has been done using the above described system. Selected results are presented with a comparison between P&O and IncCon controllers. DC/DC are implemented and connected with the PIC18F452 µC as shown in Fig. 9. Fig 10 shows online-monitoring of system parameters (Power, Duty Ratio, Current, Voltage). The following results are presented for different conditions of irradiation and temperature. Performance of the P&O MPPT algorithms under fixed irradiation level and under different conditions of temperature is shown in Fig. 11(a,b,c,d) while performance of the IncCon MPPT algorithms under same conditions is shown in Fig. 12(a,b,c,d). Panel temperature is forced to increase through heater/dryer. From these Figures, It can be noted that the
IncCon MPPT algorithm gives better performance compared to the P&O algorithm.
[image:6.612.329.560.529.703.2]International Journal of Emerging Technology and Advanced Engineering
Website: www.ijetae.com (ISSN 2250-2459,ISO 9001:2008Certified Journal, Volume 4, Issue 5, May 2014) [image:7.612.74.265.133.278.2]398
Figure 10 Online-monitoring of system parameters to get PV Curve and IV Curve by the PC- software `
(a)
(b)
(c)
(d)
Fig. 11 Output Power, Current, Voltage and Temperature using P&O under different conditions of Temperature at Fixed Irradiation
(a)
(b)
(c)
[image:7.612.327.567.135.526.2](d)
Fig. 12 Performance of the IncCon under fixed irradiation level and under different conditions of temperature
[image:7.612.53.298.307.699.2]International Journal of Emerging Technology and Advanced Engineering
Website: www.ijetae.com (ISSN 2250-2459,ISO 9001:2008Certified Journal, Volume 4, Issue 5, May 2014)399
(a)
(b)
(c)
[image:8.612.53.291.109.508.2](d)
Fig. 13 Performance of the P&O under different irradiation level and different conditions of temperature
Output power of PV panel at fixed irradiation level and temperature with and without MPPT is shown in Fig. 15. It is noted that the MPPT algorithms tracking maximum power from PV panel. It is obvious that the IncCon algorithm has less oscillating and better stable operating point compared to P&O algorithm.
(a)
(b)
(c)
[image:8.612.327.572.120.510.2](d)
Fig. 14 Performance of the IncCon under different irradiation level and different conditions of temperature
[image:8.612.335.560.546.680.2]International Journal of Emerging Technology and Advanced Engineering
Website: www.ijetae.com (ISSN 2250-2459,ISO 9001:2008Certified Journal, Volume 4, Issue 5, May 2014)400
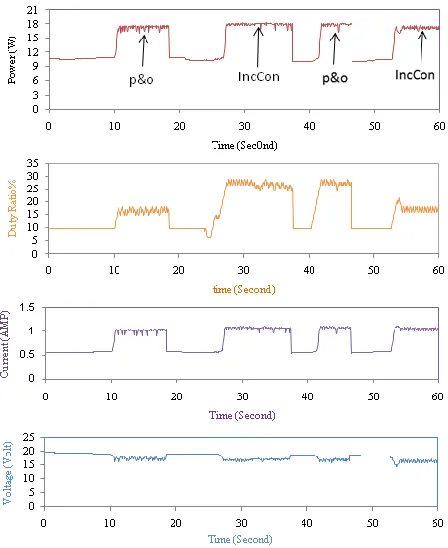
[image:9.612.64.298.251.333.2]Performance of the P&O and IncCon MPPT algorithms under fixed temperature and under different conditions of irradiation levels is shown in Fig. 16. The experimental results of PV panel operating power for experiment time for more than 50 second, the irradiation level has decreased at time 23 second then increased at time 38 second at constant temperature of 30oC. It can be noted that the P&O algorithm can't accurately track the MPP. However the IncCon algorithm is succeed to track the MPP accurately. The IncCon algorithm gives less oscillation than the P&O algorithm.
Fig. 16 Output power for different algorithms under change in irradiation and constant temperature
Performance of Output power, current, voltage and temperature with time using different loads under constant value of temperature and irradiation is shown in Fig. 17. From results it can be seen that IncCon algorithm shows less oscillating and better stable operating point than P&O.,
Fig.17. Output power, current, voltage and temperature with time using different loads under constant value of Temperature and Irradiation
VII. CONCLUSIONS
This paper proposed the maximum power point tracking using P&O and IncCon algorithms based on PIC18F452 microcontroller for tracking of the maximum power generation from PV system. Proposed P&O and IncCon algorithms are implemented and tested under different irradiation, temperature and loads, and the test results are analyzed and compared. The results show the performance of the IncCon algorithm in tracking MPP is better than the P&O algorithm and the experimental results of IncCon algorithm indicate that the feasibility and improved functionality of the system with high-efficiency.
References
[1] Basil M. Hamed, Mohammed S. El-Moghany ,“Fuzzy Controller Design Using FPGA for Photovoltaic Maximum Power Point Tracking”, (IJARAI) International Journal of Advanced Research in Artificial Intelligence, Vol. 1, No. 3, 2012
[2] Mitulkumar R. Dave, K.C.Dave, “Analysis of Boost Converter Using PI Control Algorithms”, International Journal of Engineering Trends and Technology- Volume3Issue2- 2012
[3] T.Chaitanya, Ch.Saibabu, J.Surya Kumari,” Modeling and Simulation of PV Array and its Performance Enhancement Using MPPT (P&O) Technique”, International Journal of Computer Science & Communication Networks,Vol 1(1),September-October 2011
[4] Ahmad Saudi Samosir et. al., “Simulation and Implementation of Interleaved Boost DC-DC Converter for Fuel Cell Application”, International Journal of Power Electronics and Drive System (IJPEDS) Vol.1, No.2, December 2011, pp. 168~174 , ISSN: 2088-8694. 126-671-1-PB.pdf
[5] UmaShankar Patel , Ms. Dhaneshwari Sahu, Deepkiran Tirkey, “Maximum Power Point Tracking Using Perturb & Observe Algorithm and Compare With another Algorithm”, International Journal of Digital Application & Contemporary research, Volume 2, Issue 2, September 2013
[6] C. Liu, B. Wu and R. Cheung, “Advanced Algorithm For MPPT Control of Photovoltaic Systems”, Canadian Solar Buildings Conference, Montreal, August 20-24, 2004
[7] W. Xiao, W.G. Dunford, “A modified adaptive hill climbing MPPT method for photovoltaic power systems,” in Conf. Rec. 2004 IEEE Annu. Power Electronics Specialists Conf.(PESC’04), vol.3, pp. 1957-1963, Jun. 2004.
[8] T. Noguchi, S. Togashi, et al., “Short-current pulse-based maximum-power-point tracking method for multiple photovoltaic- and-converter module system,” IEEE Trans. Ind. Electron., vol. 49, pp. 217-223, Feb. 2002.
[9] C. Hua, C, Shen, “Comparative study of peak power tracking techniques for solar storage systems,” in 1998 Proc. IEEE Applied Power Electronics Conf. and Expo., (APEC’98), pp. 697-685, 1998.
[image:9.612.62.286.424.698.2]International Journal of Emerging Technology and Advanced Engineering
Website: www.ijetae.com (ISSN 2250-2459,ISO 9001:2008Certified Journal, Volume 4, Issue 5, May 2014)401
[11]A. Torres, F. Antunes, F. Reis, “An artificial neural network-based real time maximum power tracking controller for connecting a PV system to the grid,” in 1998 Proceeding, IEEE Annual Conf. Industrial Electronics Society (IECON’98), vol.1, pp. 554-558, Aug.-Sept. 1998
[12]D. P. Hohm, M. E. Ropp, “Comparative Study of Maximum Power Point Tracking Algorithms Using an Experimental, Programmable, Maximum Power Point Tracking Test Bed”, 0-7803-5772-8/00,IEEE,2000, 1699-1702.
[13]N. Pongratananukul and T. Kasparis, “Tool for Automated Simulation of Solar Arrays Using General-Purpose Simulators,” in IEEE Conference Proceedings, (0-7803-8502-0/04), 2004, 10-14.
[14]Trishan Esram, and Patrick L. Chapman, “Comparison of Photovoltaic Array Maximum PowerPoint Tracking Techniques,‟ IEEE Transactions on Energy Conversion, 22 (2), 2007, 439-449.
[15]Hairul Nissah Zainudin, Saad Mekhilef, „Comparison Study of Maximum Power Point Tracker Techniques for PV Systems,‟ Proc. 14th International Middle East Power Systems Conference (MEPCON‟10), Cairo University, Egypt, 2010, 750 -755.
[16]I.William Christopher and R.Ramesh, “Comparative Study of P&O and InC MPPT Algorithms”, American Journal of Engineering Research (AJER) , e-ISSN : 2320-0847 p-ISSN : 2320-0936, Volume-02, Issue-12, pp-402-408
[17]Ali Chermitti , Omar Boukli-Hacene , Bencherif Mohamed , “Improvement of the “Perturb and Observe” MPPT Algorithm in a Photovoltaic System under Rapidly Changing Climatic Conditions”, International Journal of Computer Applications (0975 – 8887), Volume 56– No.12, October 2012
[18]A. Luque and S. Hegedus, “Handbook of Photovoltaic Science and Engineering”, John Wiley & Sons Ltd, 2003
[19]Ahmed M. Kassem, “MPPT control design and performance improvements of a PV generator powered DC motor-pump system based on artificial neural networks”, Elsevier Ltd, Electrical Power and Energy Systems43, pp. 90–98, 2012
[20]Enslin JHR, Wolf MS, Snyman DB, Sweigers W. “Integrated photovoltaic maximum power point tracking converter”. IEEE Trans. Ind. Electron, vol. 44, no. 6, pp. 769-773, 1997.
[21]B. Hasaneen, and Adel A. Elbaset, “Design and simulation of dc/dc boost converter,” 12th International Middle East Power System Conference, 12-15 Mar 2008, pp 335-340.
[22]Umashankar S. et. al. “Comparative Study of Maximum Power Point Tracking Algorithms with DC-DC Converters for Solar PV System”, International Journal of Electrical and Computer Engineering, ISSN 0974-2190 Volume 3, Number 1 (2011), pp. 11-20
[23]Mutoh, N.; Ohno, M.; Inoue, T.; , "A Method for MPPT Control While Searching for Parameters Corresponding to Weather Conditions for PV Generation Systems," Industrial Electronics, IEEE Transactions on , vol.53, no.4, pp.1055-1065, June 2006, doi: 10.1109/TIE.2006.878328.
[24]Hairul Nissah Zainudin and Saad Mekhilef (2010) “Comparison Study of Maximum Power Point Tracker Techniques for PV Systems” 14th International Middle East Power Systems Conference (MEPCON’10), Cairo University, Egypt,