Comparative Analysis of Outlier Detection Techniques
Kamal Malik
1H.Sadawarti
2, Member IEEE,
3Kalra G.S., Member IEEE
1Assistant Professor, MMICT&BM, MMU, Mullana, Haryana, India 2
Principal cum Director, RIMTIET (Affiliated to Punjab Technical University), Punjab, India 3
Asst. Professor, Lovely Professional University, Punjab, India
ABSTRACT
Data Mining simply refers to the extraction of very interesting patterns of the data from the massive data sets. Outlier detection is one of the important aspects of data mining which actually finds out the observations that are deviating from the common expected behavior. Outlier detection and analysis is sometimes known as outlier mining. In this paper, we have tried to provide the broad and a comprehensive literature survey of outliers and outlier detection techniques under one roof, so as to explain the richness and complexity associated with each outlier detection technique. Moreover, we have also given a broad comparison of the various methods of the different outlier techniques.
Keywords
Outliers, data mining, Clustering, Neural Network
1.
INTRODUCTION
Data Mining is a non-trivial method of identifying valid, novel, potentially useful and finally understandable patterns [1]. Now, data mining is becoming an important tool to convert the data into information. It is basically used in fraud detection, marketing and scientific discovery. Data mining actually refers to extracting the hidden interesting patterns from the large amount of datasets and databases [2]. Mining is basically used to uncover the patterns of the data, but this can be carried out on the sample of data. The mining process will be completely failed if the samples are not the good representation of the large body of the data. Moreover, the discovery of a particular pattern in a particular set of the data does not necessarily mean that the pattern is found elsewhere in the larger data from which that sample is drawn [3].One of the primary reasons of using the data mining is to effectively and efficiently analyze the collection of the various observations according to their behavior. In order to do so, clustering or cluster analysis is a very good alternative. Cluster analysis or clustering is the categorization of the set of observations lying under one cluster are different in some sense from the other cluster. It is an unsupervised learning technique which actually aims at finding out the dense and sparse regions in the dataset [4].Outlier detection is wonderful and a very crucial concept of data mining which is also referred as outlier mining. Outlier detection refers to the problem of finding out the patterns in the massive datasets that does not show the accordance with the generalized expected behavior. Most of the time, these anomalous patterns are termed as outliers, anomalies, discordant observations, fault, exceptions, surprise, contaminants [5]. Outlier detection has the direct applications in a wide variety of the domains such as intrusions, fraud detection in mobile phone industry and now days, it is also used for detecting the terrorism related activities. Clustering is a very effective method to find out various outliers, but only clustering is not sufficient for analyzing and the detection of outliers because whenever we are dealing with the large datasets and databases, the rare occurrences are not confined to the outliers rather they become higher dimensional outliers and to deal with
these higher dimensional outliers, scalable model based clustering is required where the clustering is scaled at the higher levels, so as to develop the methods for handling large databases, within the limited computational resources such as memory and computation time. Moreover, in high dimensional space, the data is sparse and the notion of proximity fails to retain its meaningfulness. In fact, in high dimensional data, every point is an almost equidistant from each other. As a result, due to the minimum difference of the data points outlierness will become increasingly weak and undistinguishable. Consequently, for high dimensional data, the notion of finding meaningful outliers becomes substantially more complex and cumbersome. But at the same time, we cannot say completely that the outliers are the byproduct of clustering, however some of the previous literature has agreed to it or some of the researchers have agreed to it. According to them or their techniques outliers are the points that do not lie within the cluster, thus, these techniques implicitly define the outliers as the background noise in which the clusters are embedded but recent literature defines the outliers as the points that are neither a part of the cluster nor a part of the background noise; rather they are specifically the points that are very much different from the norm. [5].Sometimes, these outliers are so much interesting for us that they act as a guiding media to detect the various anomalies in the base datasets, (for example in network, intrusion detection). With the help of such outliers, we are very well capable of finding the noise or anomalies that are actually creating havoc for our data such outliers are also known as strong outliers [5].
2.
LITERATURE SURVEY
Outliers are the patterns of the data that do not comply with the general expected behavior. Consider the following fig1 below [6] the data has two normal regions N1and N2, so most of the observations lie in these two regions, points that are sufficiently far away from the regions; e.g., pts.O1, O2, and the points in O3, are the outliers.
[image:1.595.323.529.582.735.2]Although, it is very true that the outliers are present in the data because of some malicious activities like credit card fraud, cyber-intrusion or breakdown of the system but at the same time, they are very interesting to the analyst and the interestingness or real life relevance of the outliers is a key feature of outlier detection. As it is really interesting to the analyst, so we cannot compare it with noise removal [6] and noise accommodation both of which deal with the unwanted noise. Noise can be termed as a hindrance in the data analysis so it is not required in the data. Noise removal is driven by the need to remove the unwanted objects before any data analysis is performed on the data. Noise Accommodation refers to immunizing statistical model estimations against anomalous observations. Novelty detection is also an emerging concept that is sometimes mingled with outlier detection, but it is somewhat finding out the novel data and it should not be confused with outlier detection [7].It really seems very simple that outliers are the observations that are deviating from their normal or expected behavior, it’s very easy to visualize them, but in reality it is not a simple task. There are many difficulties to define the normal behavior or a normal region so as to make the outliers more prominent. These difficulties are as [6]:
To include and to cover the every possible normal behavior in the region itself is a tedious task.
As there is a thin line between the outlying region and normal region, so, sometimes the observations lying in the normal region are considered as outliers and vice-versa.
Novel data and Noise are present in the data which tends to be similar to the actual data and hence difficult to distinguish them from outliers, and further to remove them.
Moreover, which technique would be applied to remove a particular type of outlier is again a very difficult task. So, these are some of the aspects not really makes the outlier detection.
2.1 Various Factors Determining the
Outlier Detection Problem:
As outlying observations seems very interesting to us, so the detection of outliers also become a very important point, there are several factors that determine how to formulate an outlier detection problem –
Fig2. Key Component Associated with Outlier Detection
Techniques [6]
2.1.1 Nature of Input Data
The important factor of any outlier detection is to know about the input data. Input is generally a collection of data instances and each data instance can be described in terms of attributes which can be further referred as variable, characteristic feature etc. Each data instance, if consists of only one variable, then it is known as univariate and if it consists of more than one variable then it is multivariate. In case of multivariate, data instances, all attributes might be of same type or might be the mixture of different data types. We can have different types of input data such as continuous data, categorical data, spatial data, so depending upon the nature of the data, we can apply the particular outlier detection technique [8].
2.1.2 Types of Outlier
An important aspect of an outlier detection technique is to study the nature and type of the outliers. Outliers can be categorized into the following five categories –
Type – A (Point Outliers), Type–B (Contextual Outliers), Type – C (Collective Outliers), Type – D (Real Outliers),Type – E (Erroneous Outliers).
Type-A (Point Outliers):- If an individual data instance can be considered as anomalous with respect to the rest of the data, then the instance is termed as a point outlier. It is one of the simplest forms of outliers and is the key focus of majority of research in outlier Detection [9]. For example : If we consider the credit card fraud detection with the dataset, corresponding to an individual’s credit card , then the transaction for which the amount spent is very higher compared to the normal range of expenditure for that person is termed as an outlier[10].
the contextual outliers include the time series data too [10], here the time is a contextual attribute which determines the position of an instance on the entire sequence, then it is usually called as the type B–Outliers. The choice of applying a contextual outlier detection technique is determined by the meaningfulness of the contextual outliers in the largest application domain. Applying a contextual outlier detection technique makes sense, if contextual attributes are readily available and therefore defining a context is straightforward. Type – C (Collective Outliers):- If an individual data instance is not anomalous but its collection with the entire dataset is anomalous, then it is termed as a collective outlier, the individual data instances which are termed as collective outlier may not be the outlier themselves but their occurrence together as a collection is anomalous, hence it is a collective outlier [11].
Collective outliers have been explored for sequence data [12] graph data [13] and spatial data [14]. It should be noted that while point outliers can occur in any data set, in which the data instances are related. In control, occurrence of the contextual outliers depends on the availability of the context attributes in the data. A point outlier or a collective outlier can also be contextual outlier, if analyzed with respect to a context. Thus, the point outlier detection problem can be transformed to a contextual outlier detection problem by incorporating the context inform action [12].
Type – D (Real Outliers):
These are the real outlying observations which are of interest to the system analyst. These observations do have some interestingness that helps to find the analyst something new and innovative and if they are removed anyhow, we are completely left with the normal region but this does not mean
at all that we are comparing them with noise or novel data. They can’t be regarded as noise rather they are the real outliers [12].
Type – E (Erroneous Outliers):
If some observation is noted incorrectly as an outlier, due to some inherent problem, or some catastrophic failure, then these are by mistake outliers or we can say illusive outliers. They really take the outcome of the data in some other way.
2.1.3 DATA LABELS (Fundamentals Approaches
of the Outlier Detection)
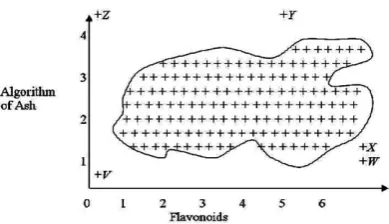
[image:3.595.63.258.530.642.2]
Fig 3. Shows the normal region and indicating V,W,X,Y,Z as outliers
The labels usually associated with the data instances indicates the normal behavior of the data or the anomalous behavior of expert and hence requires substantial effort to obtain the labelled training data set.
(i) Supervised Outlier Detection
Techniques trained in a supervised mode assume the availability of the training data set which has labelled
instances for the normal as well as the outlier class. Any unseen data instance is compared against the model to determine which class it belongs to. But there are two major issues that may arise in supervised outlier detection; first, the anomalous instances are few, as compared to the normal instances, in the training data. Secondly, obtaining accurate and representative labels, especially, for the outlier class is usually challenging [15][16]. Moreover there are many techniques that inject artificial outliers in a normal dataset to obtain a labelled training data set.
(ii) Semi Supervised Outlier Detection:
Techniques which are operating in a semi supervised mode, assume that the training data has the labelled instances, only for the normal class. Since they don’t require labels for the outlier class, they are more widely used as compared to the supervised techniques. For example, in space craft fault detection [17], an outlier scenario will definitely be an accident, which is not easy to model .The typical approach used in such techniques is to build a model for the class corresponding to the normal behavior, and then use the model to identify outliers in the test data.
(iii) Unsupervised Techniques:
Unsupervised outlier detection techniques do not require training data, and thus are most widely applicable. The techniques in this category make the implicit assumption, that the normal instances are far more frequent as compared to the outliers, if this is not the case then, these techniques are not that much successful, and they suffer from the high false alarm rate [17][18].
In the remainder of this paper, we categorize the broadness, richness and complexities of the various outlier detection methodologies. We have tried to give the literature review of important outlier detection techniques such as Statistical Methods, Parametric and Non Parametric methods, Proximity Based Methods, Distance Based Methods, Density Based Methods, Clustering Methods and finally Neural Network techniques so as to detect and analyze the outliers, moreover ,we have given their comparison too.
2.2 Statistical Methods
Statistical methods are one of the earliest algorithms or the models that can be used by the various outlier detection methodologies [19]. They are widely used not only to detect the outlying observations, rather to analyze them so as to study the complete dataset based on them. One of the single dimensional univariate method is Grubb’s method which is Extreme Studentized Deviate [20] which calculates a Z Value as the difference between the mean value of the attribute and the query value divided by the standard deviation for the attribute where the mean and standard deviations are calculated from all attribute values including the query value and Z value for the query is compared with the 1% or 5% significance level [21]. Moreover, this technique does not require any parameters from the user as all the parameters are directly derived from the data itself. But if we want to pinpoint the outliers for both the univariate and multivariate then according to Laurikkala et al, [22] use informal box plots.
Fig3. A Data Distribution with 5 outliers (V, W, X, Y and Z) [23].
ordinal and categorical attributes box plots a lot the lower extreme, lower quartile, median, upper quartile and upper extreme points. In order to understand this, consider the figure 3. Here, in figure 3 above [23], we are having a normal region, and the points V, Z, Y, X, W, are the outliers which are shown beyond the normal region, in order to show this thing in informal box plot, we will show it as in fig 4 below
Fig 4. Informal box plot showing the outliers V,Y,Z [23]
Figure 4 shows a box plot of the Y- axis values for the data in Fig-3 with the lower extreme, the lower quartile, median, upper quartile and upper extreme from the normal data and the three outliers V, Y and Z plotted the points X and W from Figure-2 are not outliers with respect to the Y-axis values.
Box plots make no assumptions about the data distribution model but are reliant on a human to note the extreme points plotted on the box plot. There arises a problem when the dimensionality increases, the data points are spread through the larger volumes and become less dense, this problem is known as the curse of dimensionality which further increases the processing time and distorts the data distribution by spreading the convex hulls. However, there are many techniques like k-N.N, Neural Networks, MVE i.e., Minimum volume Ellipsoid etc. that are very much susceptible to the curse of dimensionality. These are basically the feature selection techniques that are used essentially to remove the noise from the data distribution and focus on the main cluster of the normal data points while isolating the outliers [23].
2.3 Proximity Based Techniques
Proximity Based Techniques do not require any prior assumption about the data – distribution and they are comparatively simple to implement although they are computationally very complex as they usually suffer from the exponential computational growth. The computational complexity is directly proportional to both the dimensionally of the data m and the number of the records n. Basic idea in the Proximity Based Techniques is to model the outliers as point which are isolated from the remaining data. This technique basically includes three very important methods – nearest neighbor analysis. k-NN i.e., K Nearest Neighbor [23] [24] method used which is also known as instance – based learning or lazy learning is used for classifying the objects based on closest training examples in the feature space. It is only approximated locally and all the computation usually calculates the nearest neighbors of a record using a suitable distance metric known as Euclidean Distance and can be given by equation-1
and is simple the vector distance whereas the Mahalanobis distance is given by equation 2
……… (2)
calculate the distance from a pt. to the centroid (M) defined by correlated attributes given by the covariance matrix (C). for large and higher dimensional datasets, Mahalonobis distance is computationally very expensive as it requires a pass through the entire data set to identify the attribute co-relation.
In case of the clustering methods, which is another proximity based method clustering algorithms are made in order to determine – the dense regions of the data set. In the next step, some metric to measure the fit of the data points to the different clusters is used in order to compute an outlier score for the data point, for example, while using k-means algorithm, the distance of the data point to the nearest centroid may be used to measure its anomalous behavior one of the difficulties with the clustering algorithms is that they implicitly assumes the specific kinds of cluster shakes depending upon the specific algorithm or distance function used within the clustering algorithm [24].Density based methods provide a higher level of interpretability, when the sparse regions in the data can be presented in terms of combinations of the original attribute. We will discuss the clustering and density based methods further in this paper.
2.4 PARAMETRIC TECHNIQUES
Parametric methods scale themselves very well in case of the various modifications and optimizations done in the standard algorithms. Moreover, the models using the parametric techniques grow only with the model complexity not the data size. However, they limit their applicability by enforcing the preselected distribution model to fit the data. If the user is already aware about their data fits such a distribution model, then these approaches are highly accurate but many data sets do not fit a particular model [25].
2.5 NON-PARAMETRIC METHODS
:
The outlier detection techniques in this category do not make any assumptions about the statistical distribution of the data. The most important approaches for outlier detection in this category are histograms and Kernel Density Function or Kernel Feature Space [27] Methods.Histograms:
It is one of the most popular techniques of Non-Parametric method which is basically used to maintain a profile of the data. Histogram techniques by nature are based on the frequency or counting of the data. The histogram based outlier detection approach is typically applied when the data has a single feature. Mathematically, a histogram for a feature of data consists of a number of disjoint bins (or buckets) and the data are mapped into one bin. The height of the bin corresponds to the number of observations that fall into the bins [23] [28]. Thus, if n be the total no. of instances, k be the total number of the bins and mi be the number of the data point in the ith bin(1≤i≤k ) the histogram satisfies the following condition
The histogram techniques typically define a measure between a new test instance and the histogram based profiles determine if it is an outlier or not. Specifically, there are three possible ways for building a histogram.
Histogram construction is only based on the normal data. They are used only for representing the profile of the normal data. The test stage basically evaluates whether the feature value in the test instance falls in any of the populated bins of the constructed histograms. If not the test instance is labelled as an outlier [28].
Secondly, the histograms can be constructed based upon the outliers. As such, the histograms capture the profile for the outliers. A test instance that falls into one of the populated bins is labeled as an outlier [28]. Such techniques are particularly popular in intrusion detection community and fraud detection.
The histogram can be constructed based on a mixture of the normal data and the outliers. Since normal data typically dominate the whole data set, thus the histogram represents an approximated profile on the normal data. The sparsity of the bin in the histogram can be defined as the ratio of the frequency of the bin against the average frequency of all the bins in the histogram. A bin is considered as sparse if such ratio is lower than the user specified threshold [28].
As the histogram based detection methods are simple to implement and hence are quite popular in domain such as intrusion detection. But one important shortcoming of such techniques for multivariate data is that they are not able to capture the interactions between attributes. An outlier might have the attribute values that are individually frequent, but their combination is very rare. Another problem with the histogram is that users need to determine an optimal size of the bins to construct the histogram.
Kernel Function
This is another very popular non-parametric approach for the outlier detection [29] this involves using kernel functions. A new instance which lies in the low probability density area is declared as an outlier.Formally, if x1, x2……….xn are IID (incrementally and identically distributed) samples of random variable x2then the kernel density approximation of its probability density function [29] is
where k is the kernel function and h is the bandwidth (smoothing parameter). Quite offline k is taken to be the standard Gaussian function with mean h=0 and variance .σ2=1
K(x) =
Kernel density estimation of Probability Density Function (PDF) is applicable to both univariate and multivariate data. However, its estimation of a multivariate data is much more computationally expensive than the univariate data. This renders the kernel density estimation methods rather inefficient in outlier detection for high dimensional data [28] [29].
The major differences between the parametric and non-parametric methods is that former assume the underlying distribution of the given data and estimate the parameters of the distribution model from the given data while the later do not assume any knowledge of distribution characteristics [29]
2.6. Distance Based Methods
Distance based outlier techniques are one of the most widely accepted and frequently used techniques that are used in machine learning and data mining and it completely depends on the concept of local neighbourhood (KNN) of the data points[30]. This concept can also be termed as Nearest Neighbor Analysis and it can also be applied for different purposes such as classification, clustering and most importantly outlier detection. The most significant feature of the nearest neighbor based outlier detection technique is that they have an explicit notion of proximity that is defined in the form of a distance and similarity measure for any of two individual data instances, or a set or a sequence of instances. Firstly, in distance based methods, distance between the data points must be computed with the help of Lp metrics, like
Manhattan distance and Euclidean distance metrics for measuring the distance, some non-metric distance functions are also used for making the distance based definitions of outliers very general. For sequences, a distance metric between two sequences need to be defined. For Spatial data, Kou et al [2006] incorporate spatial correlation between data points while determining the distance [31] [32]. A distance measure can be used for the data containing the mixture of categorical and continuous attributes for outlier detection. The links between the two instances can be defined by adding distance for categorical and continuous attributes separately. For categorical attributes, the no. of the attributes for which the two instances have the same values defines the distance between them. For continuous attributes, a Covariance matrix is maintained to capture the dependencies between the continuous values [33]. Secondly, there is a problem that how one can declare an instance as an outlier. This can be done by categorizing the nearest neighbor based outlier detection technique into two categories based on how the outliers are measured with respect to the nearest neighbors. The first category consists of those techniques which measures the distance of an instance from it’s nearest neighbor set and apply the different tests to detect the outliers such as the instance is more than the distance d from its closest point or the distance is more than the distance d from its closest neighborhood.[34].
the distance based methods scale better to higher dimensional space and can be computed more effectively and efficiently as compared to the statistical methods.
2.7 Density Based Outlier Detection
Methods
Density based methods use more complex mechanism or computationally more complex to model the outlierness of the data points as compared to the distance based methods. It not only finds out the local densities of the point being studied but also the local densities of its nearest neighbors. Although the density based methods signifies a stronger modeling capabilities of the outlier, yet they require the expensive computations at the same time. [28] [35]
[image:6.595.65.266.563.709.2]The basic idea of LOF method is that, the distribution of distances between a data points and all other points will look similar to the cumulative distance distribution for all pair-wise distances if there are many other close-by points. This is an indirect way of detecting outliers. There might be points that are true outliers and for which the peaks in their distance distribution might match the peaks in the cumulative distribution. An outlier score can be assigned to any given data point, known as Local Outlier Factor (LOF), depending on its distance from its local neighborhood [34]. Thus this scheme finds the local outlier score of any data point and is not affected by the variations in the density of distribution of the data. The advantage of LOF over the simple nearest neighbor approach proposed by Ramaswamy et al. [2000], [36] is LOF of an object reflects the density contrast between its density and those of its neighborhood [36]. The lower the density of p or higher the density of p’s neighbor, the larger the value of LOF which indicates that p has a higher degree of being an outlier. Most of the time LOF misses the potential outliers whose local neighborhood density is very close to that of its neighbors To overcome this problem, a new connectivity based outlier factor (COF) scheme that improves the effectiveness and efficiency of LOF scheme when the pattern itself has similar neighborhood density as an outlier[37][38] So, In a net shall, we can say that although the density based methods are computationally more complex and expensive as compared to the distance based methods but still they are far better in a sense that the density based methods investigates not only the local density of the point being studied but also the local densities of the nearest neighbors. Moreover, it can be further scaled to the higher dimensional data more easily, effectively and efficiently.
Fig 5. : A sample dataset showing the advantage of LOF over Distance based Methods for outlier detection [39]
2.8 Clustering Based Methods
The very important and frequently used category of outlier detection methodology that is usually used for relatively low
dimensional data is the Clustering. In the literature survey we have observed that so many data mining algorithms find the outliers as a byproduct of clustering themselves and they define the outliers as the points that do not lie in or located far away from the cluster. Partitioning Clustering Method is the first category of clustering methods that performs clustering by partitioning the data set into the specific no. of clusters .The no. of the clusters to be obtained is denoted by k, is specified by human users. It usually starts with the initial position and then the objective function is optimized until the data set maximizes the optimal value of the data set. In the Partitioning methods, various centroid based methods, mediods based methods, PAM, CLARA, k-means, and CLARANS etc. methods are used [39]. Another important category of clustering method is hierarchical clustering. In hierarchical clustering, the whole data set is further decomposed into various subsets or small datasets. Hierarchical clustering is further divided into two categories i.e., Agglomerative methods and divisive methods. An Agglomerative method usually starts with each point as a distinct cluster and it combines two closest clusters in each consecutive step until the threshold condition is met [39]. A divisive method, contrary to an agglomerative method, begins with all the points as a single cluster and splits it in the next consecutive step until the threshold condition is met. Agglomerative methods are more popular in use. [37][39]. Various Hierarchical Methods are MST clustering, CURE and CHAMALEON. Moreover, in very large databases, BIRCH [40], is used and it can be enhanced for higher dimensional data.
[43] for detecting credit card fraud and for image sequence data [44]. The NNID system trains a back propagation network on the normal training data (a set of user commands) to identify the users who execute those commands. During testing a test instance is classified to belong to one of the learnt user profiles, if the output user does not match the actual user who generated the command, it signifies an intrusion. This is a kind of supervised approach where each training instance has an associated class label. Usually, the comparison of the performances is done on these fine different neural networks. – Perceptron, Back Propagation, Perceptron Back Propagation Hybrid Radial Based function (RBF) and ARTMAP. Moreover, there is a database mining
system known as Cardwatch [45] that is used for credit card fraud detection and is based on neural network learning modules, and it provides an interface to a variety. So, Neural Networks are really helpful in detecting and removing the outliers.
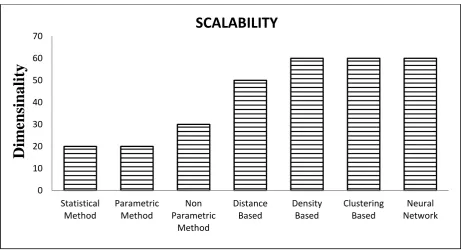
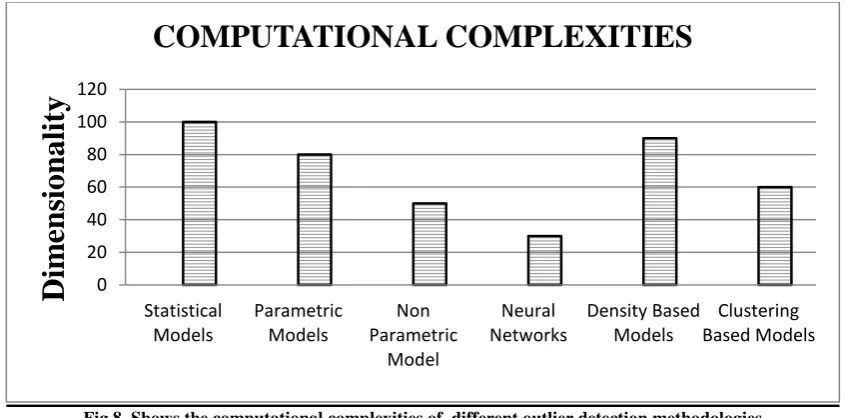
All these methods are analyzed and compared in the table1 and fig6 shows the variation of Efficiency with dimensions for all the methods. Moreover, fig7 and fig 8 shows the variation of scalability and computational complexity with the dimensions respectively for all the methods.
.
Table1 Comparison of Outlier Detection Methodologies
Methodology used Computational Complexity
Efficiency H.D.D Feature
Space
Practical Applicability
Ordinary data Streams
Statistical Methods
Very Complex Less Not Applicable Univariate Statistical Data Applicable
Parametric Method
Less Complex More Not Applicable Univariate Data sets with prior Knowledge
Applicable
Non parametric Method
Less Complex Efficient Not Applicable Univariate/ Multivariate
profile of the data is maintained
Applicable
Distance based method
Easy Efficient Scalable Multivariate Based on closeness of individual points
Not Applicable
Density based method
Very Complex More Efficient Effectively scalable
Multivariate Based on the closeness of points and nearest neighbor too
Not Applicable
Clustering based methods
Less Complex Very Efficient Effectively Scalable
Univariate/ Multivariate
Based on the clustering of similar data
Depends on the cluster
Neural Networks Very Less Very Efficient Effectively Scalable
Multivariate Applied on the normal training data
Fig 6 Shows the Effeciency of various outlier methodologies with the increase in dimensionality
Fig 7 Shows the scalability of the different outlier detection methodologies with the increase in dimensionality 0
20 40 60 80 100 120 140 160
Statistical Parametric Methods
Non Parametric
Methods
Distance Based
Density Based
Clustering based
Neural Network
Dim
ensiona
lit
y
EFFICIENCY
0 10 20 30 40 50 60 70
Statistical Method
Parametric Method
Non Parametric
Method
Distance Based
Density Based
Clustering Based
Neural Network
Dim
ensina
lity
[image:8.595.67.529.402.652.2]Fig 8. Shows the computational complexities of different outlier detection methodologies
3.
CONCLUSION
In this paper,it has emphasized that there is no universally accepted gamut of any methodology to detect and analyse the outliers.However, the diversity, multiplicity and the comparative overview of all the outlier detection methodologies are tried to accommodate in this paper .Moreover, different ideologies of different researchers about various outlier detection methodologies are collectively organised under one roof so as to provide the comprehensive overview of these techniques which are very benificial if further algorithms are made on these techniques.
4.
REFERENCES
[1] Aggarwal, C. C., Yu, S. P., "An effective and efficient algorithm for high-dimensional outlier detection, The VLDB Journal, 2005, vol. 14, pp. 211-221.
[2].Abe, N, Zadrozny, B, and Langford, J. 2006.Outlier detection by active learning. In Proceedings of the 12th ACM SIGKDD International Conference on Knowledge Discovery and Data Mining. ACM Press, New York, NY, USA, 504 - 509.
[3]. Arning, A., Agrawal, R., and Raghavan, P.: 1996, ‘A Linear Method for Deviation Detection in Large Databases’. In: Proceedings of the ACM SIGKDD
[4]. S. Vijayarani : [An Efficient clustering Algorithm, for outlier Detection IJCA,vol 32 oct,2011].
[5] Charu C. Aggarwal, Phillip S. Y, An effective and efficient algorithm for higher dimensional outlier detection.
[6]. Karanjeet Singh and Dr. SuchitraUpadhyay. Outlier Detection: Applications and Techniques IJCSI International Journal of Computer Science Issues, Vol. 9, Issue 1, No 3, January 2012 ISSN (Online): 1694-0814
[7] Brother ton, T., Johnson, T., and Chadderdon, G.: 1998, ‘Classification and Novelty Detection using Linear Models and a Class Dependent - Elliptical Bassi Function Neural Network ’. In: Proceedings of the International conference on neural networks. Anchorage, Alaska.
[7]. Barnett, V. and Lewis, T.: 1994, Outliers in Statistical Data. John Wiley & Sons.3rd edition.
[8] V. Chandola, A. Banerjee, and V. Kumar. Outlier Detection-A Survey, Technical Report, TR 07-017, Department of Computer Science and Engineering, University of Minnesota, 2007.
[9]. Dorronsoro, J. R., Ginel, F., Sanchez, C., and Cruz, C.S. 1997. Neural fraud detection in credit card operations.IEEE Transactions On Neural Networks 8, 4 (July), 827 -834.
[10]. Keogh, E., Lin, J., and Fu, A. 2005. Hot sax: Effciently finding the most unusual time series subsequence. In ICDM '05: Proceedings of the Fifth IEEE International Conference on Data Mining. IEEE Computer Society, Washington, DC, USA.
[11]. Teng, H., Chen, K., and Lu, S. 1990. Adaptive real-time outlier detection using inductively generated sequential patterns. In Proceedings of IEEE Computer Society Symposium on Research in Security and Privacy.IEEE Computer Society.
[12]. Sun, P,Chawla, S., and Arunasalam, B. 2006. Mining for outliers in sequential databases.In SIAM International Conference on Data Mining.
[13] Noble, C. C. and Cook, D. J. 2003. Graph- outlier detection. In Proceedings of the 9th ACM SIGKDD international conference on Knowledge discovery and data mining. ACM Press, 631 - 636.
[14]. Ester, M., Kriegel, H-P., and Xu, X.: 1996, ‘A Density-Based Algorithm for Discovering Clusters in Large Spatial Databases with Noise’. In: Proceedings ofthe Second International Conference on Knowledge Discovery and Data Mining,Portland, Oregon, pp. 226– 231. AAAI Press.
[15]..Theiler, J. and Cai, D. M. 2003. Resampling approach for outlier detection in multispectral images.In Proceedings of SPIE 5093, 230-240, Ed.
[16].Steinwart, I., Hush, D., and Scovel, C. 2005. A classification framework for outlier detection. Journal of Machine Learning Research 6, 211 – 232
[17].Fujimaki, R.,Yairi, T., and Machida, K. 2005. An approach to spacecraft outlier detection problem using kernel feature space.In Proceeding of the eleventh ACM
0 20 40 60 80 100 120
Statistical Models
Parametric Models
Non Parametric
Model
Neural Networks
Density Based Models
Clustering Based Models
Dim
ensio
na
lity
SIGKDD international conference on Knowledge discovery in data mining. ACM Press, New York, NY,
[18] Bolton, R. J. and Hand, D. J.: 2001, ‘Unsupervised Profiling Methods for Fraud Detection’. In: Credit Scoring and Credit Control VII, Edinburgh, UK, 5-7 Sept.
[19]. Barnett, V. and Lewis, T.: 1994, Outliers in Statistical Data. John Wiley & Sons.3rd edition.
[20]. Huber, P. 1974. Robust Statistics.Wiley, New York.
[21] Grubbs, F. E.: 1969, ‘Procedures for detecting outlying observations in samples’Technometrics11, 1– 21.Hickinbotham, S. and Austin, J.: 2000, ‘Novelty detection in Airframe Strain Data’. In: Proceedings of 15th International Conference on Pattern Recognition. Barcelona, pp. 536–539
[22]. Laurikkala, J., Juhola, M., and Kentala, E.: 2000, ‘Informal Identification of Outliers in Medical Data’. In: Fifth International Workshop on Intelligent Data Analysis in Medicine and Pharmacology IDAMAP-2000 Berlin, 22 August. Organized as a workshop of the 14th European Conference on Artificial Intelligence ECAI-2000.
[23] Hodge, V. and Austin, J. 2004. A survey of outlier detection methodologies.Artificial Intelli-gence Review 22, 2, 85.
[24]. Byers, S. and Raftery, A. E.: 1998, ‘Nearest Neighbor Clutter Removal for Estimating Features in Spatial Point Processes’. Journal of the American Statistical Association 93(442), 577–584.
[25] V. Chandola, A. Banerjee, and V. Kumar. Outlier Detection-A Survey, Technical Report, TR 07-017, Department of Computer Science and Engineering, University of Minnesota, 2007.
[26]. Rousseeuw, P. J. and Leroy, A. M. 1987. Robust regression and outlier detection. John Wiley & Sons, Inc. New York, NY, USA.
[27] Fujimaki, R, Yairi, T., and Machida, K. 2005. An approach to spacecraft outlier detection problem using kernel feature space. In Proceeding of the eleventh ACM SIGKDD international conference on Knowledge discovery in data mining. ACM Press, New York, NY,
[28].Ji Zhang: A doctoral thesis titled as” Towards Outlier Detection For High-Dimensionaldata Streams Using Projected Outlier Analysis”.
[29]. E. Parzen. On the estimation of a probability density function and mode. Annals of Mathematical Statistics 33, 1065-1076, 1962.
[30] W. Jin, A. K. H. Tung, J. Han andW.Wang: Ranking Outliers Using Symmetric Neighborhood Relationship. PAKDD’06, 577-593, 2006
[31].Knorr, E. M. and Ng, R. T.: 1998, ‘Algorithms for Mining Distance-Based Outliers in Large Datasets ’. In: Proceedings of the VLDB Conference. New York, USA, pp. 392–403.
[32] Y kou,CT Lu,RF Dos Santos-Spatial outlier Detection- a graph based approach published in Tools with Artificial Intelligence 2007, ICTAI 2007,19th IEEE International Conference on Volume 1
[33] A descriptive framework for the field of data Mining and Knowledge discovery by Yi Peng, Gang Kou, Yong SHI, and ZHENGXIN CHEN.
[34].M. Breuning, H-P. Kriegel, R. Ng, and J. Sander. LOF: Identifying Density-Based Local Outliers. In Proc. of 2000 ACM SIGMOD International Conference on Management of Data (SIGMOD’00), Dallas, Texas, pp 93-104, 2000.
[35].Zhang doctoral thesis titled as “Towards outlier detection for high-dimensional data streams using projected outlier analysis strategy”.
[36].Ramaswamy, S., Rastogi, R., and Shim, K. 2000. Efficient algorithms for mining outliers from large data sets.In Proceedings of the 2000 ACM SIGMOD international conference on Management of data.ACM Press, 427.
[37].Charu C. Aggarwal, Phillip S. Y, An effective and efficient algorithm for higher dimensional outlier detection.
[38]. J. Zhang, M. Lou, T. W. Ling and H.Wang. HOS-Miner: A System for Detecting Outlying Subspaces of High-dimensional Data. VLDB Conference, 2004.
[39].Ajay Challagalla, S.S. Shivaji, Dhiraj, DVLN Somayajulu, Toms Shaji Mathew,SauravTiwari, SayedSharique Ahmed “Privacy preserving outlier detection using hierarchical clustering Methods, 2010 34th Annual IEEE Computer Software and Application Conference Workshops
[40] T. Zhang, R. Ramakrishnan, and M. Livny. BIRCH: An Efficient Data Clustering Method for Very Large Databases. In proceedings of the 1996 ACM International Conference on Management of Data (SIGMOD’96), pages 103-114,Montreal, Canada, 1996.
[41] E. Eskin, A. Arnold, M. Prerau, L. Portnoy and S. Stolfo. A Geometric Frame-work for Unsupervised Anomaly Detection: Detecting Intrusions in UnlabeledData. Applications of Data Mining in Computer Security, 2002.
[42]. Caudell, T. P. and Newman, D. S.: 1993, ‘An Adaptive Resonance Architecture toDefine Normality and Detect Novelties in Time Series and Databases’. In: IEEE World Congress on Neural Networks, Portland, Oregon. pp. 166–176.
[43]. Roberts, S. and Penny, W. 1996. Novelty, confidence and errors in connectionist systems.In Proceedings of IEEE Colloquium on Intelligent Sensors and Fault Detection.Savoy place, London, 261.
[44]. Crook, P. and Hayes, G.: 1995, ‘A Robot Implementation of a Biologically Inspired Method for Novelty Detection’. In: Proceedings of TIMR-2001, Towards Intelligent Mobile Robots. Manchester.
![Fig 1. A simple example of outliers in a 2-dimensional data set [6]](https://thumb-us.123doks.com/thumbv2/123dok_us/8039247.770975/1.595.323.529.582.735/fig-a-simple-example-outliers-dimensional-data-set.webp)
![Fig 4. Informal box plot showing the outliers V,Y,Z [23]](https://thumb-us.123doks.com/thumbv2/123dok_us/8039247.770975/4.595.63.286.151.326/fig-informal-box-plot-showing-outliers-v-y.webp)
![Fig 5. : A sample dataset showing the advantage of LOF over Distance based Methods for outlier detection [39]](https://thumb-us.123doks.com/thumbv2/123dok_us/8039247.770975/6.595.65.266.563.709/sample-dataset-showing-advantage-distance-methods-outlier-detection.webp)