Future Proofing, Recording and Tagging
Historical Buildings: a Pilot Study in
Wales, UK
Counsell, J, Littlewood, J, Arayici, Y, Hamilton, A, Dixey, A, Nash, G and Richman,
A
Title
Future Proofing, Recording and Tagging Historical Buildings: a Pilot
Study in Wales, UK
Authors
Counsell, J, Littlewood, J, Arayici, Y, Hamilton, A, Dixey, A, Nash, G and
Richman, A
Type
Conference or Workshop Item
URL
This version is available at: http://usir.salford.ac.uk/11420/
Published Date
2008
USIR is a digital collection of the research output of the University of Salford. Where copyright
permits, full text material held in the repository is made freely available online and can be read,
downloaded and copied for noncommercial private study or research purposes. Please check the
manuscript for any further copyright restrictions.
Buildings: a Pilot Study in Wales, UK
John Counsell1, John Littlewood1,Yusuf Arayici2, Andrew Hamilton2, Andrew Dixey3, Gerallt Nash3, Andrew Richman4
1
University of the West of England, Frenchay Campus, Bristol, UK.
2
The University of Salford, Greater Manchester, UK.
3
Museum of Welsh Life, St Fagans, Cardiff, UK
4
The Environment Agency for England and Wales, Science Div., Bath, UK
Abstract
This paper discusses the process that follows the use of ground based laser scanning to record endangered heritage structures before rescue and reconstruction elsewhere. It addresses a possible workflow based on new and emerging technologies for the recording necessary to rescue buildings in danger before later reconstruction as part of a pilot project at the National Museum of Welsh Life (MWL) at St Fagan’s Castle, UK. It also discusses research currently being undertaken for the Virtual Environmental Planning (VEPs) project focused not just on the heritage site, but on automatically capturing the wider setting for sites repeatedly to keep the setting recognisably up to date and enable analysis of change over time.
The paper focuses on the value of a three-dimensional (3D) computer based record of a heritage site in producing an accurate visual representation of the analytical recording process and the subsequent decisions that affect the fabric of the building. Decisions on how and what to record will involve varying measures of subjective judgement of the relative values embodied in, or represented by, the building. In recent research it is becoming evident that some aspects of interpretation and significance of the component parts of the heritage site may be automatically assigned through pattern matching to potentially automatically acquired 3D data. This paper will be useful to professionals and stakeholders evaluating processes to future proof digitally recorded historical buildings and their components through tagging.
Hardware - Model Acquisition and Scanning; Methods and Applications - Computer Vision - Shape Recognition; Methods and Applications - Computer Vision – Tracking.
1. Introduction
This paper is about the process that follows the use of ground based laser scanning to record endangered heritage structures before rescue and reconstruction elsewhere. It addresses a possible workflow based on new and emerging technologies for the recording necessary for rescuing buildings in danger before later reconstruction used by the National Museum of Welsh Life (MWL) at St Fagan’s Castle, U.K. It also discusses research currently being undertaken for the Virtual Environmental Planning (VEPs) project focused not just on the heritage site, but on automatically capturing the wider setting for sites repeatedly to keep the setting recognisably up to date and enable analysis of change over time.
The paper focuses on the value of a three-dimensional (3D) computer based record of a heritage site in producing an accurate visual representation of the analytical recording process and the subsequent decisions that affect the fabric of the building. Decisions on how and what to
record will involve varying measures of subjective judgement of the relative values embodied in, or represented by, the building. In recent research it is becoming evident that some aspects of interpretation and significance of the component parts of the heritage site may be automatically assigned through pattern matching to potentially automatically acquired 3D data.
2. The VEPs Project
J.Counsell, J, Littlewood, Y.Arayici et al / Future Tagging Historic Buildings- Welsh Case Study
from LiDAR, for use within Virtual Reality (VR) visualization software and the subsequent delivery of the VR environment via the Internet and World Wide Web. Through the VEPS project, issues of building data capture and building data integration will be considered at a larger scale through investigating data standardization, modelling and integration with other VR systems.
VEPs aims to develop a common transferable web based visualisation system for planning proposals set in a 3D context obtained from ground and aerial remote sensed data that enables citizens to view, analyse, interact with and respond to proposed changes, to collaborate and comment together and pose and test their own alternative solutions. VEPs postulates an interactive three-dimensional VR visualisation intended to enable the viewer to grasp highly complex information without the need for training, because users can see and experience both the visual impacts of the planned changes and judge the environmental impact in associated (GIS based) simulations. An ongoing case study application within this project is between the National Museum of Welsh Life at St Fagan’s Castle (MWL), and UK project partners, the EA, with Salford University and UWE, Bristol.
3. National Museum of Welsh Life
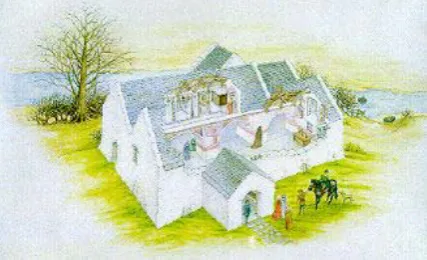
[image:3.612.83.297.437.567.2]In 2007, the Museum of Wales, UK celebrates its centenary, which will involve illustrations of exemplary projects from each part of the Museum, including the MWL. The MWL has established itself as one of Europe's foremost open air museums and popular heritage attractions, as it shows how the people of Wales lived, worked and spent their leisure time since the 16th century and includes over 50 buildings rescued from destruction and reconstructed in the 100 acre grade one listed park from the 16th C to the present day.
Figure 1: St Teilo’s Church © MWL 2005
This paper discusses a pilot study which has been undertaken to survey and create a three dimensional digital record of one of the MWL latest attractions, St Teilo’s church. MWL's specialist Historical Buildings Unit is currently working on this, its most ambitious project to-date, the re-erection and refurbishment of this medieval structure from Llandeilo Tal-y-bont in west Glamorgan. This is the first time that such a church has been moved to
an open air museum in Britain, and though some churches have been re-erected in museums on the continent, the vast majority of these are timber-built whereas this building is of solid masonry construction.
4. Recording Heritage Structures
Existing processes used by MWL when it is necessary to demolish and reconstruct historic structures include:
• Orthogonal survey drawings that form a 2D record;
• Data sheets;
• Painted / tagged numeric id codes on components;
• CAD modelling to reconstruct from 2D record drawings and data sheets a model of the structure prior to reconstruction.
Bearing in mind that some of the structures are stored for anything from 15 to 40 years prior to reconstruction, technologies change over that time, and some of the data sheets / tags may have been lost. When a move is made away from traditional paper techniques it is anticipated that issues will arise because of this latency in data storage, file formats, and proprietary computer systems. This suggests use of ASCII file formats that may be printed as well as stored digitally, and thus remain likely to be reinterpretable in digital form for the foreseeable future.
5. Other reasons for recording historic buildings
The ICOMOS guidelines [ICO99] state that “The record of a building should be seen as cumulative with each stage adding both to the comprehensiveness of the record and the comprehension of the building that the record makes possible.” The guidelines conclude that “recording should therefore so far as possible not only illustrate and describe a building but also demonstrate significance”. In their paper, on the relation of recording to digital 3D modelling focused on the Tower of London, Counsell and Worthing [CW99] listed the reasons for recording as:
• To enable the reconstruction of part or the whole of the building (or ‘object’) in the event of its damage or destruction;
• To identify the changes that have occurred to an historic building over a period of time;
• where the information is used to inform decision making about the effect that proposed changes will have on the historic fabric;
• As an archival record of that which is inevitably lost or changed, (even routine maintenance work can involve loss or change) is established;
• As a record of works actually undertaken to capture the chronological evolution of the building;
• record of hidden features revealed during the works before they are re-concealed.
• The authors draw on their experience to make some more generalised observations:
• Record techniques that rely solely on such access at one point in time tend to be incomplete without other forms of data. (Recording is held to be a continuous process) ;
• Remote imagery including photographs and earlier ‘historic’ records are likely to form part of, and require accurate location and integration into, the overall record;
• Different types of data will require to be amalgamated to provide a coherent record;
• An explicit audit trail should exist between interpreted information and the raw data on which it is based;
• It is critical to establish from the start, and stick to, a clearly defined and usable three-dimensional reference system for the site;
• It is probable that existing surveys and record drawings produced to serve earlier requirements will not suffice;
• Survey drawings per se include technical draughting conventions capable of being read by those with expertise but not interpreted automatically by computer;
• The data on which such surveys are based is now capable of computer logging;
• Retention of the base data permits computer manipulation and interpretation;
They conclude that Computer Aided Drafting (CAD) systems are still often used by those inputting data to merely output drawings for use on screen or on paper. While this eases the transition from use of drawing board to use of computer it does little to take advantage of the new medium.
6. A Potential New Workflow
Work with MWL during the VEPs project has led to the following suggested workflow, based on the use of new and emerging technologies, from commencement of dismantling the heritage building/structure to be rescued, or on which partial reconstruction is to be undertaken for maintenance:
1. Carry out a preliminary 3D scan of the heritage structure using ground based laser scanner combined with camera (to auto-rectify images), in order to examine optimal approaches (e.g. stripping away scaffolding, planning temporary supports) prior to dismantling, hence in effect ‘reverse-engineering’ the construction. (In this respect project partners have used the data to 3D print a model of the structure to aid such examination).
2. Tag each visible component of building with 3 RFID tags (spread as widely as possible) to position component as accurately as possible in 3D space on reconstruction. (3 tags would both enable the component to be accurately manipulated to restore it to its original orientation, but also provides redundancy in case one or more tags are lost or damaged). (Passive RFID tags {with antenna and processor} are close to breaking the 5 US cent barrier, but
active tags that broadcast their location require batteries costing more, and have limited life depending on the frequency at which they broadcast their presence).
3. Use ground based laser scanner combined with camera to scan the heritage building, ensuring that 3D locations of all RFID tags / components are both located in the scans and recorded by using triangulation and / or trilateration from deployment of RFID readers.
4. Retain laser scanner(s) and RFID readers on site, and scan again at each discrete stage of exposure of hidden elements of construction during the process of dismantling, tagging hidden components as above.
5. As each component is removed from structure for transport or storage elsewhere on site, scan RFID tags to check out and to update the inventory by location, and update the database with the condition of the component. A Real-Time Location System (RTLS) using active RFID tags may be used to continuously track their location if components are fragile / valuable / important.
6. Use the RFID or an RTLS to locate all components in storage. RFID tags with sensors may be used to (continuously) monitor the condition (humidity, temperature etc) of the components while in storage.
7. Construct a fully detailed 3D digital model from the laser scanned data (see the later discussion on automated object recognition and operator assigned significance).
8. Use the data about components derived from RFID to supplement the laser scanned data to support an assessment of the condition and completeness of the structure. Identify missing elements or those too deteriorated and requiring replacement/ renewal. From a library of similar structures and scanned components [from 3D scans of similar structures], pattern match to find those whose age and detail and form are the closest matches. Adjust the match judged best to fit the positional data derived from the laser scan(s).
9. Analyse / simulate strength of materials required, forces exerted on structure in general and on component in particular, weathering, moisture penetration etc. Simulate and analyse the most sustainable processes, (greatest reuse of existing components / materials – least need for future reconstruction or maintenance.)
10.Use numerical control (NC) processes where appropriate to fabricate the missing component(s).
11.Where NC processes are not appropriate, search a digital library of pre-recorded craft skills (including 3D scans of movement and use of tools) to identify those judged most appropriate to the circumstances. (Note that a separate process would be required to capture and to record the dynamic use of craft skills for later simulations).
12.Run a simulation using the skill-base to check that the required component(s) can be fabricated and assembled in place using the skill-set chosen, (e.g. is there sufficient room to insert fixings?)
J.Counsell, J, Littlewood, Y.Arayici et al / Future Tagging Historic Buildings- Welsh Case Study
14.Offer up each component in turn into position (based on the sequence analysis in 11 above). Use the 3 RFID tag locations (having replaced missing or damaged tags if necessary using the previously recorded 3D scan data points projected onto the surface) to locate the component accurately into the required / original position.
Research is currently in process by Salford, MWL and UWE that underpins parts of the workflow outlined above.
7. Real Time Location and Sensor Tags
In conjunction with Johnson Controls, UWE have been exploring the use of RFID tags in Real Time Location Systems (RTLS) [CP06]. One challenge posed above is to determine actual location with sufficient precision to explore mobility, context and interaction through use of an RTLS that for such tasks will require being in advance of the state of the art in positional accuracy. (Mobile phone or GPS location tracking is neither accurate enough nor is it effective indoors). RTLS accuracy depends on enhancement techniques that go beyond the mobile phone identification of presence within a cell. Location fixes are based on either the time difference between signals reaching different access points, or the strength of the signal from the device as measured by the access points, or multiples of these known as RF fingerprinting. High levels of accuracy have been achieved in lab tests, e.g. the Cricket ultrasound system claims centimetre accuracy in mobile situations under lab conditions with line of sight. [SBG*04]
Accuracy is lower in workplace applications using current commercial systems. Most of the systems available are most fully effective with line of sight, and the wireless ones that can operate out of sight are prone to variable occlusion (from columns, furniture and people) and false readings from reflections. Ultra-wideband is being suggested as less prone to this interference. One way in which accuracy can be further improved is by techniques that map and calibrate the space for reflections and occlusions, However in the WiFi field currently the best accuracies achieved through use of calibration are approximately 0.5m. It would appear likely that the most immediate contribution to be made by the emergence of affordable RFID tags may thus be to assist in providing a larger if ad-hoc grid of APs and therefore greater triangulation as well as a more highly calibrated environment.
Environmental sensors are emerging using the same technologies. The WWRF ‘book of visions’ in 2001 [WWR01] stated that “In the mobility and location-related category sensory input will play a major role in providing the information. Sensor technologies are embedded in the mobile equipment and networks and services will sense who the user is, where he is, what he is doing, what the environmental conditions are, etc. The environment itself will also be equipped with sensors that perceive users and communicate with their devices.”
8. Automating Contextual Datasets for VR
“A fundamental challenge for spatial analysis tools is the need to resolve the "knowledge gap" in the process of deriving information from images and digital maps. This knowledge gap has arisen because our capacity to build sophisticated data collection instruments (such as remote sensing, LIDAR, and GPS) is not matched by our means of producing information from these data sources.” [UNE03] An automation process was described by Richman et al in their 2005 ‘Remote Sensing, LIDAR, automated data capture and the VEPS project’ [RHA*05]. The Environment Agency for England and Wales began R&D Surveys using airborne Lidar in late 1996, leading to operational surveys from March 1998, concentrating on survey of river and coastal floodplains. To date they have surveyed in excess of 60,000 sq km. They have upgraded the technology from the Optech ALTM 1020 used in 1998, ALTM 1210 Specifications in 1999, ALTM 1225in 2000, ALTM 2033 from 2001. They have continued R&D and introduced new (semi-)automated operational filtering routines in Jan 2003. These are ArcView implemented algorithms, using Spatial and 3D Analyst, that still require some operator intervention in making a choice among six new techniques for classifying objects, with techniques specific to certain landscape types (eg., urban, steep slopes, forested, rural, etc), a choice of interpolation methods, and also tools for adding breaklines and additional ground points. These now variously deploy:
• Elevation Variance analysis
• Maximum vs. Minimum difference within varying spatial windows
• Aspect Variance analysis
• Inverse hydro-fill and edge detection
• Minimum filters (varying spatial windows)
• Edge detection (varying thresholds) and area segmentation
• Automated Vegetation and building removal, in which identified DEM cells are buffered by 4 metres, identified objects stripped out of scene, then the gap is filled by simple interpolation.
The extent of this automation depends on the precision of the intervals at which the data is captured. Much of the data can both effectively produce accurate and useful bare earth digital terrain models and also provide accurate height information for the extrusion of simple building block models (where the building outline may be determined from a variety of data sources). As yet however it is not high enough resolution to effectively identify and extract immediately recognizable building form that conveys a credible sense of presence at street level, including the roof profile(s) as silhouetted against the sky.
practice it has been found that such analysis is effective currently based on a grid at 2m centres, so the majority of this LiDAR coverage is captured and stored at this level of detail. Commercial LiDAR data has been captured for London at higher levels of detail. For example Infoterra has used LiDAR to capture “a comprehensive data set at 1m horizontal intervals with a vertical accuracy of +/-15 cm” in London [Inf05]. GeoInformation Group states that it now has a highly detailed surface model for the entire 160 square kilometre area of Central London that has been captured using LiDAR “a surface model of the ground at 2m horizontal intervals with vertical measurement accuracy better than +/- 15 cm” [Geo06]. There are thus clearly commercial drivers for obtaining (and presumably in due course updating the resolution of) data for London that may not apply consistently elsewhere, and will probably not apply in the near future to urban fringe and rural areas.
[image:6.612.80.295.251.410.2]Figure 2:Merged LiDAR and Ground Based Scans of Jactin House, Salford, by Salford University
Using the 5m grid UK coverage or at the more widely available LiDAR based 2m grid levels of detail it is difficult to identify and extract an accurate outline of a building. It is equally uncertain that 3 coplanar points will fall within the pitch of a roof, so that if an outline of the roof plane were available the roof pitch could be automatically established. It is almost certain that chimneys, dormers and other fine detail that is so significant in creating credible urban skylines will only be captured intermittently. Although potentially with the instruments and aircraft positioning already available the data can in principle be captured at a level of detail of 25cm in the X and Y axes and 15cm in Z. At this level of detail the full morphology of buildings can be captured, and updated to detect and to show change as often as the scanning takes place. However it will take a long time or a significant shift in the allocation of resources for data at this level of detail to become a comprehensive coverage for the UK. Thus where updating of high presence models does happen this paper puts forward the view that due to cost it is often likely to be piecemeal, and to take place
over a long period, during which software, bandwidth, standards and available detail may change significantly.
This poses the question as to what can be done in the meantime to obtain a ‘credible sense of presence at ground level’ from such data? A credible sense of presence in this context is measured by whether such a scene at street level would be readily recognized by the majority of users, since this is the viewpoint from which many planning based visual impact judgements are to be made. In the VEPs project it has been determined that it is in addition necessary to enhance the aerial 3D contextual data with geo-coordinated ground based laser and photo data to give a credible sense of presence at ground level.
9. Automatic Pattern Recognition from Scans
Salford University has been engaged in research towards building models automatically from ground based 3D laser scan data by automatically recognising components using pattern matching. One driver is that if you regularly repeat scan you do not have to manually reinterpret the data each time to add intelligence to it, or to compare the current with the previous state. (As the cost of scanning is brought down through projected automated analysis and reconciliation of the data it becomes more feasible to scan regularly to measure change over time.) Hence the ground based laser scanner is used to digitize all the 3D information concerned with a building at millimetre detail. A series of scans externally and internally allows an accurate 3D model of the building to be produced. This model can be "sliced" through different planes to produce accurate 2D plans and elevations. This technology improves the efficiency and quality of records of existing structures and artefacts.
Figure 3:Interior Scan of St Teilo’s Church, by Salford University
[image:6.612.320.528.417.551.2]J.Counsell, J, Littlewood, Y.Arayici et al / Future Tagging Historic Buildings- Welsh Case Study
[image:7.612.325.524.110.232.2]Within the VEPs project Salford are specifically addressing the problem of object recognition. This is important in realizing the visualization of 3D models of the built environment because visualization will be undertaken with the real characteristics and features of the real world objects as opposed to raw 3D models of laser scanned data, which are difficult to handle by many visualization software applications due to big file sizes. As a result data modeling and analysis of laser scanned data can also be done more effectively and precisely. It also facilitates the use of CAD and GIS software which will not normally support raw scanned 3D models.
Figure 4:Integration of all scans (interior and exterior) by Salford University
In the Intelcities research programme [AHG*04] an approach for object recognition was developed through simultaneous recognition of multiple objects in scenes of polygonal mesh models produced from the laser scanner point cloud data, which contains clutter and occlusion. Recognition is based on matching surfaces by matching points using spin image representation. Spin image is a data level descriptor that is used to match surfaces represented as a surface mesh [JH99]. The main difficulty with matching surfaces in this way is describing surface points so that they can be differentiated from one another, while still allowing point matching in scenes containing clutter, occlusion and 3D surface noise [UVS02]. This surface matching can be extended to object recognition as follows. Each object in the object database is represented as a polygonal mesh. Before recognition, the spin images for all vertices on all models are created and stored. At recognition time, a scene point is selected and its spin image is generated. Next, its spin image is correlated with all of the spin images from all of the objects. The best matching model spin image will indicate both the best matching model and model vertex. After matching many scene spin images to model spin images. The result is simultaneous recognition and localization of the objects that exist in the scene [JH98] [SH05]. Salford’s recent research is focused on a pattern matching approach. Pattern matching addresses issues of searching and matching strings and more complicated pattern such as trees, regular expressions, graphs, point sets, and arrays
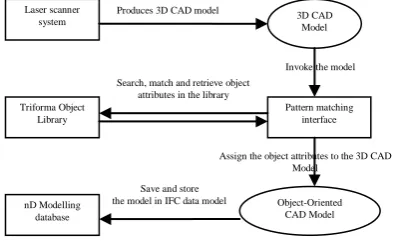
[Joh02]. The diagram below (Figure 5) shows the pattern matching approach used by Salford in their developing research into object recognition from the laser scanned data.
Figure 5: Object recognition approach for laser scanned building data
Using a current mix of semi-automated and fully automated techniques 3D CAD models are extracted from the polygonal mesh model developed in the laser scanner system. The extracted CAD model is deployable in commercial CAD software. The pattern matching interface being developed will invoke the 3D CAD model in its display screen. Highlighting any building frame in the model will enable the pattern matcher to define geometric features as criteria for the pattern matching process, such as: shape; sides; width; height; thickness; line type; line thickness; line colour; and so on. Beside the automatic feature recognition, users can also input additional criteria for matching.
The Pattern matcher will access a CAD library (currently Microstation Triforma) with the selected criteria on which to search and match. Both exact pattern matching and approximate pattern matching can be implemented. Exact pattern matching consists of finding the exact pattern looked for. Whereas approximate pattern matching searches for a generalisation of the pattern and a pre-determined number of differences between the pattern looked for and the objects found in the library are allowed.
It is probable that the feature detection algorithm to be used in particular instances will be based on determination of the specific configuration of that part of the overall structure. This is certainly the experience of project partners in their (near fully automated) processing of Lidar data.
It is considered that there will be three types of pattern form: simple, constrained, and variable. All three forms can be accommodated by the pattern matcher interface. However, it will handle them differently to improve efficiency. Simple patterns are simple matches on values [FN04]. The pattern describes which values must be included in the search. For example, the pattern matcher tries to match an instance of a square (a frame) and it then finds all the squares in the example database. In the constrained pattern form, it is possible to specify a constraint on a value instead of a specific value [Fer04]. To do so, a function to be provided will test the constraint.
Assign the object attributes to the 3D CAD Model
Save and store the model in IFC data model
Search, match and retrieve object attributes in the library
Invoke the model Produces 3D CAD model
Laser scanner
system 3D CAD Model
Pattern matching interface Triforma Object
Library
Object-Oriented CAD Model nD Modelling
[image:7.612.81.295.189.337.2]For example, the pattern matcher might match the frame to the triangle -1, triangle -2, triangle -3 and triangle 4. A constraint (value <4) limits the value of sides to be less than 4. In the variable type of pattern form, patterns may also include variable references [Csu04]. Variables in patterns can be used to relate values. The first occurrence of a variable in a pattern causes the value in a frame to be bound to that variable. The second occurrence forces a constraint that the value will be equal to the value bound to the variable. For example, pattern (width a, height a) describes objects with width equal to height.
The following step is to write these objects in the scene into the IFC (Industry Foundation Classes) schema at building scale or IFG schema at city scale [WH05]. IFC is an international data model as an object oriented standard for information sharing and interoperability to improve communication, productivity, delivery time, cost, and quality throughout the design, construction, operation and maintenance lifecycle of buildings.
10. Conclusions
This paper has described work from an ongoing research project focused on scanning and modelling St Teilo’s Church under reconstruction at the National Museum of Welsh Life. It has discussed some of the ways in which new and emerging technologies are likely to modify (and it is argued enhance) the current workflow used at the MWL. It is also argued that point cloud scans alone are insufficient as records of heritage structures without added significance, and that pattern matching based object recognition, as a tool to aid operator interpretation or even semi- or fully automated may speed and enhance that process. It is suggested that further development of these emerging technologies is likely to be necessary to future proof digital records of historical buildings and to ensure that their components can be reliably located through tagging.
Acknowledgements
The project work presented in this paper is co-financed through the INTERREG IIIB North West Europe programme.
References
[CW99] Counsell, J. Worthing, D: Issues arising from Computer Based Recording of Heritage Sites ', Vol 17, No 4. Structural Survey Journal, 1999.pp 200-211 [ICO99] ICOMOS. Guide To Recording Historic
Buildings, Butterworth, London, (1990).
[CP06] J.Counsell, M. Puybaraud: Visible display of automated observation of collaborative workspaces. Paper accepted for proc. CDVE 2006, Palma, Mallorca, (Sept.2006). See also VISIBLE - Smart Space
Management at http://www. facilitiesinnovation.co.uk [SBG*04] Smith, A. Balakrishnan, H. Goraczko, M.
Priyantha, N: Tracking Moving Devices with the
Cricket Location System. In: Proc. 2nd international conference on Mobile systems, applications, and services, ACM Press pp. 190-202 (2004) (2003)
[WWR01] WWRF Book of visions, 2001. http://www.wireless-world-research.org
[UNE03] International Workshop on Open Access and the Public Domain in Digital Data and Information for Science UNESCO 10/11 March 2003, Final Report UNESCO 31 July 2003.
[RHA*05] Richman, A. Hamilton, A. Arayici, Y. Counsell, J. Tkhelidze, B: Remote Sensing, LIDAR, automated data capture and the VEPS project. in proc IV05 9th Intl Conference on Information Visualisation
London, edited by Banissi et al, published by the IEEE Computer Soc. Los Alamitos California. 2005. [Inf05] Infoterra press release 3rd November 2005
http://www.infoterra.co.uk/press/London Heights.doc [Geo06] Geoinformation Group City Heights Lidar based
modelling press release of April 2006.
http://spatialnews.geocomm.com/dailynews/2006/apr/05 /news2.html
[WH05] Wang, H., Hamilton, A: Data integration issues within nD Information Modelling for Urban Planning.
Proc. 5th International Postgraduate Research Conference, Salford, UK, Blackwell Publishing P194-203 (2005).
[AHG*04] Arayici, Y., Hamilton, A., Gamito, P., Albergaria, G: The Scope in the INTELCITIES Project for the Use of the 3D Laser Scanner. Proc. ECT2004: The Fourth International Conference on Engineering Computational Technology, Lisbon, Portugal. ISBN 0948749962. (Sept 2004)
[JH99] Johnson, A.E., Hebert, M: Using Spin Images for Efficient Object Recognition in Cluttered 3D Scenes.
IEEE Transaction on Pattern Analysis and Machine Intelligence, Vol 21, NO 5, (May 1999)
[UVS02] Ullman, S., Vidal-Naguet, M., and Sali, E: Visual features of intermediate complexity and their use in classification. Nature Neuroscience, 5(7): 682-687, (July 2002)
[SH05] Stein, A., Hebert, M.: Incorporating Background invariance into Feature-Based Object Recognition, 7th IEEE Workshop on Application of Computer Vision.
(January 2005)
[JH98] Johnson, A., and Hebert, M: Surface Matching for Object Recognition in Complex Three-Dimensional Scenes. Image and Vision Computing, vol. 16, pp. 635-651, (1998)
[Joh02] Johnson, M.: A simple pattern matching algorithm for recovering empty notes and their antecedents, Proc. 40th Annual Meeting of the Association for
computational Linguistics (ACL),. Philadelphia, pp136-143. (July 2002)
J.Counsell, J, Littlewood, Y.Arayici et al / Future Tagging Historic Buildings- Welsh Case Study
[Fer04] Ferragina, P: On Compression and Indexing: two sites of the same coin, proc. Combinatorial Pattern Matching Conference (CPM), (Istanbul. July 2004) [Csu04] Csuros, M: Performing local similarity searches
with variable length seeds. Proc. Combinatorial Pattern Matching Conference (CPM) , Istanbul (July 2004)