Methodological Investigation of the Curriculum
Evaluation Theses Completed between the Years
2006-2015 in Turkey
Mecit Aslan
1,*, Mustafa Sağlam
21Department of Educational Sciences, Yüzüncü Yıl University, Turkey 2Department of Educational Sciences, Anadolu University, Turkey
Copyright©2017 by authors, all rights reserved. Authors agree that this article remains permanently open access under the terms of the Creative Commons Attribution License 4.0 International License
Abstract
The aim of this research is to examine postgraduate theses on curriculum evaluation completed between the years 2006-2015 in Turkey in terms of various aspects such as university, year, curriculum which is evaluated, curriculum evaluation model, research method, design, sample type, data collection methods, data analysis technique. In order to determine the theses, a comprehensive review was made through the thesis database of Council of Higher Education (COHE). 306 postgraduate theses were used as data sources. Methodological structure determination form was used as data collection tool in this study. Content analysis, one of qualitative data analysis techniques, was used in the analysis of theses. Frequency and percentage values about the obtained themes were presented. In the study, it was seen that theses on curriculum evaluation were largely studied between 2009-2012, most of them were master thesis, mostly primary school curricula were evaluated, curriculum evaluation models weren’t used in the majority of the theses, mostly quantitative research methods and descriptive model was used, mostly survey and interview were used as data collection technique, data was collected from teachers and students in the majority of studies, one variable analyses and correlational analyses were mostly used as data analysis technique. In the light of results achieved, the more use of qualitative and mixed research methods, qualitative and experimental designs, all stakeholders as data sources, advanced statistical methods and the more evaluation of secondary and higher education curricula are recommended.Keywords
Curriculum Evaluation, Curriculum Development, Postgraduate Education, Thesis, Dissertation1. Introduction
The century in which we live is an era that has brought about great scientific and technological advances, one in which information multiplies, and the reality shapes in accordance with the spirit of time. In this context, institutions need to renew themselves and keep up with change in the age. Education systems and institutions also have important duties at the point of adapting and steering to developments. For this reason, all countries develop curricula for all levels of education to keep pace with these developments and to educate qualified individuals. However, it is a requirement for educators to evaluate curricula regularly in the light of the fact that curriculum development is a dynamic process while everything changes.
evaluation process, a decision is made about the curriculum. Curriculum evaluation has important functions. Measuring and evaluating the learning outcomes of learners reveal how much progress they make, and their status within their peers by comparing with their peers. Another important function of the evaluation is to determine the value of the curriculum. The appropriateness of the objectives, whether the curriculum is implemented as intended or not, the appropriateness of the curriculum for students, the learning process, the appropriateness of content and teaching materials are revised with evaluation. The third important function of evaluation is to make a judgment about the value of all administrative regulations and practices [8]. In short, although there are different opinions about the purposes and functions of curriculum evaluation, the aim at the center of the evaluation is to determine the value of all or a part of the curriculum [9]. Determining the value of the curriculum helps decision-makers to decide about the future of the curriculum.
Different types of evaluation are included in the literature, but the most cited classification is made by Scriven. Scriven states two types of evaluation in this classification: Formative evaluation and summative evaluation. Formative evaluation is a type of evaluation used in the development and implementation of the curriculum in general, and concentrating on behaviors of teachers and students, providing intensive feedback [10, 11]. On the other hand, summative evaluation is a type of evaluation concentrating whether the curriculum works or not, and examining the total effect of various components of the curriculum [9, 11]. Summative evaluation is applied after the curriculum was implemented and formative evaluation results are also used in this type of evaluation.
There are different studies on the characteristics and orientations of educational researches in Turkey. Karadağ [12] examined dissertations in the field of educational sciences; Arık & Türkmen [13], and Erdem [14] focused on the articles in educational sciences journals; Mısırlı & Kurt [15] examined computer based mathematics and geometry teaching studies; Adıgüzel & Ergünay [16] analyzed studies on values and values education; Sert et al. [17] investigated studies examining the use of technology by teachers, Kaytez & Durualp [18] studied postgraduate theses related to games in pre-school education. Hazır-Bıkmaz et al. [19] analyzed dissertations completed between 1974 and 2009 in the field of Curriculum and Instruction and Kozikoğlu & Senemoğlu [20] analyzed dissertations completed between 2009 and 2014 in the same field. It can be said that these studies present the pictures of different fields. When these studies are examined, the tendencies of the studies in a specific field are seen.
Officials, nonprofit funders, oversight agencies, and citizens in every country want to learn the value of curriculum they funded. Stakeholders of curricula also want to know whether their curriculum is performing properly or not [21]. In Turkey, curriculum evaluation studies are
generally carried out in two different ways. The first of these is curriculum evaluation studies conducted by Ministry of National Education (MONE) officially and the second is curriculum evaluation studies conducted by academicians and researchers at universities as dissertations, articles or oral presentations [22]. Gökmenoğlu [23] examined the curriculum evaluation studies in Turkey in terms of models and approaches. Trends in curriculum evaluation studies in Turkey between 2004 and 2013 were examined in another study conducted by Kurt & Erdoğan [24]. Nevertheless, there were no study revealing the tendencies of curriculum evaluation theses and dissertations having an important position in educational researches field.
2. The Purpose and Importance of the
Study
The purpose of this research is to analyze theses (master theses and dissertations) on curriculum evaluation completed between the years 2006-2015 in Turkey in terms of various aspects such as years, universities, curriculum which is evaluated, curriculum evaluation models, research methods, designs, sample types, data collection methods, data analysis technique etc. This study will give the researchers in this field on how the planned studies should be done by analyzing the methodological tendencies in the curriculum evaluation studies.
3. Method
3.1. Research Design
The qualitative research method was used in this study aiming the methodological examination of the curriculum evaluation theses completed between the years 2005-2014 in Turkey. Qualitative research is a method of natural and in-house researcher that serves as a means of collecting data [25], with the aim of in-depth description and interpretation. Despite the different patterns in qualitative research methods, this study is based on the design of the study case study because the situation of the curriculum evaluation studies in recent years is examined. Case study is a research design that focuses on understanding the current dynamics in an situation [26].
3.2. Data Source
The data source of the research is composed of 306 postgraduate theses on curriculum evaluation, which were completed between 2006-2015 and can be reached from the thesis database of Council of Higher Education.
3.3. Procedure
inappropriate studies for the purpose of study, (iii) coding of data, (iv) creation of themes, (v) identification and presentation of findings.
An advanced screening was conducted at thesis database of Council of Higher Education (COHE) in order to determine the post-graduate theses to be included in the study. During the scan, the word (or words) to be searched are scanned by writing "curriculum evaluation" and selecting "All" in the search area. The theses were downloaded on computer in pdf format. Since all areas were screened at the first stage, it was seen that the studies that did not serve the purpose of the study were downloaded, too. In order to sort out these studies, the studies were reviewed and the studies that were not served for the purpose of studying were removed from the scope of the study. Attention has been paid to the fact that the studies included in the scope of the study reveal the current situation of a course, course or curriculum. Some of these curriculum evaluation studies focus on results and the others focus on judgements as said by Fitzpatrick et al. [9]. The determined studies are organized into folders according to the accepted years and they are examined one by one and the data are coded in the methodological structure determination form. This form was formed by researchers after searching the literature and taking the expert opinion. The process of coding has been carried out by combining the similar features and creating the themes/categories. For example, studies in which teacher education courses such as "curriculum development" and "planning and evaluation in teaching" were evaluated under "teacher education". Finally, the data that have been transformed into the themes are presented in tables.
3.4. Analysis of Data
In the analysis of the obtained data, the content analysis was applied to the qualitative data. Content analysis is an in-depth analysis technique aimed at reaching the concepts and correlations that explain the obtained data [25]. Twenty-five percent of post-graduate theses were randomly selected for reliability of the study. These selected studies are subject to content analysis and coded by the first researcher and another expert. The codification made by the coders was compared and tried to reach a consensus. Following this process, the reliability was calculated by using the Miles & Huberman [27] reliability formula (Reliability = Consensus / (Consensus + Dissidence), and the confidence level was found to be 94% as a result of the calculations. Therefore, it can be said that the results of the analysis in this study are reliable.
4. Results
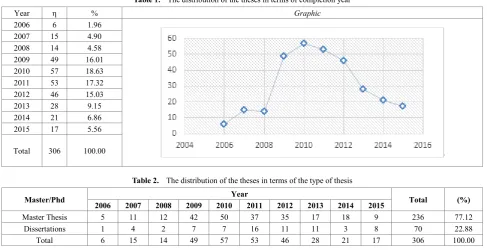
[image:3.595.62.550.460.710.2]The distribution of the theses in terms of completion year is presented in table 1. Out of 306 theses, 6 (1.96%) were completed in 2006, 15 (4.90%) in 2007, 14 (4.58%) in 2008, 49 (16.01%) in 2009, 57 (18.63%) in 2010, 53 (17.32%) in 2011, 46 (15.03%) in 2012, 28 (9.15%) in 2013, 21 (6.86%) in 2014 and 17 (5.56%) were completed in 2015. These findings show that most of curriculum evaluation studies were completed between 2009 and 2012. After 2012, the number of curriculum evaluation studies decreased.
Table 1. The distribution of the theses in terms of completion year
Year η % Graphic
2006 6 1.96
2007 15 4.90
2008 14 4.58
2009 49 16.01
2010 57 18.63
2011 53 17.32
2012 46 15.03
2013 28 9.15
2014 21 6.86
2015 17 5.56
Total 306 100.00
Table 2. The distribution of the theses in terms of the type of thesis
Master/Phd Year Total (%)
2006 2007 2008 2009 2010 2011 2012 2013 2014 2015
Master Thesis 5 11 12 42 50 37 35 17 18 9 236 77.12
Dissertations 1 4 2 7 7 16 11 11 3 8 70 22.88
Total 6 15 14 49 57 53 46 28 21 17 306 100.00
Table 3. The distribution of the theses in terms of university
University Year Total (%)
2006 2007 2008 2009 2010 2011 2012 2013 2014 2015
Gazi University 0 1 1 0 7 7 8 6 2 3 35 11.44
Marmara University 0 0 0 1 8 4 2 2 0 0 17 5.56
Abant İ.B. University 0 0 0 3 3 3 3 2 1 1 16 5.23
Atatürk University 1 0 1 1 2 6 2 2 0 0 15 4.90
Hacettepe University 0 3 0 4 2 1 1 0 1 2 14 4.58
Ankara University 1 0 0 2 1 3 2 3 0 2 14 4.58
Fırat University 1 0 1 2 4 2 0 1 0 0 11 3.60
KATU 0 0 1 5 0 4 0 1 0 0 11 3.60
Ç. 18 Mart University 0 1 3 1 1 2 0 0 1 1 10 3.27
Çukurova University 0 3 1 2 2 2 0 0 0 0 10 3.27
Erciyes University 1 0 0 3 1 3 1 0 1 0 10 3.27
METU 0 0 1 3 3 0 3 0 0 0 10 3.27
Selçuk University 1 0 1 4 1 2 0 0 0 0 9 2.94
Balıkesir University 0 0 0 1 0 3 2 1 0 1 8 2.61
Sakarya University 0 1 2 2 1 1 0 0 0 0 7 2.29
Kafkas University 0 0 0 1 2 1 2 1 0 0 7 2.29
Uludağ University 1 1 0 0 0 2 1 0 2 0 7 2.29
Adnan M. University 0 0 0 2 2 0 1 0 1 0 6 1.96
Anadolu University 0 1 0 1 1 0 2 0 0 1 6 1.96
Muğla University 0 0 1 0 2 1 0 0 1 1 6 1.96
Erzincan University 0 0 0 0 2 1 1 0 1 0 5 1.63
Other Universities 0 4 1 10 14 5 15 9 10 5 73 23.86
Total 6 15 14 49 57 53 46 28 21 17 306 100.00
Other Universities (Ege (η= 4), İnönü (η= 4), Afyon Kocatepe (η= 2), Akdeniz (η= 2), Beykent (η= 1), Bahçeşehir (η= 1), Boğaziçi (η= 1) Celal Bayar (η= 12, Cumhuriyet (η= 2), Çağ (η= 1), Dicle (η= 3), Dokuz Eylül (η= 3), Dumlupınar (η= 1), Eskişehir Osmangazi (η= 2), Gaziantep (η= 2), Gaziosmanpaşa (η= 1), İstanbul (η= 1), Kahramanmaraş Sütçü İmam (η= 1), Kırıkkale (η= 1), Mehmet Akif Ersoy (η= 2), Mersin (η= 1), Mustafa Kemal (η= 1), Necmettin
Erbakan (η= 3), Niğde (η= 2), Ondokuz Mayıs (η= 2), Pamukkale (η= 2), Süleyman Demirel (η= 1), Trakya (η= 4), Ufuk (η= 2), Uşak (η= 2), Yeditepe (η= 4), Yıldız Teknik (η= 4), Yüzüncü Yıl (η= 1), Zonguldak Karaelmas (η= 2), Zirve (η= 2)).
The distribution of the theses in terms of universities is presented in table 3. The universities in which the highest number of the thesis and dissertations were completed are like that: Gazi University (η=35), Marmara University (η=17), Abant İzzet Baysal University (η=16), Atatürk University (η=15), Hacettepe University (η= 14), Ankara University (η= 14), Fırat University (η= 11), Karadeniz Technical University (η= 11), Erciyes University (η= 10), Middle East Technical University (η=10), Çukurova University (η= 10), Çanakkale 18 Mart University (η= 10). These findings indicate that curriculum evaluation studies were conducted in many universities in Turkey.
Table 4. The distribution of the theses in terms of departments
Department Year Total (%)
2006 2007 2008 2009 2010 2011 2012 2013 2014 2015
Educational Sciences 4 9 7 23 25 20 23 10 10 9 140 45.75
Elementary/Primary Education 1 5 4 10 13 10 8 6 4 1 62 20.26
ELT - - - 3 3 1 3 2 1 4 17 5.56
Secondary School Science and
Mathematics Education - 1 - 2 3 5 1 2 2 1 17 5.56
Secondary School Social Studies
Education - - 1 2 1 8 - - 1 1 14 4.58
Philosophy and Religious Studies 1 - - 2 2 3 - 2 2 - 12 3.92
Turkish Education - - 1 4 1 - 4 - - - 10 3.27
Fine Arts Education - - - - 4 3 3 - - - 10 3.27
Physical Education and Sports - - - 2 2 - - 1 - - 5 1.63
Lifelong Learning and Adult
Education - - - - 1 - 1 - - - 2 0.65
Computer and Instructional
Technology Education - - - 1 - - - - 1 - 2 0.65
Other Departments - - 1 - 2 3 3 5 - 1 15 7.67
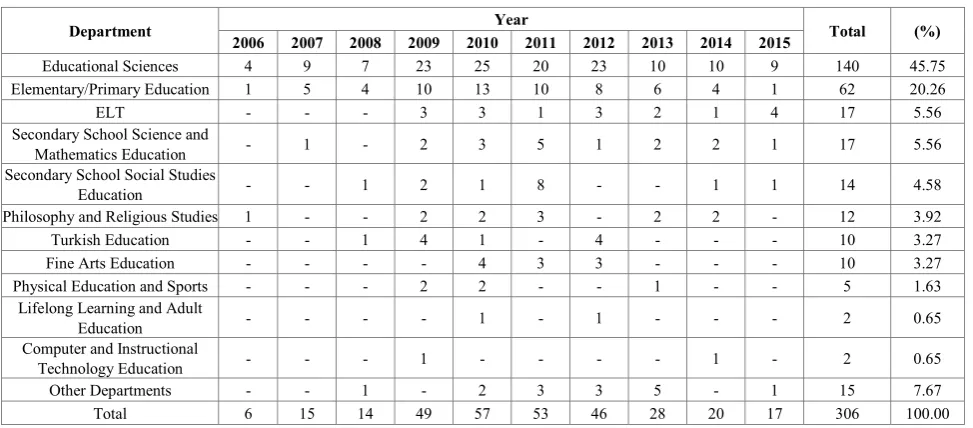
[image:4.595.63.550.519.733.2]The distribution of the theses in terms of departments is like that: Educational Sciences (η=140), Elementary/Primary Education (η=62), ELT (η=17), Secondary School Science and Mathematics Education (η=17), Secondary School Social Studies Education (η=14), Philosophy and Religious Studies (η=12), Turkish Education (η=10), Fine Arts Education (η=10), Physical Education and Sports (η=5), Lifelong Learning and Adult Education (η=2), Computer and Instructional Technology Education (η=2), and Other Departments (η=15). These findings show that most of curriculum evaluation theses were conducted in Educational Sciences and Elementary/Primary Education departments in Turkey.
Table 5. The distribution of the theses in terms of evaluated curriculum
Evaluated Curriculum Year Total (%)
2006 2007 2008 2009 2010 2011 2012 2013 2014 2015
Science and Technology - 2 3 4 7 3 3 2 1 - 25 8.20
Social Sciences 1 2 4 4 3 3 2 1 3 1 24 7.84
Teacher Education - 1 2 2 3 3 5 2 2 3 23 7.52
English - - 1 4 6 2 3 - 2 2 20 6.54
Elementary/Primary School
Mathematics 1 3 - 5 2 3 4 1 - - 19 6.21
Turkish - - 3 4 1 1 3 - 1 2 15 4.90
English Preparatory (University) - - - 3 3 - 2 2 - 1 11 3.60
Pre-School Education - - - 3 1 1 2 2 - - 9 2.94
Religious Culture and Moral
Knowledge 1 - - 2 1 2 - 3 - - 9 2.94
Class Guidance - - - 1 1 2 3 - 1 - 8 2.61
Primary School Curricula 1 1 - 2 3 1 - - - - 8 2.61
Music - - - 1 1 3 1 1 - - 7 2.29
Life Sciences - - - 2 1 3 - - - - 6 1.96
Turkish Language and Literature - - - - 1 4 - - - 1 6 1.96
Computer - - - 1 1 1 - - 3 - 6 1.96
Geography - - - 2 1 2 - - - - 5 1.63
Biology - - - 1 2 - - 1 - 1 5 1.63
Physical Education - - - 2 1 - - 1 1 - 5 1.63
Citizenship and Democracy - 2 - - - 1 1 - - - 4 1.31
Physics - - - - 2 1 - - 1 - 4 1.31
Technology and Design - - 1 - - 1 1 - - - 3 0.98
Visual Arts - - - 1 - 2 - - - - 3 0.98
Secondary School Mathematics - - - - 1 1 - - - - 2 0.65
In-Service Teacher Education - - - 1 - 1 - 2 0.65
Chemistry - - - 1 1 - - 2 0.65
Candidate Teacher - - - - 1 - 1 - - - 2 0.65
Postgraduate Education - - - 1 - 1 2 0.65
Others 2 4 - 5 14 13 13 10 5 5 71 23.20
Total 6 15 14 49 57 53 46 28 21 17 306 100.00
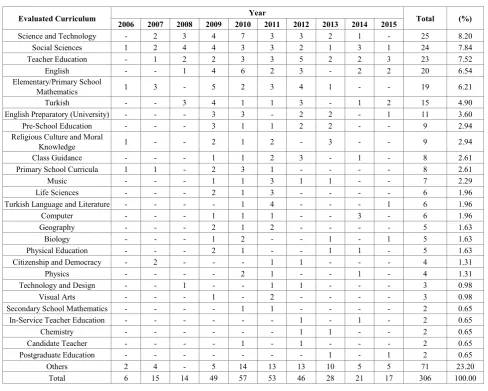
The distribution of the theses in terms of evaluated curricula is presented in table 5. The most evaluated curricula are like that: Science and Technology (η=25), Social Sciences (η=24), Teacher Education (η=23), English (η=20), Elementary/Primary School Mathematics (η=19), Turkish (η=15), English Preparatory (University) (η=11), Pre-School Education (η=9), Religious Culture and Moral Knowledge (η=9), Class Guidance (η=8), Primary School Education (η=8), Music (η=7), Life Sciences (η=6), Turkish Language and Literature (η=6), Computer (η=6), Geography (η=5), Biology (η=5), Physical Education (η=5). These findings show that elementary/primary school curricula were evaluated mostly. On the other hand, secondary school curricula were evaluated in Turkey.
Table 6. The distribution of the theses in terms of research methods
Method 2006 2007 2008 2009 2010 Year 2011 2012 2013 2014 2015 Total (%)
Quantitative 3 11 9 29 30 25 21 11 11 4 154 50.32
Qualitative 2 3 2 7 15 16 13 8 5 2 73 23.86
Mixed 1 1 3 13 12 12 12 9 5 11 79 25.82
[image:5.595.61.550.168.559.2]As seen in table 6, the distribution of the theses in terms of the research method is like that: The most used research method is quantitative method (η=54), followed by mixed method (η = 79) and qualitative (η=73) respectively. These findings show that quantitative method is used more than qualitative and mixed methods in curriculum evaluation theses in Turkey.
Table 7. The distribution of the theses in terms of research designs
Design 2006 2007 2008 2009 2010 Year 2011 2012 2013 2014 2015 Total (%)
Descriptive/Survey 5 11 10 42 51 34 33 16 17 14 233 76.14
Experimental - 2 3 3 2 5 2 3 - - 20 6.54
Case Study - - - 1 3 4 5 3 3 1 20 6.54
Phenomenology - - - 1 2 1 - 1 5 1.63
Mixed Research Designs - - - 1 1 2 0.66
Action Research - - - - 1 - - - 1 0.33
No Design 1 2 1 3 - 9 4 5 - - 25 8.17
Total 6 15 14 49 57 53 46 28 21 17 306 100,0
As seen in table 7, The distribution of the theses in terms of research designs is like that: In most of the theses, survey/descriptive design (76.14%) was preferred, it is followed by experimental design (6.54%), case study design (6.54%), phenomenological design (1.63%), mixed research designs (0.66%) and action research design (0.33%) respectively. Research design wasn’t used in 25 (8.17%) theses. These findings show that most of curriculum evaluation studies carried out by using descriptive/survey design.
Table 8. The distribution of the theses in terms of curriculum evaluation models
Curriculum Evaluation Model Year Total (%)
2006 2007 2008 2009 2010 2011 2012 2013 2014 2015
CIPP - - 1 2 2 1 3 1 1 1 12 3.92
Countenance Model - - - - 1 - 2 - - - 3 0.98
Objective Oriented Evaluation Model - - - 1 1 1 3 0.98
Educational Connoisseurship
Criticism Model - - - 1 1 - - - 2 0.65
UCLA - - - 1 - 1 0.33
Analytic Curriculum Evaluation
Model - - - 1 1 0.33
Discrepancy Evaluation Model - - - 1 - - - 1 0.33
Bellon and Handler Model (1982)-Brown (1989) Evaluation
Model - - - 1 - - - 1 0.33
Objectives Oriented Model-Eisner’s Educational Connoisseurship
Criticism Model - - - 1 - - - - 1 0.33
No Model 6 15 13 45 53 51 40 26 18 14 281 91.83
Total 6 15 14 49 57 53 46 28 21 17 306 100.00
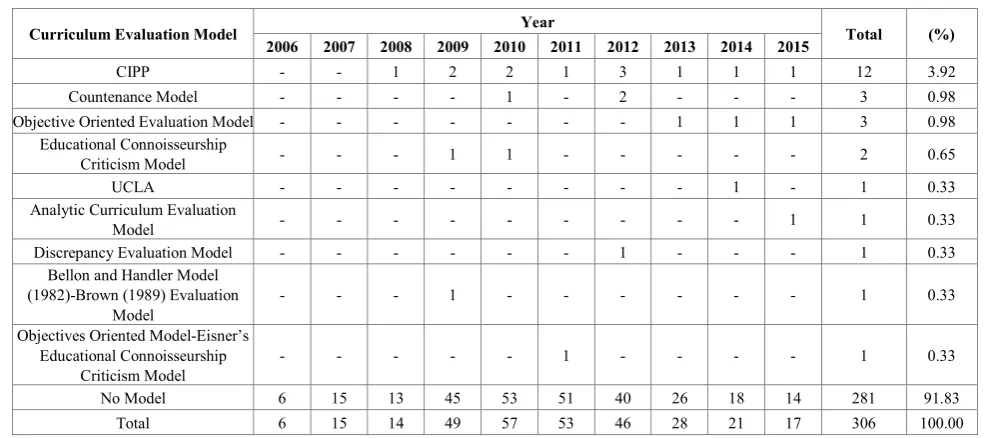
The distribution of the theses in terms of curriculum evaluation models is presented in table 8. Out of 306 theses; curriculum evaluation models were not used in 281 (91.83%) thesis, Stufflebeam’s CIPP Evaluation Model was used in 12 (3.92%), Stake’s Countenance Model was used in 3 (0.98%), Tyler’s Objective Oriented Evaluation Model was used in 3 (0.98%), Eisner’s Educational Connoisseurship Criticism Model was used in 2 (0.65%), UCLA Evaluation Model was used in 1 (0.33%), Demirel’s Analytic Curriculum Evaluation Model was used in 1 (0.33%), Provus’s Discrepancy Evaluation Model was used in 1(0.33%), Bellon and Handler Model (1982) and Brown (1989) Evaluation Model were used in 1(0.33%) and Objectives Oriented Model and Eisner’s Educational Connoisseurship Criticism Model were used in 1 (0.33%). These findings indicate that curriculum evaluation models were not used in most of studies.
Table 9. The distribution of the theses in terms of data collection techniques
Data collection technique 2006 2007 2008 2009 2010 Year 2011 2012 2013 2014 2015 Total (%)
Survey 3 7 10 29 33 25 23 11 10 11 162 52.94
Interview 2 4 4 16 16 16 18 14 7 13 110 35.95
Scale 1 6 5 13 10 12 7 5 5 5 69 22.55
Achievement Test - 3 3 3 2 5 6 4 1 1 28 9.15
Observation 1 1 - 6 2 4 5 1 1 2 23 7.52
[image:6.595.63.548.133.245.2] [image:6.595.57.551.328.547.2]As seen in the table 9, the distribution of the theses in terms of data collection techniques used in theses is like that: The most used techniques are survey used in 162 (52.94%) theses, interview in 110 (35.95%), scale in 69 (22.55%), achievement tests in 28 (9.15%), observation in 23 (7.52%), and document analysis in 47 (13.73%). These findings show that the most used quantitative data collection technique is the survey and the most used qualitative data collection technique is the interview.
Table 10. The distribution of the theses in terms of the number of data collection techniques
The number of data collection technique
Year
Total (%) 2006 2007 2008 2009 2010 2011 2012 2013 2014 2015
One 4 12 8 34 42 36 31 16 16 6 205 66.99
Two 1 1 4 10 12 13 10 11 5 8 75 24.51
Three 1 1 1 4 2 3 2 1 - 1 16 8.50
Four - - - 1 - 1 3 - - 2 7 2.29
Five - 1 1 - 1 - - - 3 0.98
Total 6 15 14 49 57 53 46 28 21 17 306 100.00
As seen in the table 10, the distribution of the theses in terms of the number of data collection techniques is like that: one technique is used in 205 (66.99%), two techniques are used in 75 (24.51%), three techniques are used in 16 (8.50%), four techniques are used in 7 (2.29%) and five techniques are used in 3 (0.98%) theses. These findings show that one data collection tool was used in curriculum evaluation theses mostly.
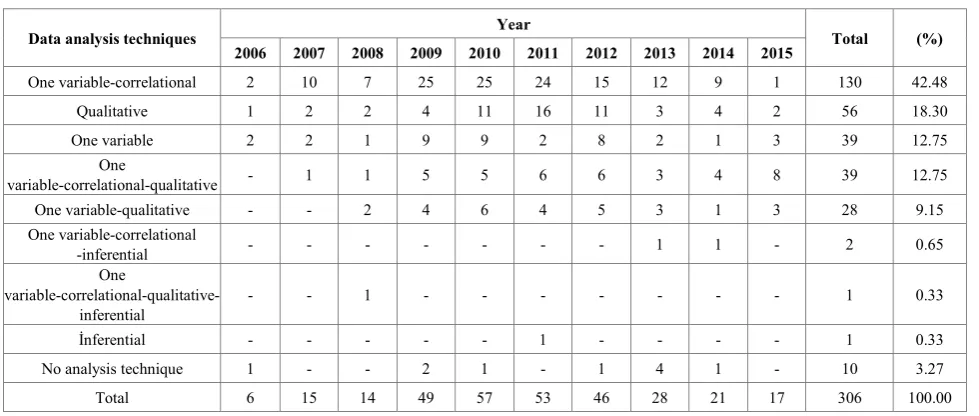
Table 11. The distribution of the theses in terms of data analysis techniques
Data analysis techniques Year Total (%)
2006 2007 2008 2009 2010 2011 2012 2013 2014 2015
One variable-correlational 2 10 7 25 25 24 15 12 9 1 130 42.48
Qualitative 1 2 2 4 11 16 11 3 4 2 56 18.30
One variable 2 2 1 9 9 2 8 2 1 3 39 12.75
One
variable-correlational-qualitative - 1 1 5 5 6 6 3 4 8 39 12.75
One variable-qualitative - - 2 4 6 4 5 3 1 3 28 9.15
One variable-correlational
-inferential - - - 1 1 - 2 0.65
One
variable-correlational-qualitative-inferential - - 1 - - - 1 0.33
İnferential - - - 1 - - - - 1 0.33
No analysis technique 1 - - 2 1 - 1 4 1 - 10 3.27
Total 6 15 14 49 57 53 46 28 21 17 306 100.00
As seen in the table 11, the distribution of the theses in terms of data analysis techniques used in theses is like that: One variable analyses-correlational analyses were used together in 130 (42.48%), qualitative analyses in 56 (18.30%), one variable analyses in 39 (12.75%), one variable-correlational analyses-qualitative analyses together in 39 (12.75%), one variable analyses- qualitative analyses in 28 (9.15%), one variable analyses-correlational analyses-inferential analyses together in 2 (0.65%), one variable analyses-correlational analyses-inferential analyses- qualitative analyses together in 1 (0.33%), inferential analyses in 1 (0.33%), and data analysis techniques weren’t used in 10 (3.27%) theses. The mean of this data is that the most used data analysis technique is one variable-correlational technique. In other words, advanced data analysis techniques were less used.
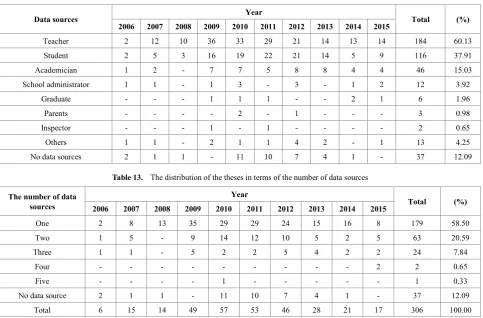
[image:7.595.63.550.159.281.2] [image:7.595.62.552.351.559.2]Table 12. The distribution of the theses in terms of data sources
Data sources Year Total (%)
2006 2007 2008 2009 2010 2011 2012 2013 2014 2015
Teacher 2 12 10 36 33 29 21 14 13 14 184 60.13
Student 2 5 3 16 19 22 21 14 5 9 116 37.91
Academician 1 2 - 7 7 5 8 8 4 4 46 15.03
School administrator 1 1 - 1 3 - 3 - 1 2 12 3.92
Graduate - - - 1 1 1 - - 2 1 6 1.96
Parents - - - - 2 - 1 - - - 3 0.98
Inspector - - - 1 - 1 - - - - 2 0.65
Others 1 1 - 2 1 1 4 2 - 1 13 4.25
No data sources 2 1 1 - 11 10 7 4 1 - 37 12.09
Table 13. The distribution of the theses in terms of the number of data sources
The number of data sources
Year
Total (%) 2006 2007 2008 2009 2010 2011 2012 2013 2014 2015
One 2 8 13 35 29 29 24 15 16 8 179 58.50
Two 1 5 - 9 14 12 10 5 2 5 63 20.59
Three 1 1 - 5 2 2 5 4 2 2 24 7.84
Four - - - 2 2 0.65
Five - - - - 1 - - - 1 0.33
No data source 2 1 1 - 11 10 7 4 1 - 37 12.09
Total 6 15 14 49 57 53 46 28 21 17 306 100.00
As seen in the table 13, the distribution of the theses in terms of the number of data sources is like that: one source is used in 179 (58.50%), two sources are used in 63 (20.59%), three sources are used in 24 (7.84%), four sources are used in 2 (0.65%) and five sources are used in 1 (0.33%) theses. Data sources were not used in 37 (12.09%) theses. These findings show that more than half of the studies were conducted by collecting data from only one stakeholder of curricula.
5. Discussion
It was aimed to examine curriculum evaluation theses made in Turkey between 2006-2015 in this study, and for this reason 306 theses were examined. It is seed that the theses covered in this study were conducted by researchers who did not have decision-making authority generally. This result is understandable, since theses were carried out by master and doktoral students who are independent researchers. On the other hand, the results of curriculum evaluation studies are meaningful when they effect the curriculum as Westbury [28] points out. Otherwise, curriculum evaluation studies can not go beyond providing literary contributions as theoretical and written texts. From this point of view, it can be said that the decision makers should be more involved in curriculum evaluation studies, and take into account the evaluation results in practice. Another result of this study is about the focus of researches. The focus of the studies was on results
generally, and various judgments depending on the results were expressed. Regarding this issue, Fitzpatrick et al. [9] stated that the focus of some curriculum evaluation studies is on results and, in some cases, the focus is on curriculum-related judgments.
As a result of this study, it is seen that the number of curriculum evaluation theses increased between the years 2009-2012, and after 2012 a considerable decrease has started in this issue. In the study conducted by Kurt & Erdoğan [24], it was stated that the number of studies carried out after this date when the curriculum evaluation studies were completed mostly in 2010, is similar to the result of this study. It is clear that the reason of this increase between 2009 and 2012 is the adoption of the constructivism in the primary school curricula in 2005-2006 academic year. The studies were started to evaluate these new curricula and continued for several years. Nevertheless, considering the fact that curriculum development is a dynamic process [3], the significant decline in the number of curriculum evaluation theses after 2012 is expressed as a problematic point.
[image:8.595.64.548.88.406.2]for researchers in educational sciences department and primary school curricula were restuctured between the dates mentioned. Another result of the study is about curriculum selected to evaluate. Five main question should be ansvered in the process of selectin curriculum to evaluate [21]: Can the results of the evaluation influence decisions about the program? Can the evaluation can be done in time to be useful? Is the program significant enough to merit evaluation? Is program performance viewed as problematic? Where is the program in its development? When the theses were analyzed in terms of evaluated curricula, it is seen that primary school curricula restructered in 2005 were evaluated mostly between these dates. With this expected result, it can be said that secondary and higher education curricula should be more evaluated.
In social sciences, quantitative research and qualitative research have some connotations. Quantitative research base on numbers, while qualitative research base on words and visual data. Morever, mixed method can be used in the evaluation of curricula. Quantitative and qualitative researches data collection instruments and data analysis techniques are used in this approach [21]. When the theses are examined in terms of applied research methods, it was found out that approximately half of the theses were of quantitative method, quartet of qualitative method and the remaining quartet of mixed method were used. This result shows that the tendency to use quantitative methods continues in researches, and in particular when the distributions of the theses in terms of the accepted years are examined, it is seen that the qualitative and mixed methods are being used more. Kurt & Erdoğan [24], who achieved a consistent result with this result, explained this by the fact that quantitative researches offer more opportunities to access to people and that they are more economical in terms of duration and cost of implementation. When the distributions of the theses are examined in terms of research model/design, it is seen that the vast majority is realized in the descriptive/survey model. This result can be expressed as an understandable and expected result when it is thought that the curriculum evaluation is generally trying to reveal the situation of the applied curriculum. Nevertheless, it appears that the proportion of experimental designs should be applied, particularly at the point of determining program effectiveness, it remains low. Because the success of a curriculum is directly proportional to the degree to which it achieves its objectives. Therefore, qualitative and mixed designs as well as the experimental design should be included more in the curriculum evaluation studies to be carried out.
Curriculum evaluation requires a systematic research process and can be used in a variety of curriculum evaluation models. Nevertheless, in most of the post-graduate education theses aimed at evaluating a curriculum in Turkey, the evaluation models were not used. This result is in agreement with the result of the work done by Gökmenoğlu [23]. Gökmenoğlu [23] explains that these end result studies are
carried out in areas other than Educational Sciences, Curriculum Development, and Curriculum and Instruction Fields, which do not have sufficient theoretical background about curriculum evaluation, and that these studies are not includedcurriculum development experts as stakeholders. While this view reveals an important detail, it is seen that models are not taken as much basis in the evaluation studies made in the field of Educational Sciences in this study. In the studies using the model, it is seen that Stufflebeam's Context Input Process Product Evaluation Model (CIPP) is consistently consistent with the study done by Kozikoğlu & Senemoğlu [20] and Kurt & Erdoğan [24]. It can be expressible that this model is at the point where it is desirable to offer comprehensive evaluation opportunities for curricula in various dimensions.
Different data collection techniques having pros and cons can be used in the process of curriculum evaluation. The most common data collection techniques are paper and pencil questionnaires, computerized interfaces, interviews (face-to-face, telephone, focus groups). In addition, web-based techniques are used increasingly [29]. When the data collection techniques used in the curriculum evaluation theses are examined, it is seen that surveying/questionnaire is the first one from the quantitative data collection techniques, on the other hand, the interview from the qualitative data collection techniques is the foreground. Survey researches have advenced over the last 20 years, along with advances in tehnology and learning through expanded experiences. The number of surveying companies has increased considerably and surveying has become a massive industry. It is important doing a properly plan and pre-test the survey to provide valid, useful data about curriculum, and then cautiously check data collection and analytical processes [30]. When the number of data collection techniques is examined, it is seen that only one of the data collection techniques is used in the vast majority of studies. This result can be expressed as a lackness of the studies. Instead of using surveys in the evaluation of curriculum, it is necessary to use the scale, which is a more valid data collection tool, as well as the achievement tests to determine the extent to which the curriculum achieves its objectives. From the point of view of qualitative data collection techniques, it is necessary to use observation technique in curriculum evaluation studies, considering that the success of the curriculum in practice can be determined the best by observation technique. Observation can play an important role in curriculum evaluation, and it can provide data comparing the effects of differen curricula in different locations [31]. In addition, using only one data collection technique often does not provide enough rich data. Instead of this, the use of more than one data collection technique in a study enable more sophisticated and reliable data.
groups. Key stakeholders who are the key of evaluation process are asubset group of this comprehensive group [32]. It is observed that the data was collected from teachers in more than half of the theses and this is followed by students and instructors. Kurt & Erdoğan [24] stated that preparing the research problem for teachers and students and making it easier to collect data from these people can explain this situation. On the other hand, this result is understandable, since they are the key stakeholders of the education process. Moreover, in the data collection process, more than half of the theses were found to contain data from only one stakeholder. It is important collecting data from as many stakeholders as possible during the curriculum evaluation process, and it has an important function in terms of the reliability of the results of the evaluation and evaluation from different perspectives. Therefore, more data collection from other stakeholders (administrators, graduated, parents, etc.) should be considered as a recommendation that should be taken into consideration in the course of the curriculum evaluation studies, as well as teachers and students, as well as lecturers who are experts and serve for the purpose of the study.
Statistics can be used in different ways in the process of quantitative data analysis. Statistical programs and contextual factors affect this diversity. Descriptive statistics (univariate statistics, and bivariate statistics), and inferential statistics can be used [33]. In this study, one variable and correlational data analysis techniques are used in nearly half of the theses as quantitative data analysis technique. This result is understandable, since curriculum evaluation studies are generally descriptive studies. Even so, it may be useful to use advanced/inferential statistical methods like structural equation model. On the other hand, it can be challenging to know how to analysis qualitative data, particularly for the evaluator like master and doctoral students. It can be advised a systematic framework (purpose, paradigms, options, interpretations, iterations, standards, ethics, displaying) for analyzing qualitative data [34]. In this study, it is found that especially descriptive analysis technique was used for analyzing qualitative data. Data was formed, thetematized, identifacated and interpretated in this technique [35].
6. Conclusions
Curriculum evaluation is an important process for curricula and education systems. The studies investigated in this research focused more on results than judgements. When the studies analyzed methodological, the results showed that traditional research tendencies (quantitative research method, descriptive/survey design, teachers and students as data source, one variable and correlational data analysis techniques) still continues to be adopted.
REFERENCES
[1] Tyler, R.W. (2014). Eğitim programlarının ve öğretimin temel ilkeleri. Ankara: Pegem Akademi.
[2] Lewy, A. (1977). Handbook of curriculum evaluation. New York: Longman Inc.
[3] Demirel, Ö. (2009). Eğitimde program geliştirme: Kuramdan uygulamaya. Pegem A Yayıncılık.
[4] Ertürk, S. (2013). Eğitimde “program” geliştirme. Ankara: Edge Akademi Yayınları.
[5] Uşun, S. (2012). Eğitimde program değerlendirme. Ankara: Anı Yayıncılık.
[6] Oliva, P. (2009). Developing the curriculum. United States of America: Pearson Education, Inc.
[7] Hakan, A., Sağlam, M., Sever, D. & Vural, L. (2011). Anadolu Üniversitesi Sosyal Bilimler Enstitüsü programlarının değerlendirilmesi. Uluslararası Eğitim Programları ve Öğretim Çalışmaları Dergisi, 1(1), 19-34.
[8] Saylor, J. G., Alexander, W. M., & Lewis, A. J. (1981). Curriculum planning for better teaching and learning. Orlando, Florida: Holt, Rinehart and Winston.
[9] Fitzpatrick, J. L., Sanders, J. R. & Worthen, B. R. (2004). Program evaluation: alternative approaches and practical guidelines. Boston: Pearson Education, Inc.
[10] Stufflebeam, D. L., Madaus, G. F., & Kellaghan, T. (2002). Evaluation models: Viewpoints on educational and human services evaluation. Dordrechts: Springer.
[11] Ornstein, A. C. & Hunkins, F. P. (2004). Curriculum: Foundations, principles and issues. Boston: Pearson/Allyn and Bacon.
[12] Karadağ, E. (2009). Eğitim Bilimleri Alanında Yapılmış Doktora Tezlerinin Tematik Açıdan İncelemesi. Journal of Kirsehir Education Faculty,10(3).
[13] Arık, R. S., & Türkmen, M. (2009). Eğitim bilimleri alanında yayımlanan bilimsel dergilerde yer alan makalelerin incelenmesi. I. Uluslararası Türkiye Eğitim Araştırmaları Kongresi.
[14] Erdem, D. (2011). Türkiye’de 2005–2006 yılları arasında yayımlanan eğitim bilimleri dergilerindeki makalelerin bazı özellikler açısından incelenmesi: Betimsel bir analiz.Eğitimde ve Psikolojide Ölçme ve Değerlendirme Dergisi,2(1). [15] Mısırlı, Ö., & Kurt, A. A. (2010). Bilgisayar destekli
matematik ve geometri öğretimi ile ilgili çalışmaların incelenmesi. In IETC 10th International Educational Technology Conference,
http://www.iet-c.net/publications/ietc2010-1.pdf adresinden (Vol. 15, p. 2010).
[16] Adıgüzel, O. C., & Ergünay, O. (2012). Türkiye’de değerler üzerine gerçekleştirilen lisansüstü tezlerin eğitim bilimleri ve öğretmen yetiştirme perspektifinden incelenmesi. Elektronik Sosyal Bilimler Dergisi, 11(41), 18-33.
[18] Kaytez, N., & Durualp, E. (2014). Türkiye’de okul öncesinde oyun ile ilgili yapılan lisansüstü tezlerin incelenmesi. Uluslararası Türk Eğitim Bilimleri Dergisi, 2014(2).
[19] Hazır-Bıkmaz, F., Aksoy, E., Tatar, Ö., & Altınyüzük, C. A. (2013). Eğitim programları ve öğretim alanında yapılan doktora tezlerine ait içerik çözümlemesi (1974-2009).Eğitim ve Bilim,38(168).
[20] Kozikoğlu, İ., & Senemoğlu, N. (2016). Eğitim Programları ve Öğretim Alanında Yapılan Doktora Tezlerinin İçerik Analizi (2009-2014).Eğitim ve Bilim,40(182).
[21] Newcomer, K. E., Hatry, H. P., & Wholey, J. S. (2010). Planning and designing useful evaluations. Joseph S. Wholey, Harry P. Hatry, Kathryn E. Newcomer (Ed.) in Handbook of practical program evaluation. San Francisko: Jossey-Bass. [22] Özdemir, S. M. (2009). Eğitimde program değerlendirme ve
türkiye’de eğitim programlarını değerlendirme çalışmalarının incelenmesi (ss. 126-149). Yüzüncü Yıl Üniversitesi Eğitim Fakültesi Dergisi, 6(2).
[23] Gökmenoğlu, T. (2015). Geniş açı: modeller ve yaklaşımlar açısından Türkiye’de program değerlendirme çalışmaları. International Journal of Curriculum and Instructional Studies, 4(7).
[24] Kurt, A., & Erdoğan, M. (2015). Program Değerlendirme Araştırmalarının İçerik Analizi ve Eğilimleri; 2004-2013 Yılları Arası. Eğitim ve Bilim, 40(178).
[25] Yıldırım, A. & Şimşek, H. (2011). Sosyal bilimlerde nitel araştırma yöntemleri. Ankara: Seçkin Yayıncılık.
[26] Eisenhardt, K. M. (1989). Building theories from case study research.Academy of management review,14(4), 532-550.
[27] Miles, M. B., & Huberman, A. M. (1994). Qualitative data analysis: An expanded sourcebook. Sage.
[28] Westbury, I. (1970). Curriculum evaluation. Review of Educational Research, 40(2), 239-260.
[29] Cook, S. C., Godiwalla, S., Brooks, K. S., Powers, C. V., & John, P. (2010). Recruitment and retention of study participants. Joseph S. Wholey, Harry P. Hatry, Kathryn E. Newcomer (Ed.) in Handbook of practical program evaluation. San Francisko: Jossey-Bass.
[30] Newcomer, K. E., & Triplett, T. (2010). Using surveys. Joseph S. Wholey, Harry P. Hatry, Kathryn E. Newcomer (Ed.) in
Handbook of practical program evaluation. San Francisko: Jossey-Bass.
[31] Berman, J. C. B., Brenman, J., & Vasquez, V. (2010). Using trained observer ratings. Joseph S. Wholey, Harry P. Hatry, Kathryn E. Newcomer (Ed.) in Handbook of practical program evaluation. San Francisko: Jossey-Bass.
[32] Bryson, J. M., & Patton, M. Q. (2010). Analyzing and engaging stakeholders. Joseph S. Wholey, Harry P. Hatry, Kathryn E. Newcomer (Ed.) in Handbook of practical program evaluation. San Francisko: Jossey-Bass.
[33] Newcomer, K. E., & Conger, D. (2010). Using statistics in evaluation. Joseph S. Wholey, Harry P. Hatry, Kathryn E. Newcomer (Ed.) in Handbook of practical program evaluation. San Francisko: Jossey-Bass.
[34] Rogers, P. J., & Goodrick, D. (2010). Qualitative data analysis. Joseph S. Wholey, Harry P. Hatry, Kathryn E. Newcomer (Ed.) in Handbook of practical program evaluation. San Francisko: Jossey-Bass.
[35] Yıldırım, A. & Şimşek, H. (2011). Sosyal bilimlerde nitel