DEVELOPMENT OF TESTING SYSTEM BASED ON SURFACE WAVE SPECTRAL ANALYSIS (SASW) TECHNIQUE
MUHAMMAD NUR HIDAYAT ZAHARI
A project report submitted in partial
Fulfillment of the requirement for the award of the Degree of Master Electrical Engineering
Fakulti Kejuruteraan Elektrik dan Elektronik Universiti Tun Hussein Onn Malaysia
CHAPTER 1
INTRODUCTION
1.1 Background of study
Seismic waves are waves of energy that travel through the core of the earth such as soil
or other elastic bodies generated from earthquake, explosion, or some other process that
involve the low-frequency acoustic energy. There are two types of seismic waves which
are body and surface waves. Body waves travel through the interior of the Earth follow
ray paths refracted by the varying density and stiffness of the Earth's interior while
surfaces waves travel only on the surface of the Earth. Furthermore, in Civil
Engineering, the term of stiffness is the ratio of the force divided by the displacement
which is applied to materials or structures. High stiffness means that a large force
produces a small displacement. When discussing the stiffness of a material, there is a
relationship between the seismic waves and the surface wave velocity which is called
seismic geophysical technique that important to ensure the durability of the structure or
building to be built. Each ground improvement method needs to take into account the
types of improvement and the deficiencies that are to be remedied. Thus, assessment of
the effectiveness of ground improvement is critical to determine whether the quality of
the works meets the prescribed requirements(Madun, 2012).This technique offers the
method to surface wave velocity parameter in a cost effective way. The analyzing of the
seismic waves is to obtain the phase velocity of the wave travelled through the
the material. This surface wave technique had been used by many researchers, in various
applications such as (Moxhay et al., 2000) in monitoring of soil stiffness during ground
improvement using seismic waves. (Mesures et al., 1994) in surfaces wave velocity
methods that are used to for determining moduli of the ground in situ at low strain.
1.2 Problem Statement
Soil characteristics of earth control the responses to earthquake and dynamic motions for
building or structure. Therefore, stiffness profile of the soil must be determined correctly
in order to get the optimum design in engineering. Lately, seismic wave methods have
been introduced in geophysical engineering. There are many types of seismic
waves, body wave, surface waves, S-waves and P-waves. These are commonly used to
help petroleum engineers decide where to drill for oil. This method also helps civil
engineers determine the thickness of a soil deposit over bedrock. The different type of
seismic wave has been gaining importance for civil engineers which is the surface wave.
A very valuable aspect of the surface wave is in a horizontal layered system, it will
exhibit dispersion which the velocity will vary with frequency or wavelength. The
variation of surface wave velocity with wavelength correlates to the variation of the
earth’s stiffness with depth(Votano et al., 2004). The dispersion curve profile parameter
is crucial for predicting the deformation of material and foundation that may arise from
loads imposed by civil engineering structures. However, existing method only focus
using P-wave such as coring test to determine the structure properties profile and
destructive testing will be conducted. Therefore, surface wave method approached in
this study is important to ensure the integrity of the foundation on which the structure is
to be built without damaging the material. In this research spectral analysis surface wave
(SASW) technique will be applied to characterize dispersion curve material profile by
varying the frequency via surface wave testing system. Thus the testing and data
1.3 Aim and Objectives
The aim of this project is to develop a testing system based on surface wave spectral
analysis technique. This system should be applied on material or soil thus to evaluate the
dispersion curve profile.
In order to achieve this aim, the objectives of the study are formulated as follow:
1. To develop surface wave system based on SASW technique.
2. To identify suitable data processing technique such as data acquisition in order to
determine the dispersion curve profile of phase velocity material profile.
3. To identify suitable surface wave testing system for laboratory scale experiment
1.4 Scope of study
This research will focus on the source signal, which is propagated by piezoelectric
transducers and studying the effect and relationship between source and data acquisition
Body Wave
P Wave
CHAPTER 2
LITERATURE REVIEW
2.1 Seismic Wave
When mechanical energy is introduced to a medium, it induces the propagation of
seismic waves (Phillips, 2004). Seismic waves are predicted during the 19thcentury. It is
similar to sound waves except that the periods of oscillations are far longer. The
frequency range of these waves is large from as high as the audible range to as low as
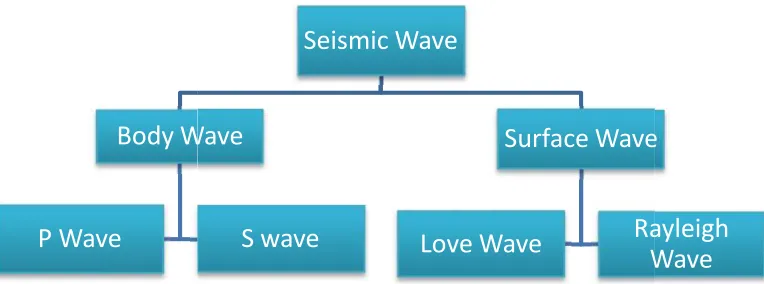
the free oscillations of the entire earth. There are two types of seismic waves which is
body and surface waves. P-wave or Primary wave and S-wave or Shear wave are also
known as Body wave. In surface wave, there are two types of wave which are Rayleigh
[image:5.612.130.512.552.694.2]wave and Love wave. Figure 2.1 below shows the chart type of seismic wave.
Figure 2.1: Type of seismic wave chart
Seismic Wave
Body Wave
S wave
Surface Wave
Love Wave
Rayleigh
Wave
CHAPTER 2LITERATURE REVIEW
2.1 Seismic Wave
When mechanical energy is introduced to a medium, it induces the propagation of
seismic waves (Phillips, 2004). Seismic waves are predicted during the 19thcentury. It is
similar to sound waves except that the periods of oscillations are far longer. The
frequency range of these waves is large from as high as the audible range to as low as
the free oscillations of the entire earth. There are two types of seismic waves which is
body and surface waves. P-wave or Primary wave and S-wave or Shear wave are also
known as Body wave. In surface wave, there are two types of wave which are Rayleigh
wave and Love wave. Figure 2.1 below shows the chart type of seismic wave.
Figure 2.1: Type of seismic wave chart
Surface Wave
Rayleigh
Wave
CHAPTER 2LITERATURE REVIEW
2.1 Seismic Wave
When mechanical energy is introduced to a medium, it induces the propagation of
seismic waves (Phillips, 2004). Seismic waves are predicted during the 19thcentury. It is
similar to sound waves except that the periods of oscillations are far longer. The
frequency range of these waves is large from as high as the audible range to as low as
the free oscillations of the entire earth. There are two types of seismic waves which is
body and surface waves. P-wave or Primary wave and S-wave or Shear wave are also
known as Body wave. In surface wave, there are two types of wave which are Rayleigh
wave and Love wave. Figure 2.1 below shows the chart type of seismic wave.
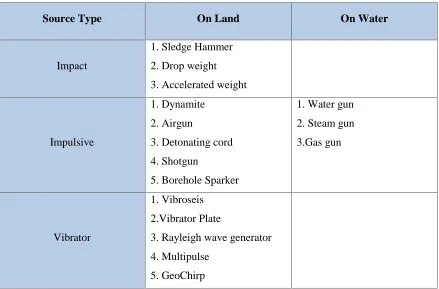
2.2 Seismic Energy Sources
A seismic source can be derived as a tools or devices that controlled the seismic energy.
Seismic source are widely used in seismic surveys such as investigate shallow subsoil
structure or to study deeper structure. The requirement of using seismic source are listed
in Table 1 below. The selection of appropriate seismic source is very important for
particular surveys to ensure a large amount of signal produced sufficient energy to
penetrate the ground or material sub surface. An overview about the difference types of
seismic source have been given by Miller et al., (1986).
Table 1: Seismic source type (Source from Reynolds, J.M book "An introduction to
applied environmental geophysics")
Source Type On Land On Water
Impact
1. Sledge Hammer
2. Drop weight
3. Accelerated weight
Impulsive
1. Dynamite
2. Airgun
3. Detonating cord
4. Shotgun
5. Borehole Sparker
1. Water gun
2. Steam gun
3.Gas gun
Vibrator
1. Vibroseis
2.Vibrator Plate
3. Rayleigh wave generator
4. Multipulse
[image:6.612.109.548.379.668.2]2.3 Seismic Surface Wave Technique
Surface waves can only be generated at free boundary which is divided into two types
such as Rayleigh wave and Love wave. Rayleigh waves are named after Lord Rayleigh
(John William Strutt, 3rd Baron Rayleigh, OM) who predicted their existence in 1885.
The Rayleigh wave is a function of frequency and this dependence is strictly related to
the mechanical parameters of the medium (Geotecnica, 2000). Furthermore, the
properties of Rayleigh waves indicate that it can always be generated on a free surfaces.
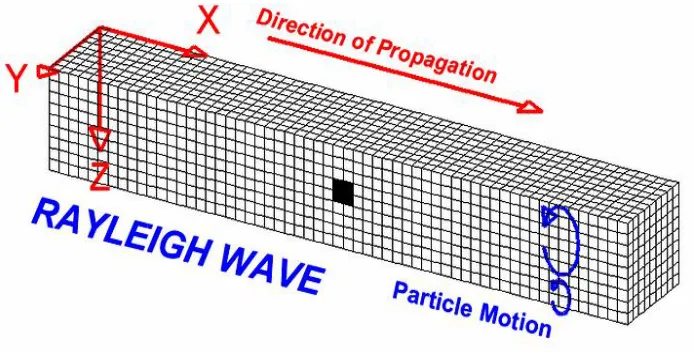
Rayleigh waves, which are characterized as high amplitude and low-frequency surface
waves, are usually dispersive in a non homogeneous medium (Min & Kim, 2006). The
particle motion of this Rayleigh wave is a combination of longitudinal and vertical
vibration that give elliptical motion to the structure are illustrated as figure 2 below.
Rayleigh wave show dispersion and its velocity is not constant but varies with
wavelength. Therefore, Surface wave technique is very powerful tools that have been
used by many researchers. For example, surface wave testing such as a spectral analysis
of surface wave (SASW) method (Alam & Mcclellan, 2003) and continuous surface
[image:7.612.155.502.463.639.2]wave (CSW) method (Moxhay et al., 2000).
Figure 2.2: Rayleigh wave motion. Source:(www.geo.mtu.edu/UPSeis/waves.html) 2.3 Seismic Surface Wave Technique
Surface waves can only be generated at free boundary which is divided into two types
such as Rayleigh wave and Love wave. Rayleigh waves are named after Lord Rayleigh
(John William Strutt, 3rd Baron Rayleigh, OM) who predicted their existence in 1885.
The Rayleigh wave is a function of frequency and this dependence is strictly related to
the mechanical parameters of the medium (Geotecnica, 2000). Furthermore, the
properties of Rayleigh waves indicate that it can always be generated on a free surfaces.
Rayleigh waves, which are characterized as high amplitude and low-frequency surface
waves, are usually dispersive in a non homogeneous medium (Min & Kim, 2006). The
particle motion of this Rayleigh wave is a combination of longitudinal and vertical
vibration that give elliptical motion to the structure are illustrated as figure 2 below.
Rayleigh wave show dispersion and its velocity is not constant but varies with
wavelength. Therefore, Surface wave technique is very powerful tools that have been
used by many researchers. For example, surface wave testing such as a spectral analysis
of surface wave (SASW) method (Alam & Mcclellan, 2003) and continuous surface
wave (CSW) method (Moxhay et al., 2000).
2.4 Spectral Analysis Surface Wave Method
Spectrum Analysis of surface waves (SASW) is one of the most effective non-invasive
methods for soil characterization (Alam & Mcclellan, 2003.). SASW typically used in
site investigations for foundation engineering design and settlement prediction in
geotechnical technology. SASW is a non destructive and in situ method used for
determining the thickness and elastic properties of pavement and soil sites using the
dispersion characteristic of surface wave (Al-Hunaidi, 1993). The energy of Rayleigh
waves from the source propagate mechanically along the surface of media and their
amplitude decrease rapidly with depth (Rosyidi, 2004). The technique that is used in
determining the dispersion curve (Phase velocity VS Frequency) was introduce by
SASW method which is possible to calculate the parameter of the medium either on free
surface of the boundary. SASW methods are followed by two aspects of procedures
which is considered as relative phase angle unwrapping and source-to-near-receiver
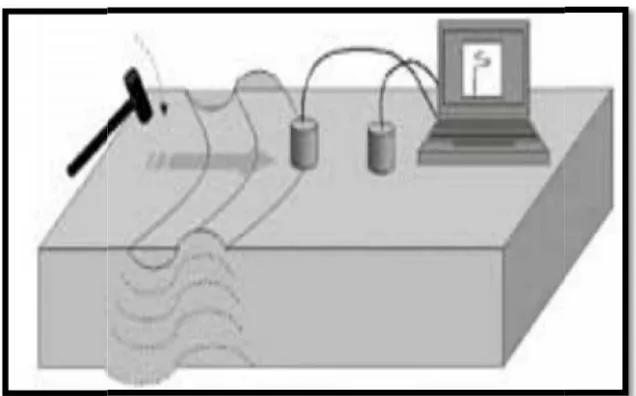
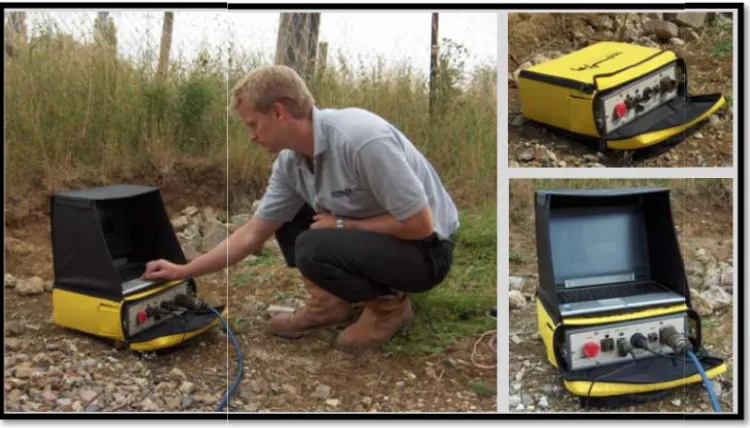
distance (Al-Hunaidi, 1993). Figure 3 and Figure 4 show the application of SASW
[image:8.612.175.493.448.646.2]technique.
Figure 2.3: SASW Principle testing Kit. Source; (http://www.forcetechnology.com) 2.4 Spectral Analysis Surface Wave Method
Spectrum Analysis of surface waves (SASW) is one of the most effective non-invasive
methods for soil characterization (Alam & Mcclellan, 2003.). SASW typically used in
site investigations for foundation engineering design and settlement prediction in
geotechnical technology. SASW is a non destructive and in situ method used for
determining the thickness and elastic properties of pavement and soil sites using the
dispersion characteristic of surface wave (Al-Hunaidi, 1993). The energy of Rayleigh
waves from the source propagate mechanically along the surface of media and their
amplitude decrease rapidly with depth (Rosyidi, 2004). The technique that is used in
determining the dispersion curve (Phase velocity VS Frequency) was introduce by
SASW method which is possible to calculate the parameter of the medium either on free
surface of the boundary. SASW methods are followed by two aspects of procedures
which is considered as relative phase angle unwrapping and source-to-near-receiver
distance (Al-Hunaidi, 1993). Figure 3 and Figure 4 show the application of SASW
technique.
Figure 2.4: Testing SASW kit on soil. Source; (http:// www.gdsinstruments.com)
2.5 Data Acquisition
Data acquisition is the process of sampling signals to determine the conditions of the
signal and converting the resulting samples into digital that can be manipulated by a
computer. Data acquisition systems actually convert analog waveforms into digital
values for processing by using computer. The components of data acquisition systems
can be divided into three as follows:
i) Sensors that convert physical parameters to electrical signals.
ii) Signal conditioning circuitry to convert sensor signals into a form that can be
converted to digital values.
iii) Analog-to-digital converters, which convert conditioned sensor signals to digital
values.
DAQ hardware is what usually interfaces between the signal and a computer.
National Instruments DAQ is the most trusted computer-based measurement hardware
available. Innovative DAQ hardware and NI-DAQmx driver technologies gives better Figure 2.4: Testing SASW kit on soil. Source; (http:// www.gdsinstruments.com)
2.5 Data Acquisition
Data acquisition is the process of sampling signals to determine the conditions of the
signal and converting the resulting samples into digital that can be manipulated by a
computer. Data acquisition systems actually convert analog waveforms into digital
values for processing by using computer. The components of data acquisition systems
can be divided into three as follows:
i) Sensors that convert physical parameters to electrical signals.
ii) Signal conditioning circuitry to convert sensor signals into a form that can be
converted to digital values.
iii) Analog-to-digital converters, which convert conditioned sensor signals to digital
values.
DAQ hardware is what usually interfaces between the signal and a computer.
National Instruments DAQ is the most trusted computer-based measurement hardware
accuracy and maximized performance. Regardless of our application, whether for basic
measurements or complex systems, NI has the right tools for the job. The two-station
acquisition pioneered by Jones (1958, 1962) and Ballard (1964) developed to become
the SASW test (Nazarian and Stokoe, 1984; Stokoe et al., 1994) has been widely used
for geotechnical characterization and for pavement assessment (Socco & Strobbia,
2004).
2.6 Preceding study
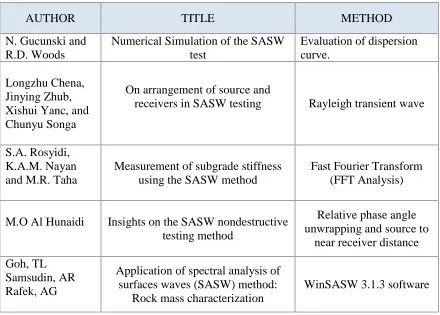
In this part, Table 2 below shows the previous research about the development of
[image:10.612.108.548.379.694.2]spectral analysis of surface wave technique studied by using different method.
Table 2: Method from previous research
AUTHOR TITLE METHOD
N. Gucunski and R.D. Woods
Numerical Simulation of the SASW test
Evaluation of dispersion curve.
Longzhu Chena, Jinying Zhub, Xishui Yanc, and Chunyu Songa
On arrangement of source and
receivers in SASW testing Rayleigh transient wave
S.A. Rosyidi, K.A.M. Nayan and M.R. Taha
Measurement of subgrade stiffness using the SASW method
Fast Fourier Transform (FFT Analysis)
M.O Al Hunaidi Insights on the SASW nondestructive testing method
Relative phase angle unwrapping and source to
near receiver distance
Goh, TL Samsudin, AR Rafek, AG
Application of spectral analysis of surfaces waves (SASW) method:
Rock mass characterization
2.6.1 Numerical Simulation of the SASW test (Gucunski & Woods, 1992).
This paper proposed the seismic wave SASW method in order to obtain and evaluate the
dispersion curve on several of soil condition. The SASW method basically operates with
the dispersion of Rayleigh wave in layer systems which are propagated in different
frequency and velocity. The SASW test basically has three basic development such as
collection data, evaluation of Rayleigh wave dispersion curve and also inversion of
dispersion which is manually conducted by user. This paper actually produced the
numerical modeling of SASW test on various situation of soil profiles or condition.
Average dispersion curves have been combine which are the dispersion curves for
several receiver spacing and two direction of dispersion curve. Moreover, they have
compared the inversion process to theoretically defined as solution. In this paper, the
author proposed the receiver spacing range of 0.5 till 1 s. However, source near to the
receiver distance had the least affected on the scattering the dispersion curve. The
dispersion curve from SASW test can differ significantly. That can cause Heisey’s
criteria to only accept the wavelength that is too close to the source which is still in
process and possible interference that are more near or closer to the source. The
coherence function has been used in this paper as a corrector to the ambient noises
which are from attenuation signal when constructed the testing field. Finally, this paper
shows the dispersion curve that is only affected by the source to near receiver spacing.
Thus, the approach of this paper will be applied in this study for example the evaluation
of dispersion curve in order to get the stiffness profile of the material.
2.6.2 On arrangement of source and receivers in SASW testing (Chen et al., 2004)
This paper investigated the arrangement of source and receiver on Rayleigh Wave
dispersion curve by SASW testing. To overcome the error of Rayleigh wave phase
velocity measurement, this paper proposed difference Poisson’s ratio of soil or saturated
velocity Vs of the material by Poisson’s ratio, v. Therefore, if Rayleigh Wave can be
measured, the shear wave velocity can be easily determined. In real situation, ideal of
surface wave is difficult to generate. So, SASW method is used to apply the transient
wave on the surface of the soil. The Rayleigh wave assumption is valid only when the
source and receiver arrangement meet certain criteria which are affected by Poisson’s
ratio. In order to achieve this study, the Rayleigh wave method that approach from this
paper will be applied in order to differ or compare the result each of the materials or
samples.
2.6.3 Measurement of subgrade stiffness using the SASW method (Rosyidi, 2004)
This paper has developed the SASW method to estimate the stiffness of pavement
profile foundation. The accurate parameter information such as the elastic moduli and
thickness of the various pavement layers are used to calculate the load capacity and also
estimate the properties of road itself in order to predict the performance and design of
the pavement profiles. In this paper, the SASW method is based on Rayleigh Wave
dispersion curve in order to determine the shear wave velocity, modulis, and depth of
each layer. This paper has discussed the theory, role and method of SASW in order to
evaluate the pavement profile. The test of SASW has been conducted at Universiti
Kebangsaan Malaysia (UKM), Bangi. All data that have been tested are transformed into
frequency domain by using Fast Fourier Transform (FFT) analysis method of spectrum
analyzer. There are two functions of frequency domains which are the coherence
function and the phase information of transfer function. The coherence functions are
used to inspect or evaluate the quality of signal by Signal to Noise Ratio while transfer
function spectrum is used to obtain the relative phase shift between two signals. All the
data are unwrap in order to get the dispersion curve. This paper is able to characterize
the stiffness of pavement profile in term of shear wave velocity by using SASW method.
Thus, the FFT analysis method approach by this paper will be applied for this study in
2.6.4 Insights on the SASW nondestructive testing method (Al-Hunaidi, 1993)
This paper proposed the procedures of the SASW technique which are the relative phase
angle unwrapping and source to near receiver distance. These methods have major
advantages in performing the test in a short period and also cause no physical damage to
tested material. A vertical vibration placed on the surface of the sublayer or soil is used
as a source. The vibration transducer will produce certain frequency by tuning the
source. Computer simulation of surface waves test have been conducted in this paper.
The purpose of the simulations is to clarify the errors in the dispersion curves when the
SASW test and data analysis are performed with the procedures. By the way, the phase
unwrapping procedure may be not reliable or suitable for some surfaces of material.
However, another alternative procedure is needed such as to calculate the time delay
between the SASW receivers. By using the simulated wave at the surface, this study
demonstrated that source near the receiver distances taken to be equal to the spacing
between the receiver and the wavelength should be greater than ½ the receiver spacing
insufficient to ensure the condition that the measured wave only for considered site or
material. In other hand, the procedure approach from this paper can be used in this study
in order to determine the phase velocity or dispersion curve.
2.6.5 Application of spectral analysis of surfaces waves (SASW) method: Rock
mass characterization (GOH et al., 2011)
This paper is proposed to determine the Rock Quality Designation (RQD) by using
spectral analysis of surface wave (SASW). Soil and rock engineering usually perform
the Standard Penetration test (SPT) and seismic test. The SPT test normally involved
drilling and laboratory works and in high cost, while seismic test are fast, cheap, non
destructive and easy to operated for rock mass characterization. In this study, WinSASW
3.1.3 was used for inversion processing of SASW data to get the shear wave velocity
detected by two receiver and recorded by a spectrum analyzer. After performing the test,
the difference between RQD value from SASW test and those discontinuity surveys are
less than 10%. In other hand, the SASW test is valid in seismic application for RQD
measurement. Thus, the steps, procedures and approach that have been used in this paper
will be used in the study. However, data acquisition DAQ will be used to analysis of the
CHAPTER 3
METHODOLOGY
3.1 Research Flowchart
The step and flow of this research are shown from the research flow chart as in figure
3.1 and 3.2. This research can be divided into two part which are the hardware and
[image:15.612.270.393.430.642.2]software development.
The hardware part is by using DAQ tools by National Instruments to collect the data
from the seismic wave source via piezoelectric transducer. The data will be used to
conduct the analysis of the surface wave system which consists of two main process
such as adjusting the receiver spacing and varying the frequency. The recorded signal
from transceivers or source will be transformed into frequency domain using Fast
Fourier Transform (FFT) analysis method and develop the dispersion curve (wavelength
VS phase velocity). The result will be determined and discuss after these two of main
data processing have been analyzed.
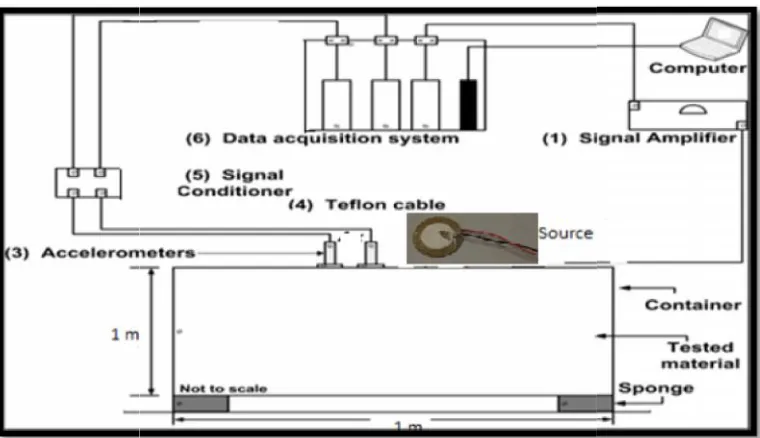
3.2 Hardware Development
Figure 3.3 below shows the diagram of the hardware setup in the laboratory in order to
[image:17.612.159.539.382.601.2]develop the seismic surface wave system.
Figure 3.3: Hardware set up for seismic surface wave in the laboratory
Based on Figure 3.3, a source with a piezoelectric transducer is applied on the tested
material which, in this research, is the concrete block to perform the test. An impact The hardware part is by using DAQ tools by National Instruments to collect the data
from the seismic wave source via piezoelectric transducer. The data will be used to
conduct the analysis of the surface wave system which consists of two main process
such as adjusting the receiver spacing and varying the frequency. The recorded signal
from transceivers or source will be transformed into frequency domain using Fast
Fourier Transform (FFT) analysis method and develop the dispersion curve (wavelength
VS phase velocity). The result will be determined and discuss after these two of main
data processing have been analyzed.
3.2 Hardware Development
Figure 3.3 below shows the diagram of the hardware setup in the laboratory in order to
develop the seismic surface wave system.
Figure 3.3: Hardware set up for seismic surface wave in the laboratory
Based on Figure 3.3, a source with a piezoelectric transducer is applied on the tested
source on a tested material is used to generate the Rayleigh waves. The development of
more powerful computers for signal processing and for numerical analysis has enabled
the SASW method to be more practical (Ismail et al., 2012). The experiment will be
carried out by using computer system with Matlab platform.
The computer will be connected to the National Instruments data acquisition
system, in which an analogue output module (NI-9263) will generate the transmitted
waveforms. On the receiver side, the sensors consist of two piezoelectric accelerometers.
The accelerometer was connected via cable to an analogue signal conditioner. The
seismic signals are then sampled by analogue-to-digital converter module (NI-9239).
Table 3 below shows the general properties each of the hardware used in this research.
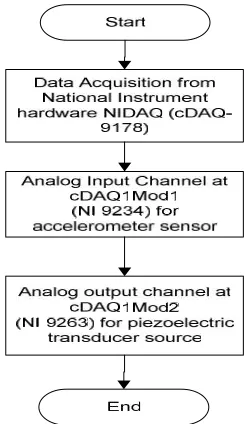
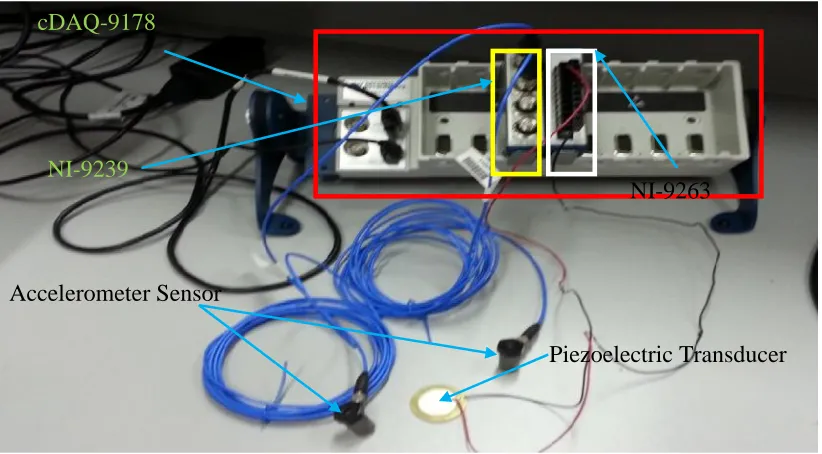
Figure 3.4 below shows the hardware cDAQ-9178 that has been used in order to develop
[image:18.612.155.566.383.610.2]the seismic surface wave system via SASW technique.
Figure 3.4: NIDAQ hardware setup with cDAQ-9178
Collected data were stored, and then will be processed after the completion of a data
acquisition session. The two receivers placed along a straight line will detect the
cDAQ-9178
Accelerometer Sensor
Piezoelectric Transducer NI-9263
transient signal produced by the vertical impact source. The signals are recorded using
data acquisition system. The next process is to transform the time domain signals to
frequency domain using Fast Fourier Transforms to have better analysis with the
measurement. The coherent between the signals and the phase information of the
[image:19.612.108.535.233.697.2]transfer function are evaluated from the output.
Table 3: List of Hardware with Description
No. Hardware Description
1. Sensor Piezoelectric accelerometers (model
352C42 from PCBpiezotronics) with a
frequency range of 1 Hz to 10 kHz
2. DAQ Platform (cDAQ - 9178) The computer will be connected to a
National Instruments data acquisition
system, in which a 16-bit analogue output
module (NI-9263) will generate the
transmitted waveforms.
The input seismic signals are then sampled by a 24-bit sigma-delta analogue-to-digital
converter module (NI-9239) with a
sampling rate of 50 kHz.
3. Signal conditioner The accelerometer was connected via cable
to an analogue signal conditioner
(model482C05)
4. Piezoelectric Transducer These ceramic piezo transducer
elements generate a range of audible
tones and frequencies when energised Piezo transducer generate the Rayleigh
waves.
They withstand severe environmental conditions and prove durable in
domestic appliances without causing RF
interference.
5. NI-9234 The NI 9234 have four-channel with
signal acquisition module for making
high-accuracy measurements from
integrated electronic piezoelectric
(IEPE) and non-IEPE sensors
6. NI-9263 The NI 9263 have 4-channel, 100 kS/s
simultaneously updating analog output
module for any NI CompactDAQ The NI 9263 also features ±30 V
overvoltage protection and short-circuit
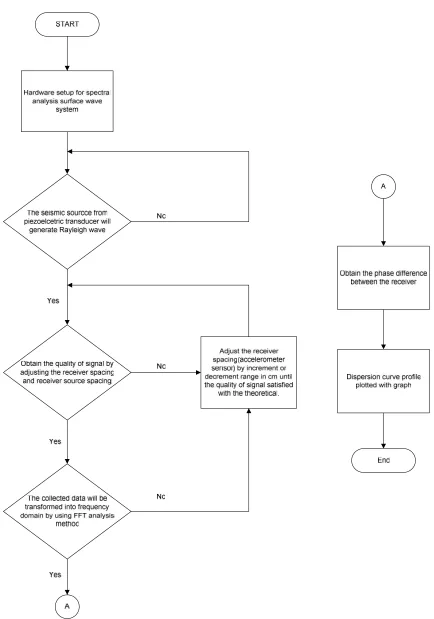
3.3 Software Development
Based on Figure 3.5 below, the test required a vertically oriented impact source from
piezoelectric transducer enabling the generation of Rayleigh wave over a wide frequency
bandwidth. The receivers are arranged to be in line with the source (Hunaidi et al.,
[image:21.612.126.559.236.662.2]2002).
Vertical motion induced by the source at the free surface of the material is detected by
the two receivers or accelerometer sensors and recorded in time domain. The data will
be transformed using Fast Fourier Transform (FFT) to get the frequency domain and
unwrap the phase angle to get phase velocity versus frequency graph of dispersion
curves. The phase differences between the signal captured from two receivers can be
determined. The signals picked up by the receivers are recorded and Fourier
Transformed by using a Fast Fourier Transform (FFT) analyzer to obtain the relative
phase between the receivers as a function of frequency (Al-Hunaidi, 1993). Furthermore,
the phase velocity can be calculated by using approximation method but least exact. The
amplitude of surface wave is attenuated linearly with depth and can be represent by a
direct relationship of equation 2. First, the travel time needs to be measured by using;
Δt =
(Ø)
(1)
Where Δ(Ø) = Phase difference at frequency
f= Frequency to which the time difference applied
Relationship between theΔt andΔ (Ø) can determine the phase velocity by using;
Vph =
(2)
Where D = Distance between sensor
Δt = Frequency Dependent time difference
If wavelength is required, therefore;
=
(3)
Where V = Phase velocity
The approximation method is commonly used as documented in the literature (Jones,
1958; Heukolom and Foster, 1962; Ballard and Mclean, 1975; Abbiss, 1981).
The known material which is concrete material will be used to verify this system.
The types of concrete will be used in this study is concrete mortar. The reason why
concrete mortar material has been chosen for this research is because concrete mortar
properties such as density and moisture content, is not influenced by the ambient
environment such as water effect and duration of time during the experiment. To
construct the concrete mortar model, sand, cement and also water are used. The
measured concrete stiffness using this system will be verified using theoretical of
concrete mortar itself. The surface wave velocity in the concrete mortar block was
expected to be approximately 300 m/s -400 m/s.
3.4 Receiver Spacing
The arrangement of receiver and excitation transmitter arrays is subject to the near and
far offset constraints (Heissey et al., 1982). These constraints control the wavelength
from the signal therefore, it is important to determine the minimum and maximum
frequency for spectral analysis using FFT. The empirical study for the near offset
constraint of the distance between the source and the first receiver, dminis recommended
in the literature (Alhunaidi, 1993; Matthews et al., 1996; Park et al., 1999) as s function
of the surface wave wavelength, to be approximately :
dmin >
(4)
When the receiver is far away from the seismic source, then the constraint can be
approximately:
So, the spacing between the receivers,Δx, is should be:
Δx <
(6)
The phase difference between pair of receivers can be determined. To avoid aliasing
between the receivers, the λmin and λmax are corresponding to minimum and maximum
frequency that can be generated by the seismic source. A more detailed study on the data
acquisition of Rayleigh wave was carried out by Xia et al., (2006).
3.5 Experimental Setup and Calibration
To evaluate the viability of this study, a laboratory scale experiment was carried out.
The purpose of performing the laboratory scale experiment instead of a field test is that
the data collection can be pre calibrated and the truth data regarding the material can be
measured. In this study, a concrete mortar box were constructed with dimension 1500
mm x 1000 mm x 1000 mm in length, width and depth such as figure 3.6 below. The
mortar concrete were constructed with a mixture of fine sand and cement with ratio 1:15.
The mortar was chosen because its geotechnical properties such as moisture content easy
[image:24.612.231.448.523.693.2]to control within the duration of the experiment.
A portable ultrasonic velocity profiler was used to measure the P-wave velocity
on the mortar concrete and the measurement was in range within the range 600 m/s to
700 m/s. The Rayleigh wave phase velocity of homogenous in concrete mortar block
was expected to be approximately 1000 m/s (khan et al 2006). However, in this study
the ratio 1:15 of the concrete are used, therefore the phase velocity of the concrete
mortar approximately within the range of 300 m/s to 400 m/s.
3.6 Experimental Procedure
The array of receiver consisted of two piezoelectric accelerometers. The receiver array
was then moved after each measurement in order to obtain the data for each range
between the source and the receiver. Firstly, the distance between the source and the first
[image:25.612.185.471.362.593.2]receiver, d was set up as 50 mm such as figure below:
Figure 3.7 : Sensor Arrangements
By using the constraint given in equation 4 and equation 5, and assuming the Rayleigh
wave phase velocity as 300 m/s to 400 m/s, the applicable frequency range from the
piezoelectric transducer was between the 500 Hz to 10 KHz. More sequence of data