Journal of Chemical and Pharmaceutical Research, 2014, 6(6):1433-1440
Research Article
ISSN : 0975-7384
CODEN(USA) : JCPRC5
Research on human factor accident based on link prediction
Ma Jun and Wan Jie
School of Safety and Environment Engineering, the Capital University of Economics and Business, Beijing, China
_____________________________________________________________________________________________
ABSTRACT
The research on man-machine relationships is an important problem in field of man-machine system. A single factor is considered in much humane error analysis, but very valuable potential factors are not considered in many humane error analysis. In this paper, the link prediction technique is introduced to resolve the multiple factors relation problems associated with the degree of relevance and importance factors index system. The algorithm used to calculate the correlation degree and importance of factors is designed. Finally, the man-machine system of train is used as example of humane error analysis to verify a positive role during of discovering the potential danger by new index system.
Key words: Link prediction, algorithm, relative factors, man-machine system, potential danger
_____________________________________________________________________________________________
INTRODUCTION
In the man-machine system environment, man-machine relationships are the core of the system while environment is the constraints of the system. With increasing degree of automation, the system on the surface seems to reduce the dependence on people, but in the system design, production and use phases, human-beings play an important role [1]. Due to human nature, the effects have somewhat inferior, which will inevitably affect the reliability of the system because there always is the probability of false implementation by human. Meister's research shows that human errors account for 20% -50% of all equipment failure [2].
Human factor errors or factors are result from many aspects, such as an excessive burden that are out of control on the operator, fatigue, and the overall quality of people and so on. Human factor errors may not necessarily lead to human accident, but hidden human accident. Because of the multidimensional nature of human errors, it is necessary to analyze the human factor accidents to find human errors which easily lead to human accidents.
In human factor error correlation analysis, if two human factor errors are very highly correlated, then if any one human factor error occurs, it needs to pay special attention to other human errors’ occurring. And the correlation between factors will increase the likelihood of accidents [3]. Because the correlation between the two factors means that a hazard will stimulate other risks, thereby increasing the level of risk. On the other hand, correlation between factors can also be diverse, pluralistic [4]. Correlation analysis is relatively complex. The complexity of a problem is an issue to focus on. Therefore, it is practically impossible to focus on next most likely risks after the analysis of multiple risks. Usually when finding a hidden danger, it requires an immediate attention to other highly correlated with hidden danger [5][6][7].
In this paper, the process of railway traffic accidents of human factor errors have been selected as an object of the study, in the establishment of a binary relation to introduce link prediction of complex networks to establish multiple correlations with mathematical model and to verify the proposed method by example effectiveness[8][9].
ESTIMATION METHOD OF CORRELATION COEFFICIENT
In Human factors accident analysis, correlation is a key point in analyzing human factors error and human factors accidents, usually correlation analysis method is used, while the correlation is a relatively general concept, in actual analysis, it needs to objectivize correlation into some quantitative indicators. Typically correlation coefficient of two random variables X and Y are estimated by the sample correlation coefficient r (X, Y):
2 2
(x
)(y
)
(x, y)
(x
)
(y
)
i i i i
x
y
r
x
y
−
−
=
−
−
∑
∑
∑
(1)If only X is associated with the y and Y is only related to X, then the greater r (x, y) is, the highercorrelation between X and Y is. However, when a random variable may be associated with multiple random variables, it will produce multiple correlation problems. If X, Y, Z three random pairwise correlation coefficients between variables are high, then Y will not be able to explain X well, because in fact, the real impact of X is Z, and X and Y are somewhat reflection of Z while direct relationship between X and Y may not be close.
Specific to the case of human factors accident analysis, due to existing relevance of human errors,it is difficult to accurately estimate the degree of correlation between them which cannot be launched by other variables because of human factors errors of the correlation coefficient.
B. Multiple correlation
Considering only the case of binary relationship, relationship between human error factors are measure by correlation coefficient. Problems related to the multiple correlation between the measured variables become complicated, thus in the actual human factors accidents analysis, it is difficult to find the main cause of the accident and the relationship between factors analysis due to multiple correlations between factors. Therefore, this paper introduces a complex network link prediction method to solve this problem.
For a self-loop-free undirected unweighted graph G, if the right side of (x, y) of weight is unknown, the weight is estimated by using the following indicators.
For any node x and y, if x ≠ y, there including the right CN (Common Neighbors, common neighbors) index [4].
( ) ( )
( , )
2
xz zy
z T x T y
w
w
s x y
∈ ∩
+
=
∑
(2)
T (X) is a neighbor of X,
w
xzis the weight of from right side of X to Z. Therefore, s (x, y) is related to the weight ofthe right half side of X and Y’s common neighbors. From the statistical sense, the greater CN index is, the greater the weight of expectations on even edge between two nodes. However, the index value CN is not directly connected to the estimated value of x-and y-edge weights w (x, y). Unknown w (x, y) is regressed by known w (x, y) and the corresponding s (x, y). Since the graph G is not self-loop, from x to its own weight of the edges is 0, then it can be required s (x, x) = 0.
In the case of human factors accident analysis, it is not necessary to obtain w (x, y) because w (x, y) does not need to be obtained through a link prediction. And s (x, y) here reflects another meaning, that is, in the degree of association of two random variables, ingredients which can be interpreted other related random variables.
If consider the number of human factors accidents and number of person’s human error as a node, consider the correlation coefficient between any two random variables as even the edge weights, it will constitute a weighted network G. For any two nodes in the correlation between x and y is analyzed by the following steps:
Even edge Step1. Omitted edged of G between x and y
Step2. According to other information of the network, calculate x and y of CN index s (x, y) by weighted link prediction method.
(x, y)
(x, y)
(x, y)
r
c
m
s
=
(3)
In formula (3), other factors brought by the correlation is actually a form of punishment because s (x, y) is in the denominator, will weaken the correlation between variables. Therefore, c (x, y) between the actually measured correlation of X and Y , which cannot be explained by other variables.
(3) The index has a drawback in the index.: if r (x, y) and s (x, y) are both small, but c (x, y) is probably large: In this regard, a threshold value can give α, only | r (x, y) |> α, the formula (3) is applicable for the case of N in the formula (3), the direct provision c (x, y) = 0. In this paper, taking α = 0.1.
CALCULATION OF IMPORTANCE DEGREES OF FACTORS
In human factors accident analysis, should not only know the relevant factors leading to accidents coupling problems, but also know which factors the key factors are, leading to human accident. Importance of factors consists of two aspects: Firstly, the direct correlation factors of the accident; secondly, factors driving and other factors that ultimately lead to the indirect correlation accident. Direct correlation is obtained by using equation (3), to calculate the human factors errors and human factors accidents of correlation, and in an indirect measure of correlation, it needs to appropriately improve formula (3), the specific method is multiplied by a decay factor.
Since c (i, j) of formula (3) are between 0 and 1, and it has weakened the multiple correlations between factors, so it can consider c (i, j) as the attenuation factor to build a degree of importance of each factor index mathematical expression:
1
(0, )
( , ) (0, )
n
i
j
F
c
i
c i j c
j
==
+
∑
(3)
N is total number of factors, c (0, j) represents the j-th correlation factors of human factors accident, c (i, j) represents correlation factors of the i-th and j-th factors. Equation (3) actually represents a correlation of sum: one factor leading to other factors, plus their own contribution to the accident, and then multiplied by the corresponding attenuation factor when summed.
EMPIRICAL ANALYSIS
A. create the sample space
Data are collected from human factors accidents investigation report of Shenyang railway traffic system [5], extracting the number of accidents and 14 occurrences of human errors, are divided into nine chronological sample (see table below).
Tab. 1: Statistical data of accidents & errors due to human factor in the railway system
Year A B C D E F G H I J K L M N O 2001(1) 3 0 0 4 0 1 0 2 1 3 0 1 0 0 1 2001(2) 9 0 2 1 2 1 2 0 4 1 1 0 0 0 2 2002(1) 9 1 2 3 3 1 1 0 0 5 1 2 0 1 1 2002(2) 6 0 0 2 0 1 1 0 1 1 0 1 0 0 1 2003(1) 1 1 0 0 0 0 1 0 2 0 2 0 0 0 1 2003(2) 32 1 12 11 2 6 9 2 12 15 3 4 0 8 4 2004(1) 7 1 3 5 1 0 2 2 4 5 2 3 0 0 4 2004(2) 23 1 5 13 1 2 7 5 11 7 3 4 2 3 5 2005(1) 18 1 4 15 3 2 9 4 9 10 1 13 3 3 5
A: Num. of accidents due to human factor B: Low conscious state
C: Watch-interruption D: Careless inspection E: Inaccurate location F: Errors of communication G: Errors of memory H: Errors of diagnosis I: Not observe the regulation J: Not observe well process K: Not brake
L: Not take action in time M: Not drive at a safe speed
In the table 1, the result is human factors accidents, and the remaining 14 people are likely to the reason human factors accident.
B. Calculate correlation degrees
According to Table 1, correlation coefficient matrix of random variable is obtained by formula (1).
Tab. 2: Correlation coefficient matrix of all variables
A B C D E F G H I J K L M N O
A 1.00 0.44 0.94 0.81 0.49 0.90 0.91 0.59 0.92 0.91 0.66 0.51 0.43 0.94 0.75 B 0.44 1.00 0.48 0.50 0.41 0.23 0.52 0.40 0.47 0.55 0.74 0.46 0.37 0.46 0.55 C 0.94 0.48 1.00 0.67 0.45 0.92 0.82 0.43 0.85 0.92 0.72 0.38 0.19 0.96 0.66 D 0.81 0.50 0.67 1.00 0.44 0.60 0.92 0.90 0.86 0.83 0.46 0.84 0.82 0.71 0.89 E 0.49 0.41 0.45 0.44 1.00 0.36 0.51 0.16 0.34 0.55 0.15 0.58 0.39 0.42 0.40 F 0.90 0.23 0.92 0.60 0.36 1.00 0.76 0.32 0.74 0.86 0.48 0.32 0.14 0.97 0.45 G 0.91 0.52 0.82 0.92 0.51 0.76 1.00 0.72 0.95 0.87 0.59 0.77 0.70 0.85 0.86 H 0.59 0.40 0.43 0.90 0.16 0.32 0.72 1.00 0.75 0.59 0.43 0.69 0.81 0.45 0.85 I 0.92 0.47 0.85 0.86 0.34 0.74 0.95 0.75 1.00 0.81 0.73 0.58 0.59 0.84 0.89 J 0.91 0.55 0.92 0.83 0.55 0.86 0.87 0.59 0.81 1.00 0.55 0.64 0.41 0.93 0.72 K 0.66 0.74 0.72 0.46 0.15 0.48 0.59 0.43 0.73 0.55 1.00 0.13 0.17 0.63 0.63 L 0.51 0.46 0.38 0.84 0.58 0.32 0.77 0.69 0.58 0.64 0.13 1.00 0.87 0.44 0.73 M 0.43 0.37 0.19 0.82 0.39 0.14 0.70 0.81 0.59 0.41 0.17 0.87 1.00 0.27 0.72 N 0.94 0.46 0.96 0.71 0.42 0.97 0.85 0.45 0.84 0.93 0.63 0.44 0.27 1.00 0.59 O 0.75 0.55 0.66 0.89 0.40 0.45 0.86 0.85 0.89 0.72 0.63 0.73 0.72 0.59 1.00
Above table shows that manipulation is not sending the right signals and intermittent lookout, failing to comply with the rules of these three individuals are highly related to correlation of human error accidents.
Calculate the similarity between the nodes (calculate similarity of the rest of the G after delete the specified connected edge.) using equation (2). Follows are calculation result.
Tab. 3: Similarity degrees of each two nodes
A
B
C
D
E
F
G
H
I
J
K
L
M
N
O
A
0.00
8.95
9.85
10.41
8.43
9.21
10.56
9.55
10.34
10.26
8.97
9.55
9.10
9.89
10.20
B
8.95
0.00
8.50
8.92
6.70
8.07
9.15
7.94
8.98
8.81
7.09
7.80
7.35
8.56
8.58
C
9.85
8.50
0.00
10.15
8.06
8.78
10.25
9.31
10.01
9.84
8.51
9.28
8.94
9.47
9.87
D
10.41
8.92
10.15
0.00
8.50
9.54
10.58
9.27
10.42
10.36
9.20
9.24
8.74
10.15
10.08
E
8.43
6.70
8.06
8.50
0.00
7.48
8.69
7.71
8.64
8.34
7.20
7.21
6.86
8.14
8.27
F
9.21
8.07
8.78
9.54
7.48
0.00
9.63
8.74
9.43
9.22
8.07
8.66
8.31
8.78
9.41
G
10.56
9.15
10.25
10.58
8.69
9.63
0.00
9.71
10.59
10.58
9.32
9.57
9.11
10.26
10.36
H
9.55
7.94
9.31
9.27
7.71
8.74
9.71
0.00
9.46
9.53
8.15
8.32
7.67
9.34
9.04
I
10.34
8.98
10.01
10.42
8.64
9.43
10.59
9.46
0.00
10.42
8.97
9.54
9.01
10.06
10.12
J
10.26
8.81
9.84
10.36
8.34
9.22
10.58
9.53
10.42
0.00
9.06
9.39
9.10
9.87
10.19
K
8.97
7.09
8.51
9.20
7.20
8.07
9.32
8.15
8.97
9.06
0.00
8.37
7.79
8.64
8.74
L
9.55
7.80
9.28
9.24
7.21
8.66
9.57
8.32
9.54
9.39
8.37
0.00
7.53
9.25
9.08
M
9.10
7.35
8.94
8.74
6.86
8.31
9.11
7.67
9.01
9.10
7.79
7.53
0.00
8.89
8.56
N
9.89
8.56
9.47
10.15
8.14
8.78
10.26
9.34
10.06
9.87
8.64
9.25
8.89
0.00
9.99
O
10.20
8.58
9.87
10.08
8.27
9.41
10.36
9.04
10.12
10.19
8.74
9.08
8.56
9.99
0.00
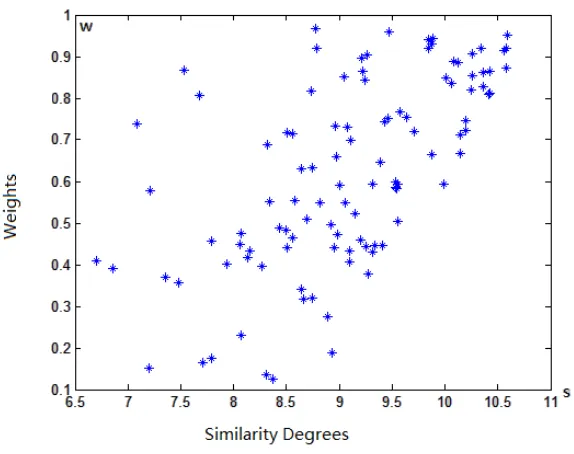
Fig. 1: Similarity degrees of each two nodes and the weights of their corresponding edges
From Figure (1), there is a positive relationship between similarity and even edge weights. However, this positive correlation is not very obvious. Similarity in some nodes is not high, but even edge weights is great. It indicates that there is a higher correlation coefficient of variables between these nodes, and this high correlation coefficient cannot be explained by other factors. In other words, there is higher that the correlation really belongs to themselves between those two nodes.
Again, calculate correlation between any two nodes (i, j) to obtain the following results, according to equation (3) c:
Tab. 4: Degrees of associations of each two nodes
A B C D E F G H I J K L M N O
A 0.00 0.34 0.66 0.53 0.40 0.67 0.59 0.43 0.61 0.61 0.50 0.36 0.33 0.65 0.50
B 0.34 0.00 0.39 0.38 0.42 0.20 0.39 0.35 0.36 0.43 0.71 0.40 0.34 0.37 0.44
C 0.66 0.39 0.00 0.45 0.38 0.72 0.55 0.32 0.58 0.64 0.58 0.28 0.14 0.70 0.46
D 0.53 0.38 0.45 0.00 0.36 0.43 0.60 0.67 0.57 0.55 0.34 0.63 0.64 0.48 0.60
E 0.40 0.42 0.38 0.36 0.00 0.33 0.40 0.15 0.27 0.45 0.14 0.55 0.39 0.35 0.33
F 0.67 0.20 0.72 0.43 0.33 0.00 0.54 0.25 0.54 0.64 0.40 0.25 0.11 0.75 0.33
G 0.59 0.39 0.55 0.60 0.40 0.54 0.00 0.51 0.62 0.57 0.44 0.55 0.53 0.57 0.57
H 0.43 0.35 0.32 0.67 0.15 0.25 0.51 0.00 0.54 0.42 0.37 0.57 0.72 0.33 0.65
I 0.61 0.36 0.58 0.57 0.27 0.54 0.62 0.54 0.00 0.53 0.56 0.42 0.45 0.57 0.60
J 0.61 0.43 0.64 0.55 0.45 0.64 0.57 0.42 0.53 0.00 0.42 0.47 0.31 0.65 0.49
K 0.50 0.71 0.58 0.34 0.14 0.40 0.44 0.37 0.56 0.42 0.00 0.10 0.15 0.50 0.50
L 0.36 0.40 0.28 0.63 0.55 0.25 0.55 0.57 0.42 0.47 0.10 0.00 0.79 0.33 0.55
M 0.33 0.34 0.14 0.64 0.39 0.11 0.53 0.72 0.45 0.31 0.15 0.79 0.00 0.21 0.57
N 0.65 0.37 0.70 0.48 0.35 0.75 0.57 0.33 0.57 0.65 0.50 0.33 0.21 0.00 0.41
O 0.50 0.44 0.46 0.60 0.33 0.33 0.57 0.65 0.60 0.49 0.50 0.55 0.57 0.41 0.00
C. Obtain the most important factors
Table (3) already reflects the main direct reason of human factors accidents, and also reflects the mutual relationship between reasons. But it is impossible to directly conclude the most important reason of human factors accidents. Because some factors have relatively low relationship with human factors accidents, but due to influence of other factors, it could become a very important indirect cause. Such indirect causes may be even more important than the direct cause, which is easily overlooked.
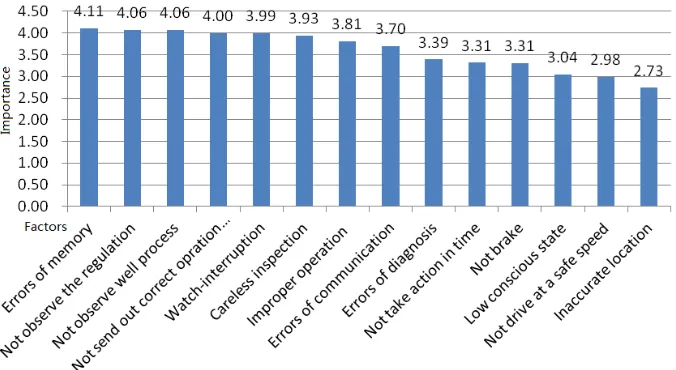
[image:6.595.136.474.224.409.2]In this case, degree of importance of each factor is calculated by the formula (4), so that you can find most possible factors leading to the accident, there may even some factors which are difficult to detect but very important indirect causes are found. Following results are found after calculating the importance of each factor and ranking according to the degree of importance.
Fig. 2: Importance degrees of all factors and their ranks
Figure 2 shows three of the most important causes of human factors accidents which have memory lapses, failure to comply with the rules, and failure to comply with good workmanship. These three factors have low direct relationship with human factors accidents. So these three factors are human factors accidents potential danger which is important but easily overlooked.
D. Analysis
Through multiple correlation analysis model based on the relationship established link above forecast, the results show that the proposed method in the human factors accidents analysis may solve related factors analysis due to an accident in the rail transport of human analysis applications. In particular, it is associated with multiple factors analysis, and based on these conclusions. Following three conclusions can be drawn:
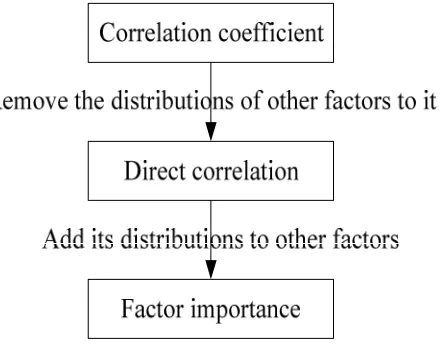
(1) The relationship between the correlation coefficient, and the factors are directly related to the degree of importance
Fig. 3: Relations among correlation coefficient, direct correlation and factor importance
Thus, two factors between multiple correlations are mainly considered by the degree of importance: the contribution of other factors and factors that drive the correlation coefficient (i.e. indirectly related to the accident) to other factors. Factors important factor in the higher degree of indicators can lead to more accidents.
(2) The results from the correlation coefficient, and the factors directly related to the degree of importance of comparison.
Tab. 5: Three factors with the maximum corresponding indicator
Indicator Factors
Correlation coefficient Not sending the right signals and intermittent lookout, failing to comply with the rules Direct correlation Communication exchanges mistakes, intermittent lookout, did not send the right signals
Factor importance Have memory lapses, failure to comply with the rules, and failure to comply with good workmanship
From Table 5, the ranking results from the three indicators are different. This indicates that the data set multiple correlations between random variables issues are effectively addressed.
(3) Human factors most likely lead to an accident
In figure 2, these three factors of memory lapses, failure to comply with the rules, and failure to comply with good workmanship are most likely to lead human factors accident. But because these three factors directly related to the degree of human calculation results are not the greatest, this indicates these three factors are all driven by other problems, and indirectly lead to human factor accidents, which are usually easily overlooked. Therefore, analyzing the factors importance index can effectively find important human factors accident potential danger.
CONCLUSION
Human factor error analysis is an important part of human factors reliability, playing a significant role in the man-machine systems reliability assessment and human factors prevention of accidents. Among methods of analysis, there exists a problem on multiple correlations between the factors. By introducing link prediction technology, in this paper a solution to the problem of multiple correlations between the degree of correlation and factor importance indicator systems are established. Moreover, the paper verifies the positive role of new index system of the discovery of potential accidents by calculating correlation predicted with link and algorithmic factors importance and the train accident analysis instance.
However, there still exists a space for improvement on algorithms in the selection of threshold parameter and attenuation factor or calculation. The next step will be the follow-up study of the following aspects:
1) CN index is just one of the right computing node similarities in many indicators to study the effects of different node similarity index of the model.
2) Further study formula (4) of the method of attenuation factor.
Acknowledgments
This work was supported by Science and Technology Key Research of Beijing Educational Commission (No. KZ201210038038) and State Administration of Work Safety Technology Project.
REFERENCES
[1] Chen Dongnuan. Research on Human Error and Reliability of Railway System. Thesis for master’s degree, Northeast University,2009.
[2] Lv Linyuan,Zhou Tao. Link Prediction. Higher Education Press,2013.
[3] Alenka H,Vojan R. Reliability Engineering and System Safety, 1996.
[4] Faheem Ahmed. Journal of Software. 2012,2.Vol 7.pp:389-397.
[5] Roman V. Yampolskiy, Venu Govindaraju. Journal of Computers. 2007, 10.Vol 2.pp:76-88. [6] Jialin Liu, Bengang Gong. Journal of Computers. 2011, 4.Vol 6.pp:711-717.
[7] Christophe Simon, Philippe Weber, Eric Levrat. Journal of Computers. 2007, 1.Vol 2.pp:33-43.
[8] P.C. Cacciabue. Human error risk management methodology for safety audit of a large railway organization.
Applied Ergonomics, 2005.
[9] W. Ian Hamilton, Theresa Clarke. Driver performance modeling and its practical application to railway safety.
Applied Ergonomics, 2005.