International Journal of Emerging Technology and Advanced Engineering
Website: www.ijetae.com (ISSN 2250-2459,ISO 9001:2008 Certified Journal, Volume 3, Issue 3, March 2013)
562
Using Software Requirement Specification as Complexity Metric
for Multi-Paradigm Programming Languages
Olabiyisi S.O.
1,
Adetunji A.B
2, Olusi T.R
3 1,2Department of Computer Science and Engineering, Faculty of Engineering and Technology, Ladoke Akintola University of Technology, Ogbomoso, Oyo State, Nigeria.
3Department of Computer Science, Institute of Basic and Applied Sciences, Kwara State Polytechnic, Ilorin, Nigeria.
Abstract--The existing complexity metrics being used are
based on code and cognitive metrics. This study therefore proposed a complexity metric using Software Requirement Based Specification. The proposed approach identified complexity of software immediately after freezing the requirement in Software Development Life Cycle (SDLC) process. In order to develop a metric, this research took the IEEE Software Requirement Specification (SRS) document as a basis. Proper analysis of each and every component of SRS document of complexity metrics was considered. Functional and Non- functional requirements were also employed to develop an improved complexity metric. In order to validate the proposed metric, it was then applied on ten (10) different sorting algorithms written in C++ language and further compared with other established code based metrics. The metric compares well with other established complexity metrics and can be used to estimate complexity of proposed software much before the actual implementation of design thus saving cost, time and manpower wastage.
Keywords-- Design Constraints Imposed Functional Requirement, Input and Output Complexity, Interface Complexity, Non Functional Requirement, Requirement Base Complexity, System Feature Complexity, User / Location Complexity.
I. INTRODUCTION
A wide range of activity is associated with different phases of software development. Software metrics are techniques/formulas to measure some specific property or characteristics of software. In software engineering, the term 'software metrics' is directly related to the measurement. Software measurement has significant role in the software management. According to DeMarco (1986) "You can't manage what you can't measure!" Campbell also emphasized the importance of measurement by stating that “If you aren‟t measuring „you aren‟t managing you‟re only along for the ride (downhill)!”. At this point it is worth to define 'measurement' itself. Norman Fenton (1992) defines measurement as the process by which numbers or symbols are assigned to attributes of entities in the real world in such a way as to describe them according to clearly defined rules.
Software metrics are quantitative guide to the performance of a certain piece of software in relation to the human interaction needed to make the software work. Metrics have been established under the idea that before something can be measured or quantified, it needs to be translated into numbers for easy understanding, coding and evaluating the quality of the program. There are several areas where software metrics are found to be of use. These areas include everything from software planning to the steps that are meant to improve the performance of certain software. Software cannot perform
on its own without human interaction. Therefore, in a way,
International Journal of Emerging Technology and Advanced Engineering
Website: www.ijetae.com (ISSN 2250-2459,ISO 9001:2008 Certified Journal, Volume 3, Issue 3, March 2013)
563
McCabe et al. (1976) defined software complexity as "one branch of software metrics that is focused on direct measurement of software attributes, as opposed to indirect software measures such as project milestone status and reported system failures."
Basili (1980) defined complexity as a measure of resources used by a software system during the interaction of the parts of the software, to perform a task. If the interacting entity is a computer, then complexity is related to the execution time and hardware resources required to perform the task. If the interacting entity is a programmer, then complexity is related to the difficulty of coding, testing and modifying the software. It is believed that for coding and modifying a software system, a higher comprehensibility of the code is required. If the comprehensibility is higher, then the complexity of the software is lower, and thus testing is easier. Somerville (2004) categorizes metrics as control and predictor metrics. The various popular metrics complexity measures are under several criticisms. These criticisms are mainly based on lacking in desirable measurement properties, being too labour- intensive to collect and only confined to the features of procedural languages most of the available metrics cover only certain features of a language. For example, if line of code is applied then only size will be considered. If McCabe complexity is applied the control flow of the program will be covered.
Moreover, most of the available metrics do not consider the cognitive characteristics in calculating the complexity of a code, which directly affects the cognitive complexity. If a code has a low cognitive complexity, programmer can easily grasp the code without wasting too much time. High cognitive complexity indicates poor design which sometimes can be unchangeable. Hence, there is a need to propose a new complexity measure that is able to estimate software complexity in early phases of software life cycle, even before analysis and design is carried out. This research work is to develop a Software Requirement Specification (SRS) based complexity metric for multi paradigm programming languages.
II. REVIEW OF RELATED WORK
Many well known software complexity measures have been proposed such as McCabe cyclomatic complexity, Line Of Code and Halstead complexity metric. All the reported complexity measures are supposed to cover the correctness, effectiveness and clarity of software and to provide good estimate of these parameters. Out of the proposed measures, selecting a particular complexity measure is again a problem as every measure has its own advantages and disadvantages.
In this research work the proposed complexity metric was developed using requirement based complexity measure and its performance is compared with the existing metrics such as line of code, Halstead complexity measure and Cyclomatic complexity.
Cyclomatic Complexity
Cyclomatic Complexity formula is given below:
m =e-n +2 p (1)
Where,
m is the cyclomatic complexity e is the number of edges
n is the number of vertices p is the connected components
Halstead Complexity Measure
Maurice Halstead proposed this measure which is based on the principle of Count of Operators and Operand and their respective occurrences in the code. These operators and operands are to be considered for the formation of Length and Vocabulary of Program. Further Program Length and Vocabulary serve as basis for finding out Volume, Potential Volume, Estimated Program length, Difficulty and finally effort and time by using following formulae.
Program Vocabulary, n = n1+n2 Program Length, N = N1+ N2 Volume, V= N*log2n
Estimated Program Length N^ = n1 log2 n1 + n2 log2 n2
Potential Volume, V*
=(2+n2*)log2(2+n2*) Program Level, L = V*/V
Effort, E =V/L in elementary mental discriminations
Reasonable Time, T = E/B min Difficulty = 1/language level
Lines of Code
This metric considers the number of lines of code inside a program. It has some types (Resource Standard Metric, 2010):
- Lines of Code (LOC): counts every line including
comments and blank lines.
- Kilo Lines of Code (KLOC): it is LOC divided by
1000.
- Effective Lines of Code (eLOC): estimates effective
line of code excluding parenthesis, blanks and comments.
- Logical Lines of Code (LLOC): estimates only the
International Journal of Emerging Technology and Advanced Engineering
Website: www.ijetae.com (ISSN 2250-2459,ISO 9001:2008 Certified Journal, Volume 3, Issue 3, March 2013)
564
III. MATERIAL AND METHODS
This metric is based on the factors derived from software requirement specification (SRS) document. The calculations for this metric base on different parameters are specified below.
A.Complexity Attribute 1:
Input-Output Complexity (IOC)
This complexity refers to the input and output of the software system and attached interfaces and files. Following four attributes are considered:
Input: As Information entering to the System Output: Information Leaving System
Interface: User Interface where the Input are to be issued and output to be seen and specifically number of integration required
Files: This refers to the data storage required during transformation
Input Output Complexity can be defined as:
IOC = Number of Input variable + Number of Output + Number of Interfaces + Number of files (1)
B. Complexity Attribute 2:
Functional Requirement (FR)
Functional Requirement defines the fundamental actions that must take place in the software in accepting and processing the inputs and in processing and generating outputs. Functionality refers to what system is supposed to do. This describes the general factor that affects the product and its functionality. Every stated requirement should be externally perceivable by users, operators or other external systems.
It may be appropriate to partition the functional requirement into sub-functions or sub-processes
FR = No. of Functions * (2)
Where SPF is Sub-Process or Sub-Functions received after decomposition.
C.Complexity Attribute 3:
Non Functional Requirement (NFR)
This refers to the Quality related requirements for the software apart from functionality. These requirements are categorized into THREE categories with their associated precedence values as shown in Table 1. As high the precedence that much high will be the value, which will further depend upon the count. It can be mathematically described as:
NFR = (3)
Table I
Describes the different types of Non Functional Requirement
Type Count
Optional Req 1
Must be Type 2
Very important Type 3
D.Complexity Attribute 4:
Requirement Complexity (RC)
It refers to the sum of all requirements i.e. Functional Requirement (FR) and its decomposition into sub-functions and Non Functional Requirements:
RC = FR * NFR (4)
E.Complexity Attribute 5:
Product Complexity (PC)
This refers to the overall complexity based on its functionality of the system. We have proposed this a product of Requirement Complexity (RC) and Input Output Complexity (IOC). It can be mathematically described as:
PC = IOC * RC (5)
F. Complexity Attribute 6:
Personal Complexity Attributes (PCA)
For effective development of software, Technical Expertise plays a very significant role. Now computation of the Personal Attributes lead to technical expertise, and this is referred to as the “Multiplier Values for Effort Calculation i.e. Cost Driver Attributes of Personal Category from COCOMO Intermediate model proposed by Berry Boehm and they are shown as follows
Table II
Cost Driver Attributes and their values used in COCOMO Model
Attribute Rating
Very low
Low Normal High Very high Analysis Capability 1.46 1.19 1.00 0.86 0.71 Application Expertise 1.29 1.13 1.00 0.91 0.82 Programming
Capability
1.42 1.17 1.00 0.90 -
Virtual Machine Expertise
1.21 1.10 1.0 0.90 -
Programming language Expertise
1.14 1.07 1.00 0.95 -
Mathematically PCA can be described as Sum of Product of attributes as shown in the table above.
PCA= (6)
International Journal of Emerging Technology and Advanced Engineering
Website: www.ijetae.com (ISSN 2250-2459,ISO 9001:2008 Certified Journal, Volume 3, Issue 3, March 2013)
565
G. Complexity Attribute 7:Design Constraints Imposed (DCI)
It refers to no. of constraints that are to be considered during development of software/ system by any statuary body/ agencies which includes number of regulatory
constraints, hardware constraints, communication
constraints, database constraints etc. This metrics can be mathematically defined as.
DCI = (7)
Where Ci is Number of Constraints and value of Ci will vary from 0 to n.
Ci = {0 if Blind Development {value if Constraint exists
H. Complexity Attribute 8:
Interface Complexity (IC)
This complexity attribute is used to define number of External Integration/Interfaces to the proposed module/ program/ system. These interfaces can be hardware interface, communication interface and software interface etc.
IFC = (8)
Where EIi is Number of External Interfaces and value of EIi will vary from 0 to n
IFC= {0 if no external interface {value if Constraint exists
I. Complexity Attribute 9:
Users/ Location Complexity (ULC)
This measure refers to the number of user for accessing the system and locations (Single or Multiple) on which the system is to be deployed/ used
ULC= No. of User * No. of Location (9)
J. Complexity Attribute 10:
System Feature Complexity (SFC)
This refers to the specific features to be added to the system so as to enhance the look and feel feature of the system
SFC = (Feature1 * Feature2 * …………. * Feature n) (10)
Complexity Definition:
Requirement Based Complexity
Finally the Requirement Based Complexity (RBC) can be obtained by considering all above definitions. It can be mathematically shown as:
RBC = ((PC * PCA) + DCI + IFC + SFC) * ULC (11)
The Requirement Based Complexity will be higher for the programs, which have higher Functionality to be performed and more quality attributes which is to be retained. All above measure were illustrated with the programs that were developed.
IV. IMPLEMENTATION AND RESULTS
For illustration of Requirement Based complexity (RBC), 10 different programs were selected and developed. These programs are different from each other in their architecture, the calculation of RBC for sample of the program is given in figure as specified below:
void bubbleSort(int numbers[], int array_size)
{
int i, j, temp;
for (i = (array_size - 1); i >= 0; i--)
{
for (j = 1; j <= i; j++)
{
if (numbers[j-1] > numbers[j])
{
temp = numbers[j-1];
numbers[j-1] = numbers[j];
numbers[j] = temp;
}
}
}
}
International Journal of Emerging Technology and Advanced Engineering
Website: www.ijetae.com (ISSN 2250-2459,ISO 9001:2008 Certified Journal, Volume 3, Issue 3, March 2013)
566
Analysis Of Bubble Sort Program1. Input Output Complexity (IOC) Number of Input = 00 Number of Output = 00 Number of Interface = 01 Number of files = 01
IOC = Number of input + number of output + Number of Interface + Number of Files = 0+0+1+1=2
2. Function Requirement (FR)
Number of functional Req = 01 (Bubble Sort) Number of Sub- Processes = 02 (Increment, Decrement)
FR = Number of FR *Number of SP FR= 01*02 = 02
3. Non Functional Requirement (NFR) Number of NFR = 00
4. Requirement Complexity (RC) RC= FR + NFR RC= 02 + 00=02
5. Product Complexity (PC) PC = IOC * RC PC = 02 * 02 =04
6. Personal Complexity Attribute (PCA) PCA = MF3 PCA = 1.17
7. Design Constraints Imposed (DCI) Num of constraints =00
8. Interface Complexity (IFC) IFC = 00
9. User/Location Complexity (ULC)
ULC = Num of user * Num of location ULC = 01* 01 =01
10. System Feature Complexity (SFC) SFC = 0
RBC = ((PC * PCA) + DCI +IFC + SFC) * ULC
[image:5.612.354.534.155.373.2](4 * 1.17) *1 = 4.68
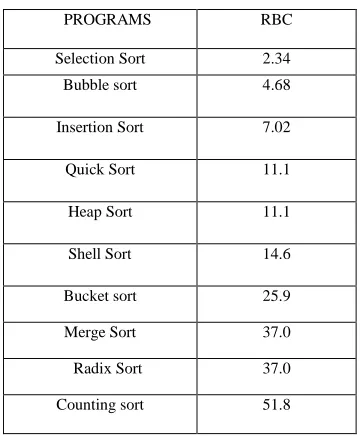
TABLE III
Requirement Based Complexity (RBC)
PROGRAMS RBC
Selection Sort 2.34
Bubble sort 4.68
Insertion Sort 7.02
Quick Sort 11.1
Heap Sort 11.1
Shell Sort 14.6
Bucket sort 25.9
Merge Sort 37.0
Radix Sort 37.0
Counting sort 51.8
This section of the research work analyses the result of applying RBC on 10 programs selected and developed on a C++ language so as to find the complexity variation in terms of code. In order to analyze the validity of the result, the RBC for different program was calculate based on software Requirement specification (SRS) and further compared with other established measures which are summarized in above Table.
Table 3 contains the statistics that are collected after analyzing the C++ codes to evaluate the RBC measures.
The empirical validation is in two folds. First the code based complexity measures such as effective Line Of Code (eLOC), Cyclomatic Complexity (CC) and Volume, Effort Difficulty and Time estimations from Maurice Halstead metrics are all applied. Secondly, the statistics that are collected from these metrics is compared with the values obtained from RBC to investigate the usefulness and effectiveness of the proposal.
V. ANALYSIS OF RESULT
International Journal of Emerging Technology and Advanced Engineering
Website: www.ijetae.com (ISSN 2250-2459,ISO 9001:2008 Certified Journal, Volume 3, Issue 3, March 2013)
567
0 10 20 30 40 50 60Sel ectio
n S ort
Bub ble
Sor t
Inse rtio
n S ort
Qui ck S
ort He
ap S ort
She ll S
ort
Buc ket S
ort Mer
ge Sor
t
Ra dix
Sor t
Co untin
g S ort
RBC
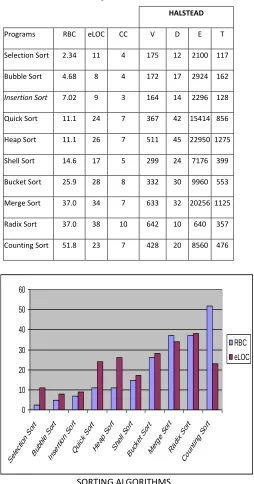
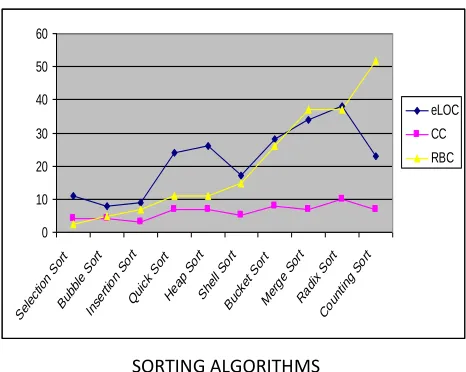
eLOC In eLOC of 38 CC of 10 and volume of 642 in Radix
sort program is observed to be more difficult to grasp than others. Effort with value 22950 and Time with value 1275 shows that Heap Sort program is the most complex. Selection sort program with RBC of 2.34 has a less Requirement Based complexity than the bubble sort program of 4.68 due to its readability. The bubble sort program required more though process, although selection sort program has more line of code. Similarly, CC and Maurice Halstead metric are able to show this too. Shell sort program is more than insertion sort program. It shows that it is more difficult to grasp than insertion sort program, however eLOC CC and Halstead result could not measure the differences.
Heap sort program and Quick sort program have the same RBC value of 11.1 this is also shows in CC but there is slight difference in eLOC. Also, Merge sort program and Radix sort program also have the same RBC of 37.0 but have differences in eLOC Maurice Halsted and CC measure. Radix sort program and in Merge sort program are more complex than Bucket sort program has shown in RBC measure. There is a slight difference CC of merge sort program and Bucket sort program. But in eLOC and Halstead there is a significant difference between Bucket sort program and Radix sort program. In comparison with other measure RBC is closer to human understanding.
[image:6.612.320.574.153.637.2]From the above shown result, RBC performs better than other measures in reflecting the comparative complexities, which means RBC will aid the developer and practitioner in evaluating the software complexity in the early phases of software development.
Table IV Comparison of metrics
HALSTEAD
Programs RBC eLOC CC V D E T
Selection Sort 2.34 11 4 175 12 2100 117
Bubble Sort 4.68 8 4 172 17 2924 162
Insertion Sort 7.02 9 3 164 14 2296 128
Quick Sort 11.1 24 7 367 42 15414 856
Heap Sort 11.1 26 7 511 45 22950 1275
Shell Sort 14.6 17 5 299 24 7176 399
Bucket Sort 25.9 28 8 332 30 9960 553
Merge Sort 37.0 34 7 633 32 20256 1125
Radix Sort 37.0 38 10 642 10 640 357
Counting Sort 51.8 23 7 428 20 8560 476
SORTING ALGORITHMS
International Journal of Emerging Technology and Advanced Engineering
Website: www.ijetae.com (ISSN 2250-2459,ISO 9001:2008 Certified Journal, Volume 3, Issue 3, March 2013)
568
0 100 200 300 400 500 600 700 Sel ection S ort Bub ble Sor t Inse rtio
n S ort
Qui ck S
ort
He ap S
ort
She ll S
ort
Buc ket S
ort Mer ge Sor t Ra dix Sor t Co untin
g S ort eLOC RBC V 0 10 20 30 40 50 60 Sel ectio
n S ort Bub ble Sor t Inse rtio
n S ort
Qui ck S
ort
He ap S
ort
She ll S
ort
Buc ket S
ort Mer ge Sor t Ra dix Sor t Co untin
g S ort eLOC CC RBC 0 10 20 30 40 50 60 Sel ectio
n S ort Bub ble Sor t Inse rtio
n S ort
Qui ck S
ort
He ap S
ort
She ll S
ort
Buc ket S
ort Mer ge Sor t Ra dix Sor t Co untin
g S ort
RBC
CC
[image:7.612.333.559.135.316.2]SORTING ALGORITHMS
Figure IIIComparison between CC and RBC
[image:7.612.53.289.136.311.2]SORTING ALGORITHMS
Figure IV Relative Graph between eLOC, CC and RBC
[image:7.612.55.288.354.540.2]
SORTING ALGORITHMS
Figure V Relative Graph between eLOC, RBC and Volume
0 10 20 30 40 50 60 Sel ectio
n S ort Bub ble Sor t Inse rtio
n S ort
Qui ck S
ort
He ap S
ort
She ll S
ort
Buc ket S
ort Mer ge Sor t Ra dix Sor t Co untin
g S ort
CC RBC D
SORTING ALGORITHMS
Figure VI Relative Graph Between CC, RBC and Difficulty
VI. 5. CONCLUSION
[image:7.612.325.564.356.514.2]International Journal of Emerging Technology and Advanced Engineering
Website: www.ijetae.com (ISSN 2250-2459,ISO 9001:2008 Certified Journal, Volume 3, Issue 3, March 2013)
569
It is a robust metric because it encompasses all major parameters and attributes that are required to fund out complexity. Further they are comparable with code based complexity measures. On comparing the requirement based complexity measure with rest of the established measure following are the findings:
i. RBC follows code based measures which have been
computed on the basis of program by identifying number of operators and operands and further vocabulary, Length and finally it is aligned with the difficulty metrics given Maurice Halstead.
ii.RBC is more sensitive than other measures which will
aid the program developer and practitioner in evaluating the software complexity in early phases of software planning.
iii. CC was not able to make sensitive measurement
most of the similar code had the same CC values. RBC was able to handle sensitive measurement.
REFERENCES
[1 ] Ashish Sharma, D.S. Kushwaha 2010 A Complexity measure base on requirement engineering document. Journal of Computer Science and Engineering, vol.1.
[2 ] Banker, R.D., Datar, S.M., Zweig, D 1989 Software Complexity and Maintainability CiteSeer Scientific Literature Digital Library and Search Engine.
[3 ] Basci, D., Misra, S 2009 „Data Complexity Metrics for Web-Services‟ Advances in Electrical and Computer Engineering, Volume 9, Number 2, 2009, pp.9-15. Basci, D., Misra, S. Measuring and Evaluating a Design Complexity Metric for XML Schema Documents‟ Code. Journal of Information Science and Engineering. pp.1415-1425.
[4 ] DeMarco, T. 1986 Controlling Software Projects, Yourdon Press, New York.
[5 ] Fenton N. E. , Pfleeger, S. L. 1997 Software Metrics: A Rigorous and Practical Approach, 2nd Edition Revised ed. Boston: PWS Publishing.
[6 ] Fenton 1992 N.E. Fenton, Software Metrics – A Rigorous Approach, Chapman & Hall, London.
[7 ] Halstead, M.H. 1997 Elements of Software Science. New York: Elsevier North-Holland.
[8 ] Halstead 1977 Halstead, M.H. Elements of Software Science, Elsevier North- Holland, New York.
[9 ] "http://en.wikipedia.org/w/index.php?title=Procedural_programming &oldid=471526365
[10 ]IEEE Computer Society 1998 Standard for Software Quality Metrics Methodology. Revision IEEE Standard 1061.
[11 ]Ierusalimschy, R. 2010 Programming with Multiple Paradigms in Lua Available at: http://www.inf.puc-rio.br/~roberto/docs/ry09-03.pdf
[12 ]Kushwaha, D.S., Misra, A.K. 2006 Improved Cognitive Information Complexity Measure: A Metric that Establishes Program Comprehension Effort, Software Enginering Notes, vol 31, no 5.
[13 ]LangPop „Programming Language Popularity‟ 2010 Available at http://www.langpop.com/
[14 ]Marco, L.: Measuring Software Complexity 2010 Available at: http://cispom.boisestate.edu/cis320emaxson/metrics.htm
[15 ]Martin, S. 1988. A Critique of Cyclomatic Complexity as a Software Metric. IEEE Software Engineering Journal.
[16 ]McCabe, T.J. 1976 A Complexity Measure. IEEE Transactions Software Engineering. 2(6): p.308-320
[17 ]McCabe, T.J., Watson, A.H. 2010 Software Complexity, McCabe and Associates, Inc. (last accessed 17.03.2010) Available at: http://www.stsc.hill.af.mil/crosstalk/1994/12/xt94d12b.asp Metrics 1.3.6 (last accessed 23.02.2010) Available at: http://metrics.sourceforge.net/
[18 ]McCabe 1976 T. McCabe, A complexity measure, IEEE Transactions of Software Engineering, Vol. SE-1, 312-327. [19 ]Misra, S., Akman, I. 2008 A Complexity Metric based on Cognitive
Informatics, Lecture Notes in Computer Science, Vol. 5009, pp.620-627.
[20 ]Misra, S., Akman, I. 2008 A Model for Measuring Cognitive Complexity of Software, Springer-Verlag Berlin Heidelberg pp. 879-886.
[21 ]Misra S., Akman, I. 2010 Unified Complexity Metric: A measure of Complexity, Proc. Of National Academy of Sciences Section A. [22 ]Misra, S., Akman, I. 2008 Weighted Class Complexity: A Measure
of Complexity for Object Oriented Systems, Journal of Information Science and Engineering, Vol.24, pp.1689-1708.
[23 ]Pfleeger, S.L., Atlee, J.M. 2006 Software Engineering – Theory and Practice, 3rd International Edition, Prentice Hall,
[24 ]Pressman Roger S, 2005 Software Engineering -A Practitioner Approach, 4th Edition.
[25 ]Ramamoorthy C.V. Ramamoorthy, W-T. Tsai, T. Yamura 1985 A. Bhide Metrics guided methodology, COMPSAC 85, pp. 111-120. [26 ]Roger S. P. 2005 Software Engineering – A practitioner‟s approach,
6th Edition. McGraw-Hill.
[27 ]Software Quality Assurance (last accessed 16.05.2010) Available at: http://www.sqa.net/iso9126.html
[28 ]Software Technology Support Centre Software Estimation, Measurement, and Metrics (last accessed 16.03.2010) Available at: http://www.stsc.hill.af.mil/resources/tech_docs/gsam3/chap13.pdf [29 ]Sommerville, I. 2004 Software Engineering, 7th Edition, Addison
Wesley.
[30 ]TIOBE Software 2010 The Coding Standards Company. Programming Community Index for (last accessed 18.02.2010).
Available at:
http://www.tiobe.com/index.php/content/paperinfo/tpci/index.html [31 ]Tourlakis, G.J. 1995 Computability, Reston, Virginia.
[32 ]Westbrook, D.S. 1999 A Multi-paradigm Language Approach to Teaching Principles of Programming Languages, 29th ASE/IEEE Frontiers in Education Conference, San Juan.
[33 ]Weyuker, E. 1988 Evaluating Software Complexity Measures. IEEE Transactions on Software Engineering, vol. 14, 1357-1365. W3Schools.