Quantitative Phase Analysis Based on Rietveld Structure
Refinement for Carbonate Rocks
Mehmet Tamer1,2
1Faculty of Education, Zirve University, Gaziantep, Turkey 2Department of Physics, Faculty of Science, Gazi University, Ankara, Turkey
Email: [email protected]
Received April 18, 2013; revised May 23, 2013; accepted June 15, 2013
Copyright © 2013 Mehmet Tamer. This is an open access article distributed under the Creative Commons Attribution License, which permits unrestricted use, distribution, and reproduction in any medium, provided the original work is properly cited.
ABSTRACT
QPA (Quantitative Phase Analysis) of carbonate rocks bearing calcite and dolomite using X-ray diffractometry (XRD) can be performed using the combined Rietveld Structure Refinement (RSR) and semiquantitative Reference Intensity Ratio (RIR) methods, providing an estimation of crystalline phase in a mixture. Different ratios of five samples were prepared by mixing these crystal minerals with high sensitively. The scan speeds, adequate to determine mineral phases in rock samples, were used as 6 degrees per minute with 0.08 steps. The XRD analysis with commercial TOPAS 3.0 program, defined by a new generation of profile and structure analysis software, based on RSR provides Bragg reflec-tion profiles and the dimension of the unit cell of a phase. The weight fracreflec-tions of each phase were found by Le Bail and Pawley methods in RSR using a pseudo-Voigt peak shape model. The samples were also characterized by using X-ray fluorescence (XRF) and atomic absorption spectrometer (AAS). These analyses were conducted to compare these results with those obtained from the RSR. In addition to these, RSR of phases is very important to improve the good-ness of fit (GOF). Therefore, the discussions of refinement of the carbonate mixing were made and a refinement proce-dure was given for these mixing in detail. Taking advantage of the RSR with the addition of an internal standard, the phase fraction of all the crystalline phases as well as the amorphous component, has been accurately determined. RSR technique offers a valid support for the characterization of marble in the light of industrial products.
Keywords: Quantitative Phase Analysis; Rietveld Structure Refinement; Reference Intensity Ratio; Calcite; Dolomite;
TOPAS
1. Introduction
X-ray diffraction (XRD) has long been known as a pow- erful tool for the determination of phase composition [1]. RSR method of based quantitative analysis indicates the capable of yielding accurate results. Most of the advan- tageous properties of RSR which were included are the textural description in positive definite spherical har- monics, the refining of polymers, amorphous phases, molecules and the calculation of parameter errors. The main advantage of RSR for quantitative phase analysis is the excellent stability of refinement, even if minor phases are presented. Several methods have been used to ana- lyze the quantify of phases determined by X-ray diffrac- tion data. For instance, RSR method used widely in X- ray laboratory has been utilized in the quantification of geological and large used industrial samples [2]. The Rietveld method (Rietveld, 1969) is uniquely versatile for quantitative phase analysis (QPA), providing that the
structural models of the phases are known [3,4]. The Rietveld method is able to accurately decouple phases with high degrees of reflection overlap, unlike traditional methods such as the reference intensity ratio (RIR) me- thod [5,6]. Cases with minimal or no peak overlap of the measured reflections. This restricts usage of the RIR method to low numbers of high symmetry phases which yield low reflection densities. The Rietveld method has other advantages over the RIR method, such as the clear illustration of unknown impurities by differences be- tween the observed and calculated patterns (Reid, 2006). In recent years, comprehensive round-robin studies have been undertaken examining the various methodologies employed for QPA, of which Rietveld-based methods are the most widely used [7,8]. An individual unknown or partially unknown crystalline phase can be quantified through PONKS method with RSR [9].
cite and dolomite with RSR and RIR methods. The mix- tures in the different ratio were made ready by mixing these crystal minerals. Results of every two methods were compared with weight values of obtained high sen- sitive balance from XRF and AAS methods.
2. Sample Preparation and Characterization
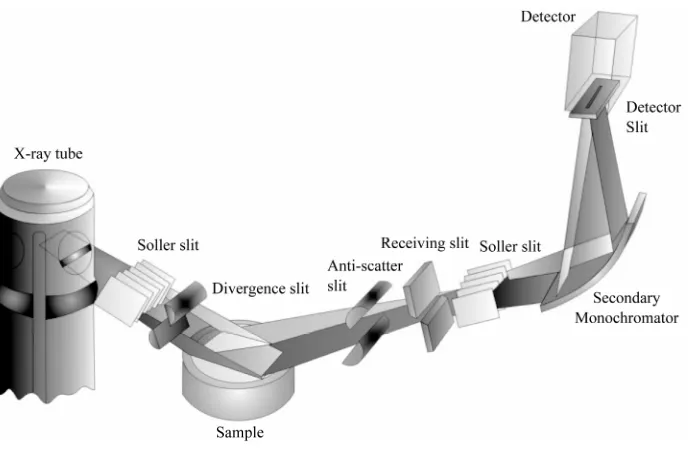
Five carbonate mixing compositions have been examined by using XRD. The carbonate samples were ground, sieved below 80 mesh sieve (opening 177 µm, 0.0070 inches, No.80, US standard sieve series) and put into the PMMA, which is the thermoplastic and transparent plas-tic covering by polymethyl 2-methylpropenoate [10-12]. The length, thickness, position and homogeneity of sam-ples are very important. The X-ray analyses have been carried out by using Bruker-D8 advance XRD calibrated with corundum tablet sample including graphite mono-chromator very sensitively. In particular, mixing ratios of calcite and dolomite which were more or less, were pre-pared by increasing or decreasing in quantities. The 40 KV (voltage) and 40 mA (current) values for diffraction have been selected for a Cu target tube. Samples were scanned over the range of 2˚ - 70˚ 2θ with CuKα radia-tion, NaI scintillation detector and a diffracted beam graphite monochromator crystal. For the whole rocks analysis, the setting of 2 mm (1˚) divergence, antiscatter slits, 0.5 mm receiving slit and incident-beam soller slit were necessary with a step size of 0.08˚ and a time of 6˚ per minute.
For quantitative analysis, TOPAS (Total Pattern Ana- lysis Solution) PROGRAM was used based on Rietveld analysis defines a new generation of profile and structure analysis software by integrating employed profile fitting techniques as well as related applications: Single Line Fitting, Indexing (LSI and LP-Search methods), whole powder pattern decomposition (Pawley and Le Bail me- thods), Abinitio structure determination in direct space from powder and single crystal data, RSR and quantita-tive Rietveld analysis. This study is concerned with Ri- etveld structure refinement and quantitative Rietveld analysis with Le Bail and Pawley method [13].
Both calcite and dolomite crystallizing in the trigonal- rhombohedral system are the carbonate minerals, unless the calcite is the most stable polymorph of calcium car- bonate (CaCO3). Both have the same physical properties,
but dolomite does not rapidly dissolve in dilute hydro- chloric acid. Calcite exhibits an unusual characteristic called retrograde solubility in which it becomes less soluble in water as the temperature increases. Calcite is white or none in color. On the other hand; dolomite forms white, gray, green, brown to pink in colors, com- monly curved crystals. Calcite occurs in sedimentary, volcanic and metamorphic rocks. Dolomite which was formed at temperatures of greater than 100˚C, is the
source of magnesium oxide [14,15]. Pure crystal calcite and dolomite minerals were collected from Çanakkale Karabiga region and Yildiz mounts in Trakya of Turkey, respectively.
3. Results and Discussions
Quantitative analysis with RSR must be started by a few parameters because of providing a very important ad- vantage for developing in fitting. Therefore, RSR proce- dures and their results will be given in step by step for precision of fitting through paper. Five samples prepared with mixing calcite and dolomite crystal minerals are given in the ratios of 0.9; l99.1, 30; 70, 62; 38, 97.5; 2.5 and 99.1; 0.9 respectively, and they are labeled with #1, #2, #3, #4 and #5, respectively. Data were collected on a Bruker D8 advance diffractometer. The diffraction pro- files are shown in order in Figure 1. Increasing or de-
creasing weighted amounts (wt%) of dolomite or calcite can be observed from this figure. Also peaks in the dif- fraction profiles have the preferred orientations in the direction of (104) with higher intensity and sharp peak. These preferred peaks with perfect crystal plane create- serious problem for RIR method because they are not proportional with accurate weighted amount of dolomite or calcite.
Owing to the background appeared in X-ray measure- ment data, we use a Chebychev polynomial of 4th order and with or without the 1/X B kg function used for Le Bail method. The latter accounts for increasing back- ground due to air scattering when coming close to the primary beam, and also allows using a Chebychev poly- nomial with fewer coefficients [16].
Instrument part composed of three parts, goniometer radii, equatorial convolutions and axial convolution, re- spectively. In the first part, the primary and secondary radiuses of the goniometer are determined. In the second and third parts, the primary and secondary solar slits eliminating unphysical broadening in peaks and slit sys- tems are basically used. All of these instrument proper- ties were fixed to instrument parameters of Bragg-Bren- tano Geometry (primary and secondary goniometer Ra- dius are 250 mm, Detector slit is 0.1 mm, Fixed Diver- gence and Anti-scatter slits are 0.5 mm, Primary and Secondary solar slits are 2˚). In addition, these properties determining a fit function for the reflection peaks are known as Bragg-Brentano geometry is shown in Figure 2. Also additional convolution functions (Gaussian, lor-
Figure 1. X-ray diffraction patterns of the mixtures in different ratio.
Figure 2. Bragg-Brentano geometry with Rigaku definition.
the phase owing to the quality of sample.
In corrections part of the program, there are three main head as peak shift, intensity corrections and sample con- volutions. Peak shift composes of the zero error and
[image:3.595.128.473.439.664.2]goniometer and continues to be a major problem in the preparation of flat sample mounts for XRD analysis. Sample displacement can also be a problem when envi- ronmental conditions such as heating, cooling, or chang-ing the humidity cause the sample to expand or contract during analysis
(http://www.dxcicdd.com/05/PDF/John_Neil_1.pdf). Be- cause of the well alignment of the height of the sample, the sample displacement is zero but the shift of reflection peaks for the mixture was refined [17].
In intensity corrections, the polarization effects com- ing from the secondary Graphite monochromator have to be accounted for. Therefore, we consider LP factor as well and set the monochromator angle to 26.4˚ 2θ. Also in sample convolutions, the absorption coefficient (1/cm) can be refined to correct the significant profile shape distortion caused by the low mass absorption of the sam- ple. The absorption correction accounts for the profile distortion due to the sample transparency effect inherent to the Bragg-Brentano geometry. The absorption para- meter provides the effective mean absorption coefficient of the sample. For the Bragg-Brentano geometry this parameter is a fundamental parameter. However, absorp- tion results are only meaningful, if the instrument and the microstructure properties of all phases in the sample have been described properly. If these requirements cannot be fulfilled or if a different instrument geometry has been used, the absorption correction can be applied as an addi- tional, empirical function to describe peak asymmetry. In this case the refined absorption parameter does not have a physical meaning.
The maximum peak’s “d” values of the dolomite and calcite phases in “structure/hkl phase” of program are controlled from JPDS cards. Peak shift can be the prob- lem for lattice parameters therefore it must be corrected with Eva or similar programs. In all phases, values of the scale factor must be refined to minimize to 0.001. Pre- ferred orientations in scan must be determined in PO March-Dollase page of the cif extension file menu of the program [18]. Preferred orientation correction for up to
two directions. The TOPAS Structure Database contains the typical preferred orientation direction for most of its entries. Here, for calcite and dolomite crystal minerals, this direction (1 0 4) is included and therefore automati- cally entered into the hkl field of the PO March-Dollase page. This correction decreases importantly the RWP va- lue. In case of doubt the March-Dollase parameter and its refinement code should be set to 1 and “Fix”, respec- tively, unless preferred orientation has always to be con- sidered for the present phase.
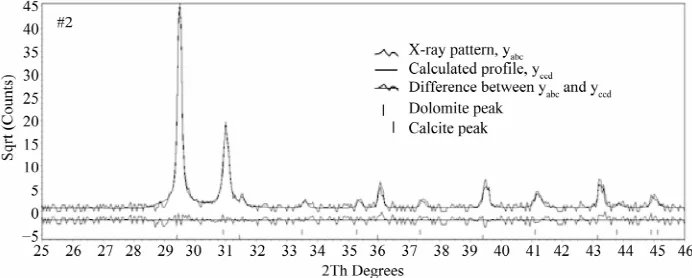
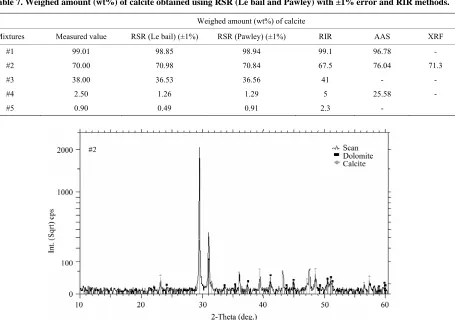
The following methodology was undertaken to esti- mate the phase composition of two-phase mixtures. Rietveld structure refinements for the crystal structure of the minerals were performed on a reduced 2θ range be- tween 25˚ and 46˚. These limits of the analysis were cho- sen to encompass the main reflections each phase, which are illustrated only for the sample #2 in Figure 3. In the
figure, the waved peaks and the solid line peaks show X-ray pattern, yobs, and the calculated profile, ycal, respec-
tively. The differences under the main peaks of calcite and dolomite are caused by adjustment difficulties based on the crystallinity of the phases. Also the peaks of cal-cite and dolomite in Figure 3 are separated by “|” symbol.
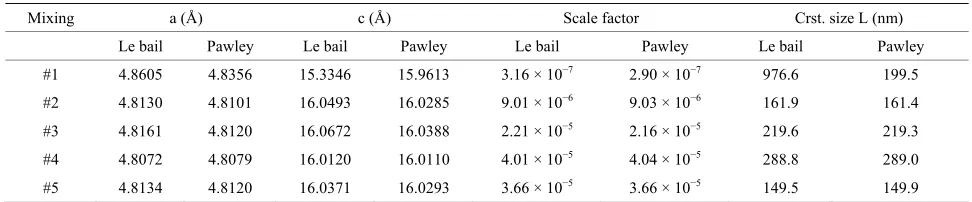
Pawley and Le Bail fitting methods using a pseudo-Voigt peak shape model in the RSR were used in analyses of all samples. All samples were refined assuming the possible presence of two phases, and refined structural models from the characterization of the single-phase standards were used for refinement of the two-phase standard mix-tures. Pattern backgrounds were initially modeled auto-matically by the TOPAS, then the method refines the in-plane and out-planes lattice parameters, the zero off- sets, scale factors, and crystal sizes for best goodness of fit and after the RSR, the obtained parameters for two fitting methods were given in the Tables 1 and 2. They
[image:4.595.124.470.579.718.2]all show an increasing or decreasing fluctuation for dif- ferent phases due to the non uniform particle size. How- ever when the values of dolomite show decreasing be- havior, in calcite exhibits increasing due to the increasing or decreasing weight amount of these phases.
Table 1. Dolomite structure data using Le bail and Pawley methods after RSR.
Mixing a (Å) c (Å) Scale factor Crst. size L (nm)
Le bail Pawley Le bail Pawley Le bail Pawley Le bail Pawley
#1 4.8605 4.8356 15.3346 15.9613 3.16 × 10⁻⁷ 2.90 × 10⁻⁷ 976.6 199.5
#2 4.8130 4.8101 16.0493 16.0285 9.01 × 10⁻⁶ 9.03 × 10⁻⁶ 161.9 161.4
#3 4.8161 4.8120 16.0672 16.0388 2.21 × 10⁻⁵ 2.16 × 10⁻⁵ 219.6 219.3
#4 4.8072 4.8079 16.0120 16.0110 4.01 × 10⁻⁵ 4.04 × 10⁻⁵ 288.8 289.0
[image:5.595.54.539.229.327.2]#5 4.8134 4.8120 16.0371 16.0293 3.66 × 10⁻⁵ 3.66 × 10⁻⁵ 149.5 149.9
Table 2. Calcite structure data using Le Bail and Pawley methods after RSR.
Mixing a (Å) c (Å) Scale factor Crst. size L (nm)
Calcite Le bail Pawley Le bail Pawley Le bail Pawley Le bail Pawley
#1 4.9802 4.9860 17.0682 17.0491 3.50 × 10⁻⁵ 2.18 × 10⁻⁵ 605.4 382.0
#2 4.9914 4.9881 17.0607 17.0381 1.77 × 10⁻⁵ 1.87 × 10⁻⁵ 732.7 761.6
#3 4.9934 4.9889 17.1004 17.0682 1.02 × 10⁻⁵ 9.23 × 10⁻⁶ 546.9 608.7
#4 4.9793 4.9784 17.0546 17.0682 4.09 × 10⁻⁷ 3.69 × 10⁻⁷ 320.7 320.6
#5 4.9963 4.9896 17.0564 17.0659 1.24 × 10⁻⁷ 2.83 × 10⁻⁷ 429.3 428.0
Scale factors for every two phases are controlled dur-ing fit progress. The purpose of scale factors is to scale the calculated intensities of each phase to the observed in- tensities of the pattern. It is therefore obvious, that scale factors are directly depended on external factors such as the intensity of the X-ray beam and measurement time. Consequently it is impossible to provide default values for scale factors, which are globally valid. Scale factors are linear and very stable parameters and can be off for even some orders of magnitude. However, additional refinement cycles will be required to bring the scale fac- tors in while complex refinements may become jeopard- ized. In any case poor scale factors hamper a visual check of the calculated data quality. It is therefore ad- visable not to stick with poor scale factors but to deter- mine and to apply better start values before proceeding with the refinement [1]. Physical characteristics of the sample may give rise to microabsorption or extinction which influences the final value of SCal. and SDol.. In addi-
tion, the specimen preparation procedure may favour preferential orientation, especially when powder crystal- lites have anisotropic shape. Other sources of error in the estimated scale factor depend only on statistical consid- erations. Accepting that the diffraction profile has been measured with a wise combination in the selected step size with measuring time per step [19]. The relative weight fractions WCal./WDol. do not influence much the estimated
errors in SCal. and SDol.. However, the low or high peak/
background intensity ratio led to high errors in SCal. and
SDol., respectively [20]. Therefore, it is trick during the
fitting that if the calculated intensities for all phases are very low or high, the refinement is canceled and in- creased all scale factors from the old value to 0.001.
The difference plot in Figure 3 does not show any sig-
nificant misfits. The differences under the main peaks of calcite and dolomite are caused by adjustment difficulties based on the crystallinity of the phases. For all refined patterns, the weighted profile R factor, Rwp values lie
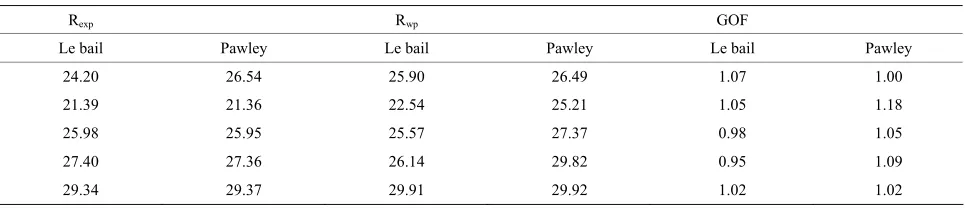
from 22.54 to 29.91 and from 25.21 to 29.92 for Le bail and pawley fitting methods, respectively. The quality of the quantification is independent of the Rwp value ([21].
but the Rwp value is another indicator for misfits be-
tween the measured and calculated data. These values are sufficient for the purpose of this investigation because goodness of the observed X-ray, Rexp value shows similar
behaviors and they lie from 21.39 to 29.34 and from 21.36 to 29.37 for Le bail and Pawley fitting methods, respectively. Therefore for the quality of fit one needs looking the GOF values are the vicinity of 1 value for both Le bail and Pawley fitting methods. All of these values are shown in Table 3. After the refinement or fit-
ting with best Rexp, Rwp and GOF, the optimizing values
of cell mass, cell volume, crystal linear absorption coef- ficient and crystal density obtained by using the Le bail and Pawley methods for dolomite and calcite phases are given in Tables 4 and 5. When the cell masses of the
samples for every two phases are constant, the values of other physical parameter of samples for these phases show a fluctuation or less change. Therefore, weight fraction for each phase is very sensitive with scale factor more than these parameters. Also the optimized crystal densities for every phase determine the crystal densities of mixtures calculated as 2.814 (2.775), 2.784 (2.786), 2.790 (2.781), 2.794 (2.789) and 2.7845 (2.7845) g/cm3
for Le bail and Pawley methods, respectively.
Table 3. R-expected, weighted profile R factor and goodness of fit for Lebail and Pawley method after RSR.
Rexp Rwp GOF
Le bail Pawley Le bail Pawley Le bail Pawley
24.20 26.54 25.90 26.49 1.07 1.00 21.39 21.36 22.54 25.21 1.05 1.18 25.98 25.95 25.57 27.37 0.98 1.05 27.40 27.36 26.14 29.82 0.95 1.09
[image:6.595.56.539.241.347.2]29.34 29.37 29.91 29.92 1.02 1.02
Table 4. Cell mass, cell volume, cry linear absorption coefficient and cry density of dolomite mineral calculated using Lebail and Pawley methods after RSR.
Mixing Cell Mass Cell Vol (Å3) Cry Linear Absorption
Coeff. (1/cm) Cry. Density (g/cm3)
Dolomite Le bail Pawley Le bail Pawley Le bail Pawley Le bail Pawley
#1 553.202 553.202 314.7313 323.2263 142.917 139.161 2.919 2.842
#2 553.202 553.202 321.6755 321.4696 139.832 139.921 2.856 2.858
#3 553.202 553.202 320.9002 321.8436 140.169 139.759 2.863 2.854
#4 553.202 553.202 320.589 321.0125 140.305 140.120 2.865 2.862
[image:6.595.55.539.388.494.2]#5 553.202 553.202 321.3889 321.3959 139.956 139.953 2.858 2.858
Table 5. Cell mass, cell volume, cry linear absorption coefficient and cry density of calcite mineral calculated using Lebail and Pawley methods after RSR.
Mixing Cell Mass Cell Vol (Å3) Cry Linear Absorption
Coeff. (1/cm) Cry. Density (g/cm3)
Calcite Le bail Pawley Le bail Pawley Le bail Pawley Le bail Pawley
#1 600.521 600.521 368.134 368.142 201.563 201.558 2.709 2.709
#2 600.521 600.521 367.743 367.395 201.777 201.968 2.712 2.714
#3 600.521 600.521 367.024 368.222 202.172 201.515 2.717 2.708
#4 600.521 600.521 366.214 367.057 202.619 202.154 2.723 2.717
#5 600.521 600.521 367.891 367.892 201.696 201.696 2.711 2.711
every phase are used to calculate the weight amounts of phase in the mixture with the Equation (4). The calcu- lated values with RSR method for dolomite and calcite are presented in Tables 6 and 7 and they are compared
with weight amounts in the different ratios of five sam- ples were prepared by mixing these crystal minerals with high sensitivity in second column of Tables 6 and 7. The
measured values of dolomite in amounts are ranging from 0.9 to 99.1 as percentages. The calculated ones are from 1.15 to 99.58 in percentages in Le bail method. In Pawley method, the calculated values are from 0.1 to 98.8 in amounts. For calcite, the measured values are from 0.9 to 99.1 in percentages. In Le bail method the calculated values are ranging from 0.49 to 98.85, but in Pawley these are from 0.91 to 98.94 as percentages ( Ta-bles 6 and 7). The calculated values are in agreement
with these sensitive values between ±1.0 and ±1.5 error limits. These errors are due to impurity, goodness of fit, high noise in X-ray scan, very little anisotropic effects,
the calibration problems of X-ray devices etc. Also it is observed in Tables 6 and 7 that there are a perfect har-
mony between Le bail and Pawley methods and in low ratios of phase per percent, the fitting for every two method is very successful within error limits.
The RIR, AAS and XRF methods were used to com- pare with both RSR results and sensitive values for quan- titative analysis of these samples. The semi quantitative RIR methods are used commonly in many areas and it is very successive if it is used correctly, even contrariwise error exceeds 20 percent, which originates from favored directions of peaks. Samples are adapted to this case. Therefore, Figure 4 shows RIR fitting with commercial
EVA program of BRUKER firm for sample #2 and their results are given in Tables 6 and 7. In EVA program,
RIR method takes into account all peaks and depends on peak intensities. In Figure 4, there are the preferred
Table 6. Weighed amount (wt%) of dolomite obtained using RSR (Lebail and Pawley) with ±1% error and RIR methods.
Weighed amount (wt%) of dolomite
Mixtures Measured value RSR (Le bail) (±1%) RSR (Pawley) (±1%) RIR AAS XRF
#1 0.90 1.15 1.06 0.90 3.22 -
#2 30.00 29.02 29.16 32.50 23.96 28.7
#3 62.00 63.47 63.56 59.00 - -
#4 97.50 98.74 98.80 95.00 74.42 -
[image:7.595.77.532.219.539.2]#5 99.10 99.58 99.59 97.70 - -
Table 7. Weighed amount (wt%) of calcite obtained using RSR (Le bail and Pawley) with ±1% error and RIR methods.
Weighed amount (wt%) of calcite
Mixtures Measured value RSR (Le bail) (±1%) RSR (Pawley) (±1%) RIR AAS XRF
#1 99.01 98.85 98.94 99.1 96.78 -
#2 70.00 70.98 70.84 67.5 76.04 71.3
#3 38.00 36.53 36.56 41 - -
#4 2.50 1.26 1.29 5 25.58 -
#5 0.90 0.49 0.91 2.3 -
Figure 4. The result of quantitative RIR analyses made with commercial EVA program for the sample #2.
of peaks to these favored peaks, the errors in the results increase excessively. It is observed clearly in Figure 4
that the low intensities of RIR peaks for two phases are adopt with those of scan peaks unlike intensities of fa-vored peaks. In sixth column of Tables 6 and 7, weight
amounts are changed from 0.9 to 97.7 in dolomite, unless in calcite they are from 2.3 to 99.1. Results of RIR are in good agreement with other RSR and sensitive values within ±3 error limits.
Quantitative analysis with XRF is used as routine for carbonate samples and is known well as an accurate tech- nique. Therefore in this study it was used only for one sample and element percentages are 6.23, 0.04, 0.02, 47.89, 0.01 and 45.80 for MgO, SiO2, SO3, CaO, SrO and
CO2, respectively. Here CO2 element percentage was
measured with lost in fire. From Mg difference in dolo- mite and well known ratio of 21.7 percent, one can cal- culate the weight amount in percentage as 28.7 value for dolomite and then for calcite is 71.3 percent found by extracting from the hundred. They are compared to Ta-bles 6 and 7 and are in good agreement with sensitive
and RSR value for sample #2.
Table 8 presents the percent values of minerals calcu-
Table 8. The element percents using AAS.
Sample SiO2 CaO MgO Fe2O3 Al2O3 Unknown minerals CO2
#1 <0.05 48.95 0.70 <0.01 0.95 <0.05 39.40
#2 <0.05 43.95 5.20 <0.01 0.70 0.35 36.25
#3 <0.05 30.70 16.15 0.05 0.65 <0.05 22.20
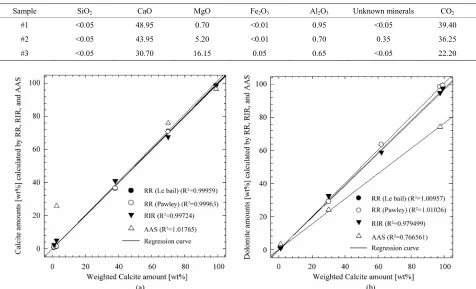
Figure 5. Regression curves of the nominal versus RSR, RIR and AAS phase compositions of the five-phase standard mix-tures bearing calcite and dolomite minerals.
ing to those of this method which are used commonly, give best adopt with sensitive values [22].
Finally, QPA for all methods is compared with sensi- tive values in regression curve in Figure 5. Here, R2 is
the coefficient of determination, the most common mea- sure of how well a regression model describes the data. The R2 values near 1 indicate that the equation is a good
description of the relation between the independent and dependent variables. R2 equals 0 when the values of the
independent variable do not allow any prediction of the dependent variables, and equals 1 when you can perfectly predict the dependent variables from the independent variables. For all methods, R2 values are given for calcite
and dolomite in inset of Figure 5. Among them, RSR
method gives best R2 values for carbonate samples.
4. Conclusion
The X-ray powder diffraction pattern is used as a finger- print to identify the phase. QPA of 5 carbonate samples bearing calcite and dolomite using XRD showed that the RSR method combined with the RIR, AAS and XRF methods is a suitable method for “routine” quantitative analyses. The calculation of powder diffraction pattern by means of RSR is made quantitatively by atomic ar- rangement of a crystal. Optimization of scale factor for
every phase is very effective on QPA and it is strongly related with structural properties as the lattice parameter, and peak properties as zero position. Errors in the crystal structure file obtained from the internet
(www.crystallography.net/search.html) are very impor- tant for QPA and therefore they were discussed. QPA is carried easily out if the derivations in the lattice parame- ter and peak shift are removed. The preferred orientations area serious problem for RIR method but RSR method overcomes easily this problem. Also RIR method gives the accurate results if one selects the peaks in the scan except the preferred ones. The RSR method with both Le bail and Pawley fitting functions for carbonate samples gives high quality results similar to those of RIR and XRF but not best results in respect of AAS.
5. Acknowledgements
I want to thank very much Dr. Mustafa Kemal Öztürk, Dr. Serap İçöz and Dr. Sezin Özaksoy for their sopport of my theses.
REFERENCES
[2] J. W. Reid, A. Jason and J. Hendry, “Rapid, Accurate Phase Quantification of Multiphase Calcium Phosphate Materials Using Rietveld Refinement,” Journal of Ap- plied Crystallography, Vol.39, 2006, pp. 536-543. doi:10.1107/S0021889806020395
[3] D. L. Bish and S. A. Howard, “Quantitative Phase Analy- sis Using the Rietveld Method,” Journal of Applied Crys- tallography,Vol.21, 1998, pp. 86-91.
[4] R. J. Hill, G. Tsambourakis and I. C. Madsen, “Improved Petrological Modal Analyses from X-Ray Powder Diffra- ction Data by Use of the Rietveld Method,” Journal of Petrology,Vol.34, No. 5, 1993, pp. 867-900.
doi:10.1093/petrology/34.5.867
[5] F. H. Chung, “Quantitative Interpretation of X-Ray Dif- fraction Patterns of Mixtures. II. Adiabatic Principle of X-Ray Diffraction Analysis of Mixtures,” Journal of Ap- plied Crystallography, Vol. 7, 1974, pp. 519-525. [6] C. R. Hubbard, E. H. Evans and D. K. Smith, “The Ref-
erence Intensity Ratio, I/Ic, for Computer Simulated Pow-
der Patterns,” Journal of Applied Crystallography,Vol.9, 1976, pp. 169-174. doi:10.1107/S0021889876010807 [7] I. C. Madsen, N. V. Y. Scarlett, L. M. D. Cranswick and
T. Lwin, “Outcomes of the International Union of Crys- tallography Commission on Powder Diffraction Round Robin on Quantitative Phase Analysis: Samples 1a to 1h,” Journal of AppliedCrystallography, Vol. 34, 2001, pp. 409- 426. doi:10.1107/S0021889801007476
[8] N. V. Y. Scarlett, I. C. Madsen, L. M. D. Cranswick and T. Lwin, “On-Line X-Ray Diffraction for Quantitative Phase Analysis: Application in the Portland Cement In- dustry,” Powder Diffraction, Vol. 16, No. 2, 2002, pp. 71- 80. doi:10.1107/S0021889801007476
[9] N. V. Y. Scarlett and I. C. Madsen, “Quantification of Pha- ses with Partial or No Known Crystal Structures,” Pow- der Diffraction, Vol. 21, No. 4, 2006, pp. 278-284. doi:10.1154/1.2362855
[10] B. Beckhoff, B. Kanngieβer, N. Langhoff, R. Wedell and H. Wolff, “Handbook of Practical X-Ray Fluorescence Analysis,” Springer, Berlin, 2006.
[11] R. J. Hill, “Improved Petrological Modal Analyses from X-Ray Powder Diffraction Data by Use of the Rietveld Method I. Selected Igneous, Volcanic, and Metamorphic Rocks,” Powder Diffraction, Vol.6, No. 2, 1991, pp. 74-
77. doi:10.1017/S0885715600017036
[12] R. A. Young, “Introduction to the Rietveld Method,” In- ternational Union of Crystallography Monographs on Cry- stallography, Vol. 5, Oxford University Press, Oxford, 1993, pp. 1-39.
[13] D. L. Bish and J. E. Post, “Quantitative Mineralogical Analysis Using the Rietveld Full-Pattern Fitting Method,” American Mineralogist,Vol.78, 1993, pp. 932-940. [14] W. A. Deer, R. A. Howie and J. Zussman, “Introduction
to the Rock Forming Minerals,” Longman, London, 1966, pp. 489-493.
[15] C. S. Hurlbut Jr., “Dana’s Manual of Mineralogy,” 17th Edition, John Wiley and Sons, Inc., New York, 1959, pp. 330-340, 609.
[16] R. W. Cheary and A. A. Coelho, “A Fundamental Pa- rameters Approach to X-Ray Line-Profile Fitting,” Jour- nal of Applied Crystallography,Vol.25, 1992, pp. 109- 121. doi:10.1107/S0021889891010804
[17] R. W. Cheary and A. A. Coelho, “Axial Divergence in a Conventional X-Ray Powder Diffractometer. II. Realiza- tion and Evaluation in a Fundamental-Parameter Profile Fitting Procedure,” Journal of Applied Crystallography, Vol.31, 1998, pp. 862-868.
doi:10.1107/S0021889898006888
[18] “Diffrac plus TOPAS v. 3.0 (Manual),” BRUKER AXS GmbH, Karlsruhe, 2006.
[19] R. J. Hill and C. J. Howard, “Quantitative Phase Analysis from Neutron Powder Diffraction Data Using the Rietveld Method,” Journal of Applied Crystallography, Vol. 20, 1987, pp. 467-474.
[20] F. Guirade, S. Gali and S. Chinchon, “Quantitative Riet- veld Analysis of Aluminous Cement Clinker Phases,” Ce- ment and Concrete Research, Vol. 30, No. 7, 2000, pp. 1023-1029. doi:10.1016/S0008-8846(00)00289-1
[21] H. M. Rietveld, “A Profile Refinement Method for Nu- clear and Magnetic Structures,” Journal of Applied Crys- tallography, Vol. 2, 1969, pp. 65-71.
doi:10.1107/S0021889869006558