Optimization Method to Determine Gross Alpha-Beta in
Water Samples Using Liquid Scintillation Counter
Waleed M. Abdellah
National Center for Nuclear Safety and Radiation Control, Atomic Energy Authority, Cairo, Egypt Email: [email protected]
Received July 17, 2013; revised August 17, 2013; accepted August 27, 2013
Copyright © 2013 Waleed M. Abdellah. This is an open access article distributed under the Creative Commons Attribution License, which permits unrestricted use, distribution, and reproduction in any medium, provided the original work is properly cited.
ABSTRACT
Liquid scintillation counting (LSC) is an adequate nuclear technique to determine radioactivity levels, as verified by this study for the determination of the gross alpha and beta activities of aqueous samples because of its simplicity and low associated cost comparison with other techniques. This paper discusses a new approach to the monitoring of gross alpha and gross beta activities in water. The method consists of using pulse decay discrimination (PDD) liquid scintillation counting LSC of 2 ml of the sample after conditioning with 12 ml of AB-Ultima Gold LSC cocktail, and PDD 139 con-dition. Different factors that affected on the counting efficiency were studied such as quench reaction, volume of sample, and type of vial. The gross alpha and gross beta particle activity measurement using 40K and 243Am with different
activi-ties concentration for efficiency determination. The calculated detection limits were 0.07 Bq/l and 0.12 Bq/l for gross alpha and gross beta respectively for 500 min measurements of samples produced by concentration of one liter of water.
Keywords: Water; LSC; Pulse Decay Discrimination; Alpha; Beta
1. Introduction
The presence of radioactivity in the environment is caus- ed by naturally occurring radionuclides and cosmic ra- diation but also by artificial radionuclides, which have been incorporated due to fallout from nuclear accidents and nuclear weapons testing [1]. Levels of naturally oc- curring radionuclides in the environment are known and in some locations where the levels are high due to the presence of natural radionuclides in the soil, the dose associated to natural sources is much higher than that from artificial sources. However controls for that contri- bution are not required, except for the case of drinking water, for which many countries have regulations [1]. Many guidance levels have been published to regulate the radiological content of water. In 1998, the European Council Directive 98/83/CE on the quality of water for human consumption was issued [2], which included pa- rameter levels for total dose (0.1 mSv/yr) and tritium content (100 Bq/l). This directive was devised on the basis of previous recommendations made by the World Health Organization [3], which proposed individual ra- dionuclide measurement when gross alpha and gross beta activities are over a screening threshold level (0.5 Bq/l for gross alpha, 1 Bq/l for gross beta). This directive was enforced in Spanish legislation in 2003 [4], which in-
cluded criteria of the European Directive but also pa- rameter values for gross alpha (0.1 Bq/l) and gross beta excluding 40K (1 Bq/l).
The liquid scintillation process is based on the conver- sion of a part of the kinetic energy of alpha/beta/gamma radiation into photons. The photons are counted and re- lated to the concentration of alpha/beta/gamma emitter. The principal use of liquid scintillation counting was the assay of low energy beta emitting nuclides. Alpha emit- ters could be counted by liquid scintillation counting was also known for long time [5].
relatively slow ion recombination processes in the scin- tillator might be the indirect cause of slow components. An alternate suggestion by Harrison [9] was that some molecules are initially excited to long lived (10−7 S) trip-
let states and they give rise to slow components. There was an opinion that the intensity of each (prompt and delayed) component is governed by characteristics of ingradients of the scintillator solution. Voltz et al. [10] maintained that delayed component is due exclusively to solvent triplets annihilating and eventual production of delayed solute fluorescence. Spurny [11] suggested that delayed fluorescence is caused by mutual annihilation of solute triplets. Ludwig et al. [12] have proposed that the delayed component is due to time lag of ion recombina- tion. Berlman et al. [13] have studied the effect of liquid scintillation solutions on pulse shape discrimination. They have concluded that quarternary scintillators (sol- vent containing 3 solutes) are most effective for pulse shape discrimination.
The pulse shape analysis technique can be used to de- tect recoil protons, alpha particles, fission fragments or other charged particles with high specific ionization in the presence of electron or vice versa [14].
The aim of this work was to develop a method for si- multaneous determination of gross alpha and gross beta in water samples by LSC was established. Therefore, different parameters affecting on the measurement were studied to provide a rapid results, adequate sensitivity and minimum sample preparation with widely using of chemical needed in order to make it applicable.
2. Experimental
2.1. Apparatus
Liquid scintillation counter, LSC model Packard TRI CARB 3170 TR/SL, which used PSD for α/β separation. The background is reduced by the presence of a guard of bismuth germinate (BGO), which surrounds the counting chamber.
2.2. Standard Solutions Preparation
High purity double deionized water and analytical re-
agents were used through this study in order to achieve the lowest possible minimum detectable activities (MDA). Standard solutions of 243Am prepared with different ac-
tivities and 40K standard solutions were prepared by dis-
solving KCl (MERK, 99% Analar) with different weight in de-ionized water for the total efficiency determination depending on the internal standard method. Three dif- ferent standards solutions were prepared A, B and C. First standard solution (A) was prepared from mixing equal activity of 243Am and 40K which have a reference
values for alpha and beta activities about 8 ± 0.1 Bq/l for both. Second standard solution (B) was prepared with lower activity of beta and higher of alpha from mixing
243Am with activity 8 ± 0.1 Bq/l and 40K with activity 1 ±
0.1 Bq/l. A third standard solution (C) was prepared from mixing higher activity of beta 40K 8 ± 0.1 Bq/l and lower
activity of alpha 243Am with 1 ± 0.1 Bq/l.
2.3. Procedures
Synthetic samples solutions were prepared by using dif- ferent volumes of 243Am and 40K standards with de-ion-
ized water to achieve different activity levels, corre- sponding to the minimum detectable activities MDA of the method, total of 20 spiked water samples were ana- lyzed.
The samples were adjusted pH to 2.5 with concen- trated HNO3 (68%). 100 ml of each sample was evapo-
rated directly in a Liquid scintillation vial a till 10 ml using hotplate with vigorous stirring in order to eliminate radon and to avoiding the salt precipitation. The maxi- mum temperature recommended for polyethylene vials was 80˚C. After evaporation the orthophosphoric acid is added to the evaporated samples to dissolve the salts. The treated samples were mixed with a certain amount of Packard AB-Ultima Gold LSC cocktail for starting the measurement. Each sample was counted for 500 min (2 × 250 min counts). Blanks were prepared by applying the same procedure as for samples taking into consideration the dilution factor [15].
The different factors affecting on the measurement
60
Samples counting on alpha channel alpha channel background Alpha activity
alpha efficiency sample volume
(1)
60
Alpha standard counting on alpha channel alpha channel background Alpha efficiency
alpha standard activity
(2)
60
Beta standard counting on alpha channel beta channel background Beta efficiency
beta standard activity
(3)
60
Samples counting on beta channel beta channel background Beta activity
beta efficiency sample volume
(4)
process such as quenching effect by using CCl4 with dif-
ferent concentration, volume of the sample and vial type (polyethylene or glasses) were studied.
Validation method has been done by analysis IAEA- Cu-2008-04, reference material which contains activity concentration 3.93 and 15.7 Bq/Kg for gross alpha and beta.
The equations, from (1) to (4) were used to calculate the alpha and beta activities and efficiencies.
Minimum detectable activities (MDA’s) are calculated as shown in Equation (5).
1 2
2.71 4.65 2.22
B MDA
T E AF V Y
(5)
where:
B = total counts for an appropriate reagent blank; T = count time in minutes;
E = counting efficiency;
AF = attenuation factor (if applicable);
V = sample volume (if applicable) in liters and; Y = chemical yield (if applicable).
The equation provides the result in pCi/L [16].
3. Results and Discussion
3.1. Calibration
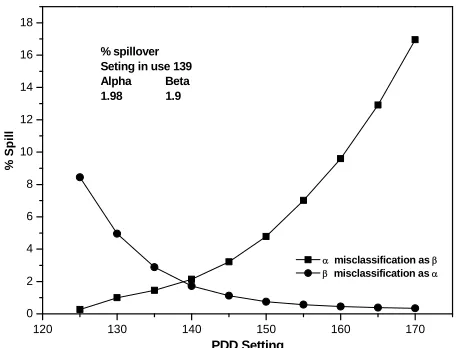
In order to optimize alpha/beta separation performance, it is essential to determine the correct PDD setting; the op- timum setting is the setting where there is equal and minimum spill of alpha pulses into the beta multichannel analyzer, MCA and beta pulses into the alpha MCA [17].
Determination of PDD required pure alpha and beta standard, for the most accurate results, the standards must be as near identical as possible to the unknown samples in their chemistry, volume, vial type, etc. To arrive the optimum setting each standard counted indi- vidually at a range of PDD setting and the percent mis- classification of alpha into beta MCA and vice versa are plotted against PDD on the same graph. Figure 1 repre- sents the typical misclassification plot for 36Cl and 241Am
standards for determination the optimum setting that re- sult in minimum misclassification of alpha and beta ac- tivity. The obtained calculated data show that 139 is the best setting for the PDD as in Figure 1.
When only beta emitters is of interest, a PDD values below the determined value may be used which minimize the misclassification of alpha activity into beta the MCA at the expense of reducing the beta efficiency similarly when alpha emitter is of interest [18].
3.2. Factors Influencing Alpha/Beta Discrimination
3.2.1. Quenching
In this approach, the misclassification is always deter-
120 130 140 150 160 170
0 2 4 6 8 10 12 14 16 18
% Sp
il
l
PDD Setting
misclassification as misclassification as
[image:3.595.309.537.85.259.2]% spillover Seting in use139 Alpha Beta 1.98 1.9
Figure 1. Misclassification for the determination of opti-mum PDD setting using 241Am and 36Cl standards.
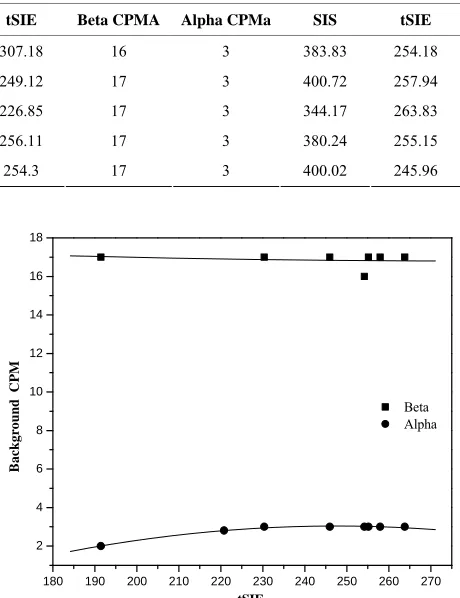
mined at the original PDD setting. By plot the percentage misclassification versus transformer spectral index of the sample, tSIE for single PDD setting. All samples then be counted within a single protocol and a correction for misclassification as a function of quench is applied. The following Figures 2 and 3 show the effect of quenching tSIE on percent misclassification of alpha and beta events using CCl4 with different concentrated for quench
reaction as in Table 1.
From Table 1 with increasing the concentration of CCl4 from 0 to 2000 µl the activity determined for 243Am
decrease from 557 CPM to 238 CPM and for 40K from
402 CPM to 424 CPM due to the effect of quench.
3.2.2. Materials of Vial
Glass vials and plastic vials were used and it was found that the efficiency obtained was very good in both plastic and glass vials. polyethylene vial used and the back- ground net count was 2 CPM and 9 CPM for alpha and beta respectively and it was lower than the glass vials 3 CPM and 17 CPM. The higher background due to the glass vials containing little amount of 40K in the glass
composition. So the plastic vials were chosen as the best option for display lower background as shown in Table 2 and this agree with other investigators Yu-Yufu et al., (1990) [19] and IAEA, (2010) [20].
3.2.3. Sample Volume
The results obtained from using different volumes of liquid scintillation cocktails, at which the samples were prepared by evaporation of the aqueous phase and resi- due dissolution with 2 ml, 4 ml of H3PO4 2 M acid solu-
tion. The volume was kept constant in all the measured samples. Although the different in volumes the best volumes is minimum volume due to the lower quench
Table 1. Alpha and beta activity measurements with different volume of quench solution (CCl4).
Am-243 (8 Bq/vial) K-40 (8 Bq/vial )
Volume of CCl4
Added by (µl) Alpha CPM SIS tSIE Beta CPM SIS tSIE
0 557 384.11 372.12 402 547.96 411.73
100 524 375.85 262.99 402 550.01 290.50
200 492 321.13 221.36 402 541.49 281.03
400 379 269.98 163.68 424 428.00 173.49
500 357 235.29 144.64 406 377.60 145.02
700 351 206.74 120.16 420 318.21 116.78
800 342 200.90 397.28 413 304.01 107.39
1000 310 155.57 94.67 422 270.95 89.79
1500 266 115.70 68.84 409 230.63 74.40
2000 238 97.48 60.89 416 176.27 52.19
[image:4.595.55.540.100.289.2]SIS = Spectral Index of the Sample; tSIE = Transformed Spectral Index of the External Standard.
Table 2. Influence of vial type in determining gross alpha and beta activity.
Background net count (Polyethylene vials) Background net count (Glass vials) Sample Time count
(min) Beta CPMA Alpha CPMa SIS tSIE Beta CPMA Alpha CPMa SIS tSIE
1 8 2 462.39 307.18 16 3 383.83 254.18
2 9 2 444.06 249.12 17 3 400.72 257.94
3 9 2 527.67 226.85 17 3 344.17 263.83
4 9 2 462.54 256.11 17 3 380.24 255.15
5
250
9 3 493.60 254.3 17 3 400.02 245.96
CPMA = Count per minute for beta; CPMa = Count per minute for alpha.
180 200 220 240 260 280 300 320 340
2 3 4 5 6 7 8 9
tSIE
Ba
ckgro
und
C
P
M
[image:4.595.57.538.326.434.2]Beta Alpha
Figure 2. Alpha and beta background count rate as a func-tion of transformer spectral index (tSIE) for polyethylene LSC vials.
4. Accuracy of Measurement with Varying
α/β Ratios
A set of standards containing varying quantities and ra-
180 190 200 210 220 230 240 250 260 270
2 4 6 8 10 12 14 16 18
tSIE
B
a
ckgr
o
u
nd C
P
M
Beta Alpha
Figure 3. Alpha and beta background count rate as a func-tion of transformer spectral index (tSIE) for glass LSC vi-als.
tios of Alpha and Beta was measured to assess the accu- racy.
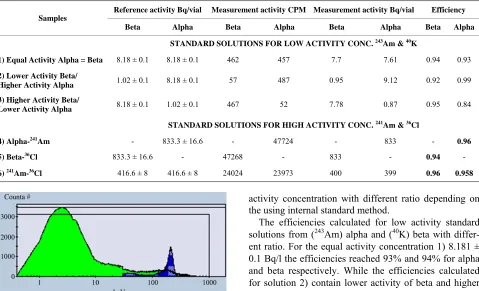
[image:4.595.308.538.340.639.2] [image:4.595.61.286.455.642.2]Table 3. Efficiencies calculated for standard solutions contain different ratio from alpha and beta.
Reference activity Bq/vial Measurement activity CPM Measurement activity Bq/vial Efficiency Samples
Beta Alpha Beta Alpha Beta Alpha Beta Alpha
STANDARD SOLUTIONS FOR LOW ACTIVITY CONC. 243Am & 40K
1) Equal Activity Alpha = Beta 8.18 ± 0.1 8.18 ± 0.1 462 457 7.7 7.61 0.94 0.93
2) Lower Activity Beta/
Higher Activity Alpha 1.02 ± 0.1 8.18 ± 0.1 57 487 0.95 9.12 0.92 0.99
3) Higher Activity Beta/
Lower Activity Alpha 8.18 ± 0.1 1.02 ± 0.1 467 52 7.78 0.87 0.95 0.84
STANDARD SOLUTIONS FOR HIGH ACTIVITY CONC. 241Am & 36Cl
4) Alpha-241Am - 833.3 ± 16.6 - 47724 - 833 - 0.96
5) Beta-36Cl 833.3 ± 16.6 - 47268 - 833 - 0.94 -
[image:5.595.59.538.102.393.2]6) 241Am-36Cl 416.6 ± 8 416.6 ± 8 24024 23973 400 399 0.96 0.958
[image:5.595.58.287.447.548.2]Figure 4. Alpha and beta spectra of sample measured at PDD 139 when the activity of alpha equals the activity of beta (A).
Figure 5. Alpha and beta spectra of sample measured at PDD 139 when the activity of alpha higher than the activity of beta (B).
Figure 6. Alpha and beta spectra of sample measured at PDD 139 when the activity of beta higher than the activity of alpha (C).
activity concentration with different ratio depending on the using internal standard method.
The efficiencies calculated for low activity standard solutions from (243Am) alpha and (40K) beta with differ-
ent ratio. For the equal activity concentration 1) 8.181 ± 0.1 Bq/l the efficiencies reached 93% and 94% for alpha and beta respectively. While the efficiencies calculated for solution 2) contain lower activity of beta and higher of alpha reached 99% for alpha and 92% for beta and in case of higher activity of beta and lower alpha 3) the ef- ficiencies about 84% for alpha and 95% for beta. The efficiencies calculated for high activity concentration 833.3 ± 16.6 Bq/l for standard solutions contain (241Am)
alpha 4) and (36Cl) beta 5) reached 96% for pure alpha
and 94% for pure beta and for equal activity concentra- tion 6) the efficiencies about 95% and 96% for alpha and beta respectively.
The validation of the results were done by analysis certified reference material IAEA-Cu-2008-04, the ob- tained results were within acceptable values for alpha 3.44 Bq/kg and 14.7 Bq/kg for beta
5. Conclusions
Liquid scintillation counting LSC with the simple time resolved counter was an adequate nuclear technique to determined gross alpha and beta activities of water sam- ples. The results confirm the validity of the method for fast and inexpensive procedure beside the simplicity of sample preparation.
[image:5.595.58.287.595.699.2]Bq/l for gross alpha and 0.12 Bq/l for gross beta. These values meet the guidelines required by world health or- ganization WHO 2008 [22].
REFERENCES
[1] Environmental Protection Agency (EPA), “National Pri-mary Drinking Water Regulations,” Final Rules, 40 CFR, Part 9, 2000, pp. 141-142.
[2] European Union Council Directive 98/83/EC, “The Qual- ity of Water Intended for Human Consumption,” Official Journal, 1998.
[3] World Health Organization (WHO), “Guidelines for Drinking Water Quality,” 3rd Edition, Vol. 1, 2006. [4] Real Decreto, Directive 140/2003, “Establecen Los
Crite-rios SanitaCrite-rios De La calidad Del Agua De Consumo Humano,” Official Journal, 2003, BOE No. 45.
[5] J. K. Basson and J. Steyn, “Absolute Alpha Standardiza- tion with Liquid Scintillators,” Proceedings of the Physi- cal Society. Section A, Vol. 67, No. 67, 1954, pp. 297- 298.
[6] L. Bittman, M. Furstand and H. Kallmann, “Decay Times, Fluorescent Efficiencies, and Energy Storage Properties for Various Substances with Gamma-Ray or Alpha-Par- ticle Excitation,” Physical Review, Vol. 87, No. 1, 1952, pp. 83-86. doi:10.1103/PhysRev.87.83
[7] T. Marrod’an Undagoitia, F. von Feilitzsch, L. Oberauer, W. Potzel, A. Ulrich, J. Winter and M. Wurm, “Fluores- cence Decay-Time Constants in Organic Liquid Scintil- lators,” Journal of Review of Scientific Instruments,Vol. 80, No. 4, 2009, Article ID: 043301.
[8] H. Kallmann and G. J. Brucker, “Decay Times of Fluo- rescent Substances Excited by High Energy Radiation,” Physical Review, Vol. 108, No. 5, 1947, pp. 1122-1130. doi:10.1103/PhysRev.108.1122
[9] F. B. Harrison, “Large-Area Liquid Scintillation Count- ers,” Nucleonics, Vol. 10, No. 6, 1952, pp. 40-45. [10] R. Voltz, H. Dupont and G. Laustriat, “Radioluminescen-
ce des Milieux Organiques. II. Vérification Expérimentale de l'Étude Cinétique,” Journal de Physique, Vol. 29, No. 4, 1968, pp. 297-305.
doi:10.1051/jphys:01968002904029700
[11] F. Spurny, “Radio-Luminescence in Organic Liquids. II. Basis of the Delayed Component in Benzene and Tolu- ene,” Collection of Czechoslovak Chemical Communica- tions, Vol. 35, No. 2, 1970, pp. 565-575.
doi:10.1135/cccc19700565
[12] P. K. Ludwig and M. Huque, “Ionic Processes in High- Energy-Induced Luminescence of Liquid Organic Sys- tems,” Journal of Chemical Physics, Vol. 49, No. 2, 1968, p. 805. doi:10.1063/1.1670143
[13] I. B. Berlman and O. J. Steingraber, “Liquid Scintillation Solutions for Puls Decay Discrimination,” Nuclear In- struments and Methods, Vol. 108, No. 3, 1973, pp. 587- 591. doi:10.1016/0029-554X(73)90542-9
[14] N. N. Mirashi, C. Keshav and S. K. Aggarwel, “Liquid Scientillation Counting Techniques for The Determina-tion of Some Alpha Emitting Actinides,” Bhabha Atomic research Center, 2000.
[15] F. D. Fabiana and T. T. Maria Helena, “Total Alpha and Beta Determination by Liquid Scintillation Counting in Water Samples from a Brazilian Inter-Comparison Exer-cise,” International Nuclear Atlantic Conference INAC, Brazil, 2009.
[16] Department of Energy (DOE), “Compliance with DOE 5480.11: The Urine Bioassay Program at Y-12,” Applica-tion Note, Canberra Nuclear, 1990.
[17] N. Q. Mien and B. V. Loat, “Determination of the Annual Beta Dose by Measuring Beta Activity Using the Liquid Scintillation Technique,” Journal of Science, Mathemat- ics, Physics, Vol. 24, No. 1, 2008, pp. 36-41.
[18] Z. Hamzah, M. Alias and Z. Ahmad, “Discriminator Set- ting and Cocktail Preparation for Analysis of Alpha and Beta Emitters in Aqueous Solution Using Liquid Scintil- lation Counter,” The Malaysian Journal of Analytical Sciences, Vol. 15, No. 1, 2011, pp. 27-36.
[19] Yu. Yufu, B. Salbu, H. E. Bjoernstad and H. Lien, “Im- provement for α-Energy Resolution in Determination of Low Level Plutonium by Liquid Scintillation Counting,” Journal of Radioanalytical and Nuclear Chemistry Let- ters, Vol. 45 No. 5, 1990, p. 345.
doi:10.1007/BF02165075
[20] International Atomic Energy Agency (IAEA), “Analytical Methodology for the Determination of Radium Isotopes in Environmental Samples,” Analytical Quality in Nu- clear Applications No. IAEA/AQ/19, 2010.
[21] R. I. Kleinschmidt, “Gross Alpha and Beta Activity Analysis in Water—A Routine Laboratory Method Using Liquid Scintillation Analysis,” Journal Applied Radiation and Isotopes, Vol. 61, No. 21, 2004, pp. 333-338.