www.hydrol-earth-syst-sci.net/19/3991/2015/ doi:10.5194/hess-19-3991-2015
© Author(s) 2015. CC Attribution 3.0 License.
Technical Note: The use of an interrupted-flow centrifugation
method to characterise preferential flow in low permeability media
R. A. Crane1,2, M. O. Cuthbert2,3, and W. Timms2,4
1School of Civil and Environmental Engineering, UNSW, Sydney, Australia 2Connected Waters Initiative Research Centre, UNSW, Sydney, Australia
3School of Geography, Earth and Environmental Sciences, University of Birmingham, Birmingham, UK 4School of Mining Engineering, UNSW, Sydney, Australia
Correspondence to: R. A. Crane ([email protected])
Received: 5 December 2014 – Published in Hydrol. Earth Syst. Sci. Discuss.: 7 January 2015 Revised: 10 August 2015 – Accepted: 12 August 2015 – Published: 25 September 2015
Abstract. We present an interrupted-flow centrifugation technique to characterise preferential flow in low permeabil-ity media. The method entails a minimum of three phases: centrifuge-induced flow, no flow and centrifuge-induced flow, which may be repeated several times in order to most effectively characterise multi-rate mass transfer behaviour. In addition, the method enables accurate simulation of rele-vant in situ total stress conditions during flow by selecting an appropriate centrifugal force. We demonstrate the util-ity of the technique for characterising the hydraulic proper-ties of smectite-clay-dominated core samples. All core sam-ples exhibited a non-Fickian tracer breakthrough (early tracer arrival), combined with a decrease in tracer concentration immediately after each period of interrupted flow. This is indicative of dual (or multi-)porosity behaviour, with so-lute migration predominately via advection during induced flow, and via molecular diffusion (between the preferential flow network(s) and the low hydraulic conductivity domain) during interrupted flow. Tracer breakthrough curves were simulated using a bespoke dual porosity model with excel-lent agreement between the data and model output (Nash– Sutcliffe model efficiency coefficient was >0.97 for all samples). In combination, interrupted-flow centrifuge exper-iments and dual porosity transport modelling are shown to be a powerful method to characterise preferential flow in low permeability media.
1 Introduction
advec-tion and diffusion phenomena occurring for nonreactive so-lute transport in aggregated media. The idea proposed was that, by interrupting flow during nonreactive tracer break-through, the degree of nonequilibrium between any fast- and slow-flow pathways can be determined. Central to this hy-pothesis is that the magnitude of the change in nonreac-tive tracer concentration in effluent samples taken immedi-ately after a no-flow period is indicative of such nonequi-librium. Subsequent work within this field has included de-termination of physical (e.g. diffusive mass transfer between advective and nonadvective water) and chemical (e.g. non-linear sorption) nonequilibrium processes in soil (Brusseau et al., 1997), determination of nonreactive solute exchange between the matrix porosity and preferential flow paths in fractured shale (Reedy et al., 1996), quantifying the effect of aggregate radius on diffusive timescales in dual poros-ity media (Cote et al., 1999), numerical modelling of aque-ous contaminant release in nonequilibrium flow conditions (Wehrer and Totsche, 2003), empirical modelling of the re-lease of dissolved organic species (Guimont et al., 2005; Ma and Selim, 1996; Totsche et al., 2006; Wehrer and Totsche, 2005, 2009) and heavy metals (Buczko et al., 2004), increas-ing the efficiency of solute leachincreas-ing (Cote et al., 2000), em-pirical modelling of conservative tracer transport in a lam-inated sandstone core sample (Bashar and Tellam, 2006), and characterising in situ aquifer heterogeneity (Gong et al., 2010). One area where comparatively few studies ex-ist, however, is in characterising the hydraulic properties of aquitards (e.g. clay-dominated soils and sediments, shales, and mudstones). Such research is of particular interest be-cause preferential flow paths, by their intrinsic nature, can significantly compromise the integrity of aquitard units as local and regional barriers to the movement of groundwa-ter contaminants. There are significant technical difficulties at present, however, in characterising such features at ap-propriate scales (Cuthbert et al., 2010). For example, it is well known that the K of glacial till is scale dependent, with laboratory permeability measurements often yielding values lower than field-based measurements and modelling (Cuthbert et al., 2010). As a consequence, a key requirement of laboratory-scale aquitard characterisation is that the core sample must be of sufficient volume in order to incorporate the key dual porosity features which govern the overall for-mation. A second technical challenge is that laboratory test-ing typically requires generation of flow through the sample whilst maintaining relevant in situ hydro-geotechnical con-ditions. One method which has been demonstrated as ef-fective for this purpose is centrifugation, which is increas-ingly being used for hydraulic and geotechnical testing of lowKmaterials (Hensley and Schofield, 1991; Nimmo and Mello, 1991; Timms et al., 2009; Timms and Hendry, 2008). Moreover, experiments using geotechnical centrifuges with payload capacities exceeding several kilograms can provide the additional benefit of being able to use core samples of representative scale for the overall formation. Here we
present, for the first time, an interrupted-flow methodology using a centrifuge permeameter (CP) to characterise possi-ble dual porosity behaviour of low permeability porous me-dia. A novel dual domain model is also described which has been used to guide physical interpretation of the experimen-tal tracer breakthrough curves.
2 Experimental methods
2.1 Core and groundwater sampling methodology The clay core (101.6 mm in diameter, Treifus core barrel, nonstandard C size) and groundwater were sourced from a 40 m thick, semi-consolidated, clay-rich alluvium deposit lo-cated approximately 100 km south of Gunnedah, New South Wales, Australia (31◦310900S, 150◦280700E). Equipment and procedures for obtaining minimally disturbed cores were compliant with ASTM (2012). See Timms et al. (2014) for a review of the procedure. Groundwater samples were taken from piezometers using standard groundwater quality sam-pling techniques (Sundaram et al., 2009). A 240 V electric submersible pump (GRUNDFOS MP1) and a surface flow cell were used to obtain representative samples after purg-ing stagnant water to achieve constant field measurements of electrical conductivity (EC), pH, dissolved oxygen (DO) and reduction potential (Eh).
2.2 Centrifuge permeameter theory
During centrifugation, increased centrifugal force generates a body force which accelerates both solid and fluid phases within the sample. Centrifugal acceleration at any point within a centrifuge sample is calculated as follows:
a=ω2r, (1)
wherea is the centrifugal acceleration (m s−2),ωis the an-gular velocity (rad s−1), andris the radius from the axis of rotation (m). Theglevel is the scaling factor (a/g) for accel-erated gravity, wheregis gravity at Earth’s surface.
Vertical hydraulic conductivity,Kv(m s−1), is calculated using ASTM (2000) (Eq. 2), whereQis the steady-state fluid flux (mL h−1), A is the sample flow area (cm2), rm is the radial distance at the midpoint of the core sample (cm), and RPM is revolutions per minute.
Kv=
0.248Q Arm(RPM)2
(2) The estimated in situ stress applied at the base of the core samples was calculated according to Eq. (3) and assumes that the overlaying formations were fully saturated and of a simi-lar density to the core samples.
σi=ρsdg, (3)
(m below ground level (b.g.l.)); andgis the gravitational ac-celeration (m s−2). The applied stress at the base of the core (σg, kPa) during the centrifuge experiments was calculated according to Eq. (4) (Timms et al., 2014).
σg= h
ρbLc
+ρw
Lc+hw i
ab, (4)
whereρbis the core bulk density (kg m−3),Lc is the length of the CP core specimen (mm), ρw is the influent density (kg m−3), h
w is the height of influent water above the CP core specimen (mm), andabis the centrifugal acceleration at the base of the CP core specimen.
2.3 Centrifuge permeameter sample preparation A Broadbent geotechnical centrifuge (GMT GT 18/0.7 F) with a custom-built permeameter module (Timms et al., 2014) was used for this study. Prior to mounting into the CP, the outer 5 mm of the clay cores were trimmed and the trimmed cores were then inserted into Teflon cylindri-cal core holders (100 mm internal diameter, 220 mm length) using a custom-built mechanical cutting and loading device. The cores were trimmed in order to remove any physical and chemical disturbance associated with the core extraction (drilling) process. A 5 mm thick A14 Geofabrics Bidim ge-ofabric filter (100 micron, K=33 m s−1) was placed above and below the sample in order to prevent clogging of the ef-fluent drainage plate with colloid material from the sample. The geofabric filter was held in position above the sample using a plastic clamp.
The core holders (with the core sample held within) were placed into 3000 mL glass beakers containing 1000 mL of groundwater derived from the piezometer at the closest depth to the core sample (see Table 1) and allowed to saturate from the base upwards. In total three core samples were analysed, which were taken from depths of 5.03, 9.52, and 21.75 m b.g.l. Saturation was performed by immersing the core holder into a reservoir of groundwater with the level of the water 5 cm higher than the top of the core sample. The mass of each core was then monitored every 24 h until no further increase in mass was recorded, saturation was then assumed to have occurred. The core holders (containing the saturated core samples) were mounted to the CP system via double O-ring seals. An influent head was added to all sam-ples (see Table 1), which was maintained during centrifuga-tion by a custom-built automated influent level monitoring and pumping system. The system comprises a carbon fibre EC electrode array which is connected via a fibre optic ro-tary joint to a peristaltic pump that supplies influent from an external 100 mL burette. Effluent samples were collected in an effluent reservoir and extracted using a 50 mL syringe. All experiments were conducted under steady-state flow, which is defined as a<10 % difference between influent and efflu-ent flow rates. The influefflu-ent volume was determined by man-ual measurements of the water level in the external burette
and effluent volumes were measured by multiplying their mass by their density.
2.4 Interrupted-flow experiment methodology
The idea of interrupting the flow during a breakthrough ex-periment is to differentiate between advection and diffu-sion processes. The method comprises a minimum of three phases.
1. Flow is induced at a constant centrifugal force for a fixed time period with effluent samples collected at mul-tiple periodic intervals. Theg level and influent reser-voir height are selected so that the maximum total stress on the core approached the estimated in situ stress of the material at the given depth in the formation (Eqs. 3, 4). The time period between each effluent sampling inter-val is selected in order to gain sufficient effluent volume (namely>1 mL) for accurate volume and nonreactive tracer concentration measurement.
2. Flow is interrupted (stopped) for a fixed time period during which time the permeameters are disconnected from the centrifuge module and positioned upright, the influent reservoir is also removed to limit any downward migration of solutes. A relatively long interrupted-flow period (>12 h) is selected so that slow mass transfer processes can be identified.
3. Phase 1 is then repeated.
All phases can be repeated multiple times in order to record sufficient nonreactive tracer breakthrough which enables the mass transport behaviour to be accurately characterised. Deuterium oxide (D2O) (Acros Organics, 99.8 % concen-tration) was used as a nonreactive tracer. A concentration of 3.12 mL L−1 was used, which raised the concentration of D2O to approximately 200 %. This was selected as suf-ficiently high in order to result in accurately measurable mass transfer changes. Effluent samples were filtered using a 0.2 µm cellulose acetate filter, stored at 4◦C and analysed forδD within 7 days of testing.δD was determined by mea-suring the1H/2H ratio to an accuracy of 0.1 % using a Los Gatos DLT100 isotope analyser.
2.5 Dual domain transport modelling
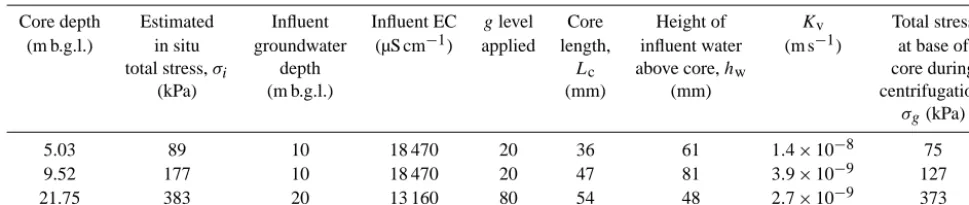
Table 1. Core and influent properties, experimental parameters andKvresults for the interrupted-flow experiments. Calculations are based on Eq. (2) forKv, Eq. (3) for estimated in situ total stress and Eq. (4) for total stress at the base of the core specimen during centrifugation.
Core depth Estimated Influent Influent EC glevel Core Height of Kv Total stress (m b.g.l.) in situ groundwater (µS cm−1) applied length, influent water (m s−1) at base of
total stress,σi depth Lc above core,hw core during (kPa) (m b.g.l.) (mm) (mm) centrifugation,
σg(kPa)
5.03 89 10 18 470 20 36 61 1.4×10⁻⁸ 75 9.52 177 10 18 470 20 47 81 3.9×10⁻⁹ 127 21.75 383 20 13 160 80 54 48 2.7×10⁻⁹ 373
representing exchange of solute with an immobile zone (sub-script im). Solute transport in the immobile zone was by diffusion only. The exchanged flux between the immobile and mobile zones was modelled as being proportional to the concentration difference between the zones. The governing equations are as follows:
∂Cm ∂t =Dm
∂2Cm ∂z2 −
q(t ) ∅m
∂Cm ∂z −
γ ∅m
Cm−Cim
, (5)
∂Cim ∂t =µ
∂2Cim ∂z2 +
γ ∅im
Cm−Cim
, (6)
Dm= ∝q(t )
∅m
+µ, (7)
whereCis theδD isotope ratio (1),tis time (T),zis distance along the column (L),q is fluid flux (L T−1),αis hydrody-namic dispersivity (L),µis the coefficient of molecular dif-fusion (L2T−1). The porosity,∅, of the mobile and immobile domain is defined as
∅m= Vp,m
VT
, (8)
∅im=Vp,im VT
, (9)
where Vp,m is the pore volume of the mobile domain (L), Vp,im is the pore volume of the immobile domain (L) and VT is the total volume of the saturated core (L). The mass transfer coefficient,γ (T−1), is defined as
γ =β∅mµ
a2 , (10)
where β is the dimensionless geometry coefficient, which typically ranges from 3 for rectangular slabs to 15 for spher-ical aggregates, anda is the characteristic half width of the matrix block (L) (Gerke and van Genuchten, 1993).
The initial concentration conditions were set to zero for both domains for all model runs. During centrifugation peri-ods, a variable solute flux upper boundary condition was used for the mobile domain and varied according to the product of the measured fluid flux and input concentration (C0) during
each experiment as follows:
q (t ) ∅m
C0= q (t )
∅m
Cm+Dm ∂Cm
∂z . (11)
A Dirichlet (constant concentration) upper boundary condi-tion was used for the immobile domain during times of cen-trifugation. A novel aspect of the models, facilitated by the flexibility of model structure variations possible in COM-SOL Multiphysics, was that the upstream transport boundary for both domains was switched to a zero flux condition dur-ing the interrupted-flow phases. The downstream transport boundary conditions for both domains were given by
∂Cm,im
∂z =0, (12)
atz=Lb, whereLbwas sufficiently large to ensure the re-sults at the column outlet distance (atz=Lc,LcLb) were not sensitive to the position of the boundary. The total mass flux at the distance from the upstream boundary correspond-ing with the length of the experimental column was output from the models and integrated over the sampling periods for comparisons to the observed breakthrough curves.µwas calculated as 3.43×10⁻⁵m2d−1which is the diffusion coef-ficient of D2O in H2O at 25.0◦C (Orr and Butler, 1935) mul-tiplied by the average tortuosity of 0.15 reported by Barnes and Allison (1988) for clay bearing media. Model output was fitted to the observed data by varying the unconstrained pa-rameters:αandγ. Note that∅mand∅imwere also consid-ered unconstrained parameters but their sum was constrained to equal total∅measured for each sample by oven drying at 105◦C for 24 h. In order to quantify the deviation
2.6 Dual domain model sensitivity testing
Sensitivity analysis of the dual domain model (for the core taken from 5.03 m) was conducted in order to determine how sensitive the model was to changes in the constrained (Lc,∅ andµ) and unconstrained (∅m,αandγ) parameters. Sen-sitivity factors for constrained parameters were determined according to the estimated percentage error associated with each parameter, whilst ±50 % was selected for the uncon-strained parameters in order to determine their influence on the NSMEC. The percentage error forLcwas calculated to be±2.78 % due to the core length being 36 mm, and the er-ror associated with measurement at each end was±0.5 mm. The percentage error for ∅was calculated to be±2.79 %, which comprises the Lc measurement error plus 0.0026 % which is the calculated error associated with the two mass measurements. The percentage error for µwas determined to be±50 % due to the range in tortuosity of 0.1–0.2 docu-mented by Barnes and Allison (1988) and references therein.
3 Results and discussion 3.1 D2O breakthrough
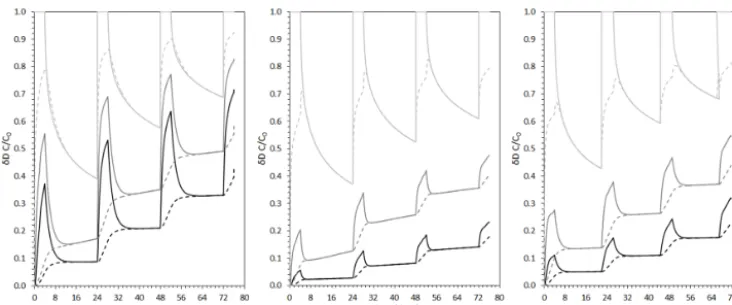
D2O breakthrough data and best-fit dual porosity model out-put for the interrupted-flow experiments conducted using core samples taken from 5.03, 9.52, and 21.75 m b.g.l. are displayed in Fig. 1. A close fit was achieved between the dual porosity model output and the original data, with a NS-MEC of 0.97, 0.99 and 0.97 and a NRMSE of 5, 3, and 5 % recorded for D2O breakthrough data from core sam-ples taken from 5.03, 9.52, and 21.75 m b.g.l., respectively. The D2O breakthrough curves for all core samples exhib-ited a relatively elongated shape, with 100 % breakthrough not recorded for any of the timescales tested. This was ex-pected given that a “long tailing” is a common feature of dual (or multi-)porosity materials, i.e. systems where the mobile domain is coupled to a less mobile, or immobile, domain. In such instances the dominant solute transport mechanism during imposed flow in the mobile domain(s) is typically advection; however, solute exchange also occurs in parallel with the immobile domain(s), typically via molecular diffu-sion. Following each interrupted-flow (no-flow) period a de-crease inδD was recorded for all samples, and attributed to the diffusion of D2O from the preferential flow domain(s) into the low-flow, or immobile-flow, domain(s). The shape of the D2O breakthrough curves and the magnitude of the δD decrease following the interrupted-flow periods are dif-ferent for all samples, with a 42.6, 18.5, and 28.4 % decrease recorded for the core samples taken from 5.03, 9.52, and 21.75 m b.g.l., respectively, after the first interrupted-flow pe-riod. In addition, theKvof each sample was recorded as dif-ferent (Fig. 2), with average values of 1.4×10⁻⁸, 3.9×10⁻⁹, and 2.7×10⁻⁹m s−1for the core samples taken from 5.03,
9.52, and 21.75 m b.g.l., respectively. TheKv was recorded to decrease during the initial stages of each centrifugation period, attributed to the partial consolidation of the clay due to the stress applied by the centrifugal force. Following this initial consolidation period a more constantKvas a function of time was recorded for all cores, indicating that relative equilibrium had been achieved between stress applied by the centrifugal force and the compaction state of the core. 3.2 Dual domain model
The close model fits confirm that preferential flow through a dual porosity structure is a plausible hypothesis to explain the shape of the observed breakthrough curves. The uncon-strained (∅m,αandγ) parameters that yielded the best dual domain model output fit to the D2O breakthrough data are displayed in Table 2. It is noted that the pore volume of the mobile domain per total volume of the core,∅m, was mod-elled to be 0.06, 0.04, and 0.08 for core taken from 5.03, 9.52, and 21.75 m b.g.l., respectively. With total porosity,∅, measured as 0.44, 0.47, and 0.43, this equates to 13.6, 8.5, and 18.6 % of the total pore volume, respectively, suggest-ing that preferential flow features comprise a relatively large proportion of the total pore porosity in each sample. Hy-drodynamic dispersivity,α, for best-fit model output for all core samples was Lc/2, which is larger than typically re-ported for laboratory-scale column experiments (e.g. Shukla et al., 2003). It can be noted that all of the core samples were assumed to have remained saturated throughout the breakthrough experiments because all influent and effluent flow rates were recorded at steady state. Whilst dispersion is known to increase substantially as moisture content de-creases from saturation (e.g. Wilson and Gelhar, 1981), it is therefore unlikely that this could have been a factor. The mass transfer coefficient,γ, was also modelled as different for each core sample with 0.65, 1.50, and 1.20 yielding the best model fit for the core samples taken from 5.03, 9.52, and 21.75 m b.g.l., respectively. Using Eq. (10), the half width of the matrix block (using aβ range of 3–15 (3 for paral-lel slabs and 15 for spherical aggregates after Gerke and van Genuchten, 1993)),a, is calculated as within the range of 8.0–17.8, 5.4–12.1, and 5.5–12.3 mm for the core samples taken from 5.03, 9.52, and 21.75 m b.g.l., respectively. This suggests that the preferential flow channels present are likely to be separated by distances in the order of several millime-tres from each other within the cores. With the dimensions of the cores significantly greater than these values, the model output therefore suggests that several preferential flow fea-tures are present in each core sample.
Figure 1. Normalised D2O breakthrough data along with best-fit dual porosity model output for the interrupted-flow experiments conducted using core samples taken from 5.03 m (left), 9.52 m (middle), and 21.75 m b.g.l. (right). The data points represent the concentration averaged over each sampling period and the dashed line for the model output represents the raw model output time series. In the empirical experiment it was therefore not possible to measure the concentration of the effluent during the no-flow phase because there was no effluent to collect for analysis. Thus, due to this averaging, in the rising limb of the breakthrough curve, the first point obtained by measurement during each flow phase can be observed as consistently greater than the “starting concentration” for the raw model output.
Figure 2. Vertical hydraulic conductivity (m s−1), calculated using Eq. (2), for the interrupted-flow experiments conducted using core samples taken from 5.03 m (left), 9.52 m (middle), and 21.75 m b.g.l. (right).
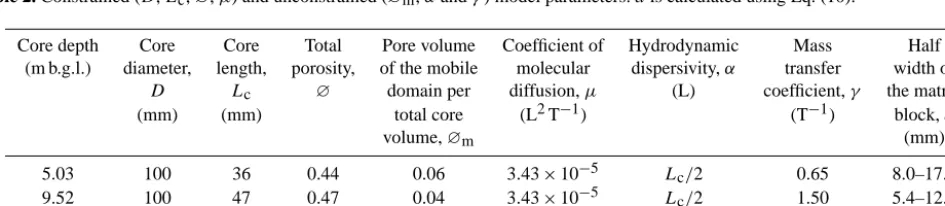
Table 2. Constrained (D,Lc,∅,µ) and unconstrained (∅m,αandγ) model parameters.ais calculated using Eq. (10).
Core depth Core Core Total Pore volume Coefficient of Hydrodynamic Mass Half (m b.g.l.) diameter, length, porosity, of the mobile molecular dispersivity,α transfer width of
D Lc ∅ domain per diffusion,µ (L) coefficient,γ the matrix (mm) (mm) total core (L2T−1) (T−1) block,a
volume,∅m (mm)
5.03 100 36 0.44 0.06 3.43×10⁻⁵ Lc/2 0.65 8.0–17.8 9.52 100 47 0.47 0.04 3.43×10⁻⁵ Lc/2 1.50 5.4–12.1 21.75 100 55 0.43 0.08 3.43×10⁻⁵ Lc/2 1.20 5.5–12.3
0.32, and 0.34 for the base of the core samples taken from 5.03, 9.52, and 21.75 m b.g.l., respectively. With respective average flow rates recorded as 0.017, 0.007, and 0.015 m d−1 this behaviour is not obviously related to the variation in flow rates between the samples but more likely to the
[image:6.612.61.534.526.629.2]Figure 3. Model output for mobile (solid lines) and immobile (dashed lines) domains for core samples taken from 5.03 m (left), 9.52 m
(middle), and 21.75 m b.g.l. (right). The black, dark grey, and light grey lines comprise model output for the base, middle, and top of the cores, respectively.
other after 7.0, 2.6, and 6.1 h during the first no-flow period for the core samples taken from 5.03, 9.52, and 21.75 m b.g.l., respectively.
3.3 Sensitivity analysis
Sensitivity analysis plots for a ±50 % change in uncon-strained parameters (α,γ, and∅m)for the core sample taken from 5.03 m b.g.l. are displayed in Fig. 4, with corresponding NSMEC data displayed in Table 3. The model fitting effi-ciency is relatively insensitive to all three unconstrained pa-rameters in the range tested, with a less than 12 % change in the NSMEC compared to the NSMEC recorded for the best fit (Table 3). Sensitivity for the estimated percentage error associated with constrained parameters (∅, Lc, andµ) are displayed in Fig. 5, with corresponding NSMEC data dis-played in Table 3. The model fitting efficiency is also rela-tively insensitive, with a less than 1 % change in the NSMEC compared to the NSMEC recorded for the best fit (Table 3). For the data presented, the relatively low sensitivity to the pa-rameters indicates that further testing, such as by dye tracing or geophysical tomography, is necessary to resolve more pre-cisely the nature of the preferential flow paths. Nevertheless, the modelling has supported the preferential flow conceptual model we have used to explain the step changes in concen-tration observed after resting periods. It has also provided a first-order approximation of the likely geometry of the flow paths.
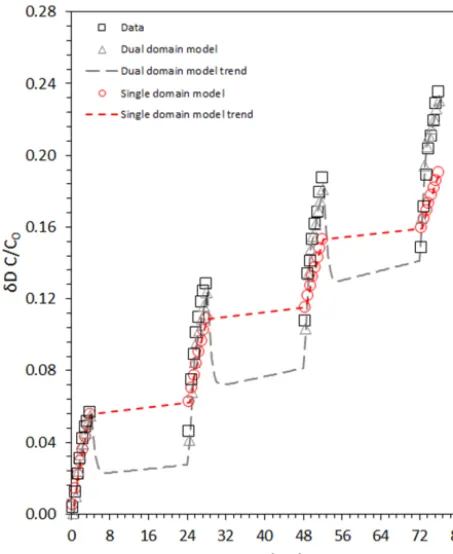
3.4 Comparison of dual and single domain modelling In order to further demonstrate the practicality of the interrupted-flow methodology, a numerical experiment was carried out using the dual domain model developed above. Using the best-fit parameters from the core from 9.52 m b.g.l., an equivalent simulation to the laboratory ex-periment described above was run but without
interrupted-flow phases. The breakthrough curve produced was then fit to the Ogata–Banks equation (Ogata and Banks, 1961) on the assumption that flow was occurring only through a single do-main. The resulting fit was good (NRMSE=3 %) with just one fitting parameter being the dispersion term which yielded a reasonable value of 1.27×10⁻⁸m2s−1. This illustrates that, without the use of interrupted-flow phases to reveal the dis-equilibrium between two or more flow domains, a false as-sumption could easily be made with regard to the structure and associated transport properties of the core on the basis of a simple 1-D analytical model. This could have very sig-nificant consequences for the prediction and management of solute migration through such deposits.
Figure 4. Sensitivity of the dual domain model for the core sample taken from 5.03 m b.g.l. due to±50 % change in unconstrained parameters: ∅m(LHS),γ (middle), andα(RHS).
Figure 5. Sensitivity of the dual domain model for the core sample taken from 5.03 m b.g.l. for the calculated error associated with the
constrained parameters:∅(LHS);Lc(middle), andµ(RHS).
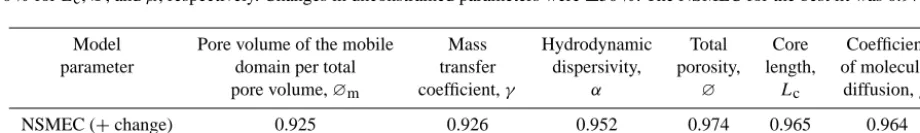
Table 3. NSMEC for the core sample taken from 5.03 m b.g.l. due to changes in constrained (Lc,∅,µ) and unconstrained (∅m,αandγ) model parameters. Changes in constrained parameters comprised the estimated percentage error per each parameter, which was 2.78, 2.79, and 50 % forLc,∅, andµ, respectively. Changes in unconstrained parameters were±50 %. The NSMEC for the best fit was 0.972.
Model Pore volume of the mobile Mass Hydrodynamic Total Core Coefficient parameter domain per total transfer dispersivity, porosity, length, of molecular
pore volume,∅m coefficient,γ α ∅ Lc diffusion,µ
NSMEC (+change) 0.925 0.926 0.952 0.974 0.965 0.964 NSMEC (−change) 0.952 0.862 0.964 0.968 0.971 0.975
increase during resting phases as would be expected in a sin-gle domain model due to redistribution of the solute along the core by diffusion. This additional numerical experiment thus strengthens the conclusions of the study, which are that dual domain behaviour is indicated by our interrupted-flow experiment observations, and that single domain models are inappropriate as a means of analysis.
4 Conclusions and outlook
[image:8.612.67.527.517.583.2]Figure 6. Comparison of single and dual domain
interrupted-flow transport model best-fit simulations for the core taken from 9.52 m b.g.l.
transfer processes in low permeability dual porosity materi-als. Dual domain transport modelling was used to validate the hypothesis that the step changes in tracer concentrations observed during no-flow periods could be explained by the presence of dual porosity in the samples. The modelling also enabled a first-order approximation of the physical proper-ties of the two domains to be inferred. Smectite clay core samples were used (101.6 mm in diameter) as an example lowKdual porosity media; however, it is anticipated that the methodology would also be suitable for the characterisation of any dual porosity material where mass transfer occurs via both advection and diffusion (e.g. fractured rock, heteroge-neous soils, mine tailings). The methodology entails a min-imum of three phases: induced flow, no flow, and induced flow; however, this may be repeated several times in order to most effectively characterise the multi-rate mass transfer behaviour. In addition, it is necessary to tailor the induced-flow rate, interrupted-induced-flow timescales and nonreactive tracer concentrations in order to most effectively identify different mass transfer processes whilst also simulating realistic total stress conditions. Future work will seek to further investi-gate the structure of the clay samples studied using quantita-tive tomography techniques (e.g. X-ray computed tomogra-phy and magnetic resonance imaging) and how these tomogra- physi-cal features can be integrated into site-sphysi-cale numeriphysi-cal flow modelling.
Acknowledgements. The authors would like to thank Dayna
McGeeney (School of Civil and Environmental Engineering) and Mark Whelan (School of Mining Engineering) from the Connected Waters Initiative Research Centre, UNSW, Australia, for their technical support. The work was financially supported by Program 1B of the National Centre for Groundwater Research and Training, supported by the Australian Research Council and the National Water Commission, and the Gary Johnson Trust. Mark Cuthbert was financially supported by the European Community’s Seventh Framework Programme (FP7/2007–2013) under grant agreement no. 299091.
Edited by: M. Giudici
References
ASTM: Standard test method for determining unsaturated andsatu-rated hydraulic conductivity in porous media by steady-state cen-trifugation, ASTM D6527, West Conshohoken, PA, 2000. ASTM: Standard practice for thin-walled tube sampling of soils for
geotechnical purposes, ASTM D1587-08(2012)e1, West Con-shohocken, PA, 2012.
Barnes, C. J. and Allison, G. B.: Tracing of water movement in the unsaturated zone using stable isotopes of hydrogen and oxygen, J. Hydrol., 100, 143–176, 1988.
Bashar, K. and Tellam, J. H.: Non-reactive solute movement through saturated laboratory samples of undisturbed stratified sandstone, Geological Society, London, Special Publications, 263, 233–251, 2006.
Bear, J. and Bachmat, Y.: Introduction to modeling of transport phe-nomena in porous media. Springer Science & Business Media, 1990.
Beven, K. and Germann, P.: Macropores and water flow in soils, Water Resour. Res., 18, 1311–1325, 1982.
Brusseau, M. L., Rao, P. S. C., Jessup, R. E., and Davidson, J. M.: Flow interruption: a method for investigating sorption nonequi-librium, J. Contam. Hydrol., 4, 223–240, 1989.
Brusseau, M. L., Hu, Q., and Srivastavaa, R.: Using flow interrup-tion to identify factors causing nonideal contaminant transport, J. Contam. Hydrol., 24, 205–219, 1997.
Buczko, U., Hopp, L., Berger, W., Durner, W., Peiffer, S., and Schei-thauer, M.: Simulation of chromium transport in the unsaturated zone for predicting contaminant entries into the groundwater, J. Plant Nutr. Soil Sc., 167, 284–292, 2004.
Coats, K. H. and Smith, B. D.: Dead-end pore volume and disper-sion in porous media, Soc. Petrol. Eng. J., 4, 73–84, 1964. Cote, C. M., Bristow, K. L., and Ross, P. J.: Quantifying the
influ-ence of intra-aggregate concentration gradients on solute trans-port, Soil Sci. Soc. Am. J., 63, 757–767, 1999.
Cote, C. M., Bristow, K. L., and Ross, P. J.: Increasing the efficiency of solute leaching: impacts of flow interruption with drainage of the “preferential flow paths”, J. Contam. Hydrol., 43, 191–209, 2000.
Cuthbert, M. O., Mackay, R., Tellam, J. H., and Thatcher, K. E.: Combining unsaturated and saturated hydraulic observations to understand and estimate groundwater recharge through glacial till, J. Hydrol., 391, 263–276, 2010.
Cuthbert, M. O., Mackay, R., and Nimmo, J. R.: Linking soil moisture balance and source-responsive models to estimate dif-fuse and preferential components of groundwater recharge, Hy-drol. Earth Syst. Sci., 17, 1003–1019, doi:10.5194/hess-17-1003-2013, 2013.
Flury, M., Fluhler, H., Jury, W. A., and Leuenberger, J.: Suscepti-bility of soils to preferential flow of water: afield study, Water Resour. Res., 30, 1945–1954, 1994.
Gerke, H. H. and van Genuchten, M. T.: Evaluation of a first-order water transfer term for variably saturated dual-porosity flow models, Water Resour. Res., 29, 1225–1238, 1993. Gong, R., Lu, C., Wu, W.-M., Cheng, H., Gu, B., Watson, D. B.,
Criddle, C. S., Kitanidis, P. K., Brooks, S. C., Jardine, P. M., and Luo, J.: Estimating kinetic mass transfer by resting-period mea-surements in flow-interruption tracer tests, J. Contam. Hydrol., 117, 37–45, 2010.
Guimont, S., Perrin-ganier, C., Real, B., and Schiavon, M.: Effects of soil moisture and treatment volume on bentazon mobility in soil, Agron. Sustain. Dev., 25, 323–329, 2005.
Hensley, P. J. and Schofield, A. N.: Accelerated physical modelling of hazardous-waste transport, Geotechnique, 41, 447–465, 1991. Koch, S. and Fluhler, H.: Non-reactive solute transport with micro-pore diffusion in aggregated porous media determined by a flow-interruption method, J. Contam. Hydrol., 14, 39–54, 1993. Ma, L. and Selim, H. M.: Solute transport in soils under conditions
of variable flow velocities, Water Resour. Res., 32, 3277–3283, 1996.
Murali, V. and Aylmore, L. A. G.: No-flow equilibrium and adsorp-tion dynamics during ionic transport in soils, Nature, 283, 467– 452, 1980.
Nash, J. E. and Sutcliffe, J. V.: River flow forecasting through con-ceptual models Part I – A discussion of principles, J. Hydrol., 10, 282–290, 1970.
Nimmo, J. R. and Mello, K. A.: Centrifugal techniques for mea-suring saturated hydraulic conductivity, Water Resour. Res., 27, 1263–1269, 1991.
Ogata, A. and Banks, R. B.: A solution of the differential equa-tion of longitudinal dispersion in porous media. Fluid Movement in Earth Materials, Geological Survey Professional Paper., 411-A, available at: http://pubs.usgs.gov/pp/0411a/report.pdf, last ac-cess: 8 September 2015, 1961.
Orr, W. J. C. and Butler, J. A. V.: The rate of diffusion of deuterium hydroxide in water, J. Chem. Soc., 303, 1273–1277, 1935.
Reedy, O. C., Jardine, P. M., Wilson, G. V., and Selim, H. M.: Quantifying the diffusive mass transfer of nonreactive solutes in columns of fractured saprolite using flow interruption, Soil Sci. Soc. Am. J., 60, 1376–1384, 1996.
Shukla, M. K., Lal, R., Owens, L. B., and Unkefer, P.: Land use and management impacts on structure and infiltration characteristics of soils in the North Appalachian region of Ohio, Soil Sci., 168, 167–177, 2003.
Sundaram, B., Feitz, A., de Caritat, P., Plazinska, A., Brodie, R., Coram, J., and Ransley, T.: Groundwater Sampling and Analysis – A Field Guide, Geoscience Australia, Canberra, Record 2009/27 95, 2009.
Timms, W. and Hendry, M.: Long-term reactive solute transport in an aquitard using a centrifuge model, Ground Water, 46, 616– 628, 2008.
Timms, W., Hendry, M. J., Muise, J., and Kerrich, R.: Coupling cen-trifuge modeling and laser ablation inductively coupled plasma mass spectrometry to determine contaminant retardation in clays, Environ. Sci. Technol., 43, 1153–1159, 2009.
Timms, W. A., Crane, R., Anderson, D. J., Bouzalakos, S., Whe-lan, M., McGeeney, D., Rahman, P. F., Guinea, A., and Acworth, R. I.: Vertical hydraulic conductivity of a clayey-silt aquitard: ac-celerated fluid flow in a centrifuge permeameter compared with in situ conditions, Hydrol. Earth Syst. Sci. Discuss., 11, 3155– 3212, doi:10.5194/hessd-11-3155-2014, 2014.
Totsche, K. U., Jann, S., and Kogel-Knabner, I.: Release of poly-cyclic aromatic hydrocarbons, dissolved organic carbon, and sus-pended matter from disturbed NAPL-contaminated gravelly soil material, Vadose Zone J., 5, 469–479, 2006.
Wehrer, M. and Totsche, K. U.: Detection of non-equilibrium con-taminant release in soil columns: delineation of experimental conditions by numerical simulations, J. Plant Nutr. Soil Sc., 116, 475–483, 2003.
Wehrer, M. and Totsche, K. U.: Determination of effective release rates of polycyclic aromatic hydrocarbons and dissolved organic carbon by column outflow experiments, Eur. J. Soil Sci., 56, 803– 813, 2005.
Wehrer, M. and Totsche, K. U.: Difference in PAH release processes from tar-oil contaminated soil materials with similar contamina-tion history, Chem. Erde-Geochem., 69, 109–124, 2009. Wilson, J. L. and Gelhar, L. W.: Analysis of longitudinal