III. RESEARCH METHODOLOGY
A. Research Design
It is clear that this research was a quantitative research. Quantitative research is associated with
social survey technique like structured interviewing and self-administered questionnaires,
experiments, structured observation, content analysis, and the analysis of official statistics. It
implies the application of measurement of predetermined variables, as well as to the gathering
and analysis of numerical data.
This research was intended to investigate whether there is correlation of language learning
strategies and students’ motivation towards their achievement in reading comprehension. The
research was conducted by using descriptive survey method. Winarno Surakhmad (1985: 139 in
Uniroh, 1990: 27) states that descriptive survey method is a method which simply analyze,
classify, and reveal an investigation by using some techniques such as interview, questionnaires,
observation or by using test technique, case study, and comparative study. It can happen that
descriptive research tries to compare the similarities and the differences of a certain phenomenon
or to measure a dimension like in quantitative study (questionnaire, test, interview, etc.) or to
make classification, determine correlation one element to another.
In this research, the researcher analyzed the current data that were taken from students’ language
learning strategies and students’ motivation in learning English and their reading comprehension
achievement. The data, then, were correlated to find out the correlation each other. The design
of the research was presented as below:
X1
Y
X2
Where:
X1 : Students’ Motivation
X2 : Language Learning Strategies
Y : Students’ Reading Comprehension Achievement
B. Variables
In this research, the researcher identified two variables: independent and dependent variables.
Independent variable is the major variable which I investigated. It is the variable which was
selected, manipulated, and measured by me as the researcher. Dependent variable, on the other
hand, is the variable which I observed and measured in determining the effect of the independent
variable. It is a product from interaction of all variables that involve in a research (Setiyadi:
2006). From the explanation, the researcher determined the variables as follow:
1. Motivation and language learning strategies as independent variables because it is
assumed that motivation and language learning strategies influence students’
achievement.
2. Students’ reading comprehension achievement as a dependent variable because it is
assumed that achievement is affected by students’ motivation and the use of language
C. Population and Sample
1. Population
The population of this research was the second grade students of SMA Negeri 1 Bandar
Lampung in academic year 2010/2011.
2. Sample
In conducting this research, the researcher used simple random probability sampling. From
all the classes of second grade students, the researcher chose 3 classes randomly.
D. Data Collecting Technique
In collecting the data, the researcher used two techniques: questionnaires and written test of
reading.
1. Questionnaires, it is a list of questions and statements to be answered by the students
used to measure the students’ motivation and language learning strategies used in
learning English.
2. Test, it is a set of questions and problems in form of objective test used to measure the
students’ reading comprehension achievement.
The questionnaires were held in two ways namely: motivation and the use of strategies. There
were 70 questions to be answered in these questionnaires. The time to answer these 70 questions
was just 60 minutes. It means that every item in the questionnaire had to be answered less than 1
minute. This was done to make the students think fast of the questions and answer it honestly.
The questionnaire is often used by the researcher to measure the students’ motivation. By
using this technique, the researcher wanted to get more sources of the data from the
subjects. The researcher gave a set of questionnaires in order to investigate the students’
motivation in learning English. The questionnaires instrument consists of 40 items. The
questionnaires measure the students’ motivation in learning English. The score are based
on the Likert Scale and the range of 1 to 4s.
NO ITEMS
STUDENTS’ SCORE
a b c d
1 1, 3, 7 (a) 4 3 2 1
2
2, 4, 5, 6, 8, 9, 10, 11, 12, 13,
14, 15, 16, 17, 18, 19, 20, 21,
22, 23, 24, 25, 26, 27, 28, 29,
30, 31, 32, 33, 34, 35, 36, 37,
38, 39, 40.
[image:4.612.99.459.274.518.2]4 3 2 1
Table 1. Students’ Score of Questionnaire of Motivation
Each alternative was defined as follows:
A = 4; for high motivated students.
B = 3; for high motivated students.
C = 2; for low motivated students.
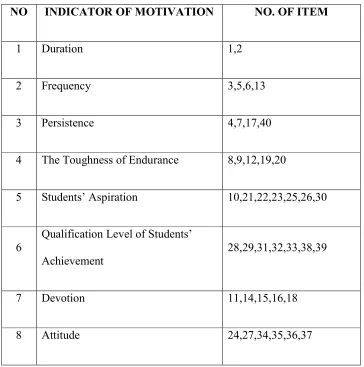
In addition to the indicator of motivation in learning, the researcher takes the indicators
from Abin Samsudin Makmun (1983: 33-34) in Uniroh (1990: 32) who categorized
motivation in eight factors:
NO INDICATOR OF MOTIVATION NO. OF ITEM
1 Duration 1,2
2 Frequency 3,5,6,13
3 Persistence 4,7,17,40
4 The Toughness of Endurance 8,9,12,19,20
5 Students’ Aspiration 10,21,22,23,25,26,30
6
Qualification Level of Students’
Achievement
28,29,31,32,33,38,39
7 Devotion 11,14,15,16,18
[image:5.612.96.460.192.559.2]8 Attitude 24,27,34,35,36,37
Table 2. Indicators of Motivation
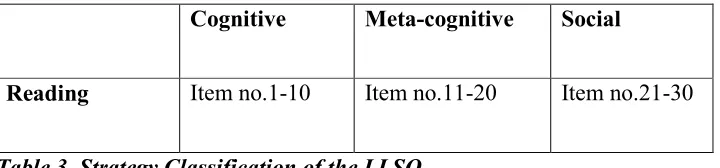
2. Questionnaires of the Use of Strategies
On the use of strategies, the researcher also used questionnaires; it is called Language
Learning Strategies Questionnaires (LLSQ) (Setiyadi, 2006: 76) because the researcher
wanted to know their learning strategies in learning English. The language learning
Cognitive Meta-cognitive Social
[image:6.612.100.460.104.188.2]Reading Item no.1-10 Item no.11-20 Item no.21-30
Table 3. Strategy Classification of the LLSQ
The researcher gave a set of questionnaires consist of 30 items based on the indicators:
meta-cognitive, cognitive, and social. Each item was designed to measure the three
strategies. The students were expected to give their answer based on their feeling and
experience.
3. Written Test of Reading
This test was held to measure the students’ achievement in learning English. This step was
conducted to know the students’ mastery of English subject, especially in reading
comprehension. There were 40 questions in form of multiple choices. The alternatives
provided include a, b, c, and d. The correct answer was scored 1 and the wrong answer
was scored 0. The time to do the test was 45 minutes.
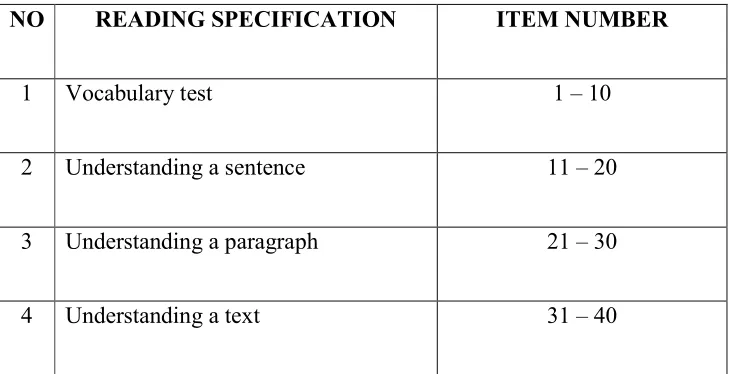
Since reading skill includes mastering many aspects of language skill and performance
such as vocabulary, structure, etc., the researcher in constructing the reading test divided
the test into some parts:
1) Vocabulary test; it contains understanding noun cluster (compound words). This part
becomes common problem for most students in reading; understanding words in
context, that is asking the meaning of the underlined words in a sentence.
2) Understanding a sentence; it is used to test the students’ ability in understanding central
The number of correct answer
3) Understanding a paragraph; the text consists of one paragraph only. It is used to test the
students’ ability in understanding central idea of the paragraph.
4) Understanding a text; the text consists of more than one paragraph. This is the main
aim of reading test.
NO READING SPECIFICATION ITEM NUMBER
1 Vocabulary test 1 – 10
2 Understanding a sentence 11 – 20
3 Understanding a paragraph 21 – 30
[image:7.612.93.458.221.408.2]4 Understanding a text 31 – 40
Table 4. Reading Specification
In scoring system students’ result of the test, the researcher used Arikunto’s formula as
follow:
Score = x 100
E. Research Procedure
There were ten steps in this research:
Determining the problem
Observation
Determining the research focus
Formulating the questionnaires
Determining the way of collecting and analyzing the data
Preparing the data collecting technique
Collecting the data
Conducting English test
Evaluating and analyzing the data, and
Making report of the findings.
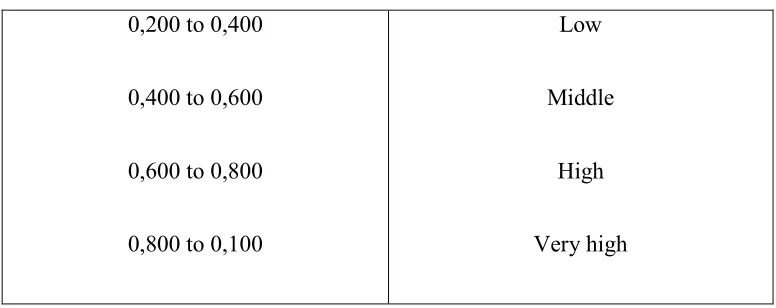
F. Data Analysis
To see the correlation of students’ motivation and language learning strategies and their
achievement, the data was analyzed by using Pearson product-moment correlation coefficient.
[image:8.612.66.458.637.714.2]To see the product moment correlation, we have to see “the coefficient” of its relation (r = 1) (see
Table 4. r-Value Interpretation Table) and the significant value (p < 0,01) by using this formula:
rXY =
∑ (∑ )(∑ )
{ ∑ (∑ )}{( ∑ (∑ ) }
r value Interpretation
0,200 to 0,400
0,400 to 0,600
0,600 to 0,800
0,800 to 0,100
Low
Middle
High
[image:9.612.69.457.101.255.2]Very high
Table 5. r-Value Interpretation Table
(Setiyadi, 2006: 167)
In addition to reading comprehension test analysis, the researcher also calculates the degree of
discrimination (discriminating power) by using the formula:
DP =
Notes: DP = Discrimination Power
U = the proportion of the upper group students
L = the proportion of the lower group students
N = number of students
The criteria are:
1). If the value is positive discrimination, it means that more high level students than low-level
2). If the value is negative, means that more low level students than the high level students get
the item correct.
3). In general, the higher the discrimination, the better. In the classroom situation most items
should be higher than 0.20 indexes (Shohamy, 1985: 81).
This is done to find out whether the test (reading comprehension test) can be used as instrument
of the research. And by this, the researcher can also improve bad items.
G. Reliability
1. Reliability of the Questionnaires
Reliability analysis was performed to see the internal consistency reliability of the
components using the Cronbach's alpha coefficient in which thes alpha ranges between 0 to 1.
The higher the alpha, the more reliable is the questionnaire (Setiyadi, 2006: 190-191).
2. Reliability of the Test
To find the reliability of the test, the split-half method is used; that is by dividing the number
of the test items into two group: odd and even. The formula is:
r1 =
∑
∑ ∑
Notes: r1 = coefficientor reliability between first and second half group
X = total numbers of first half group
Y = total numbers of second half group
Y2 = square of Y
And after being correlated, the researcher will continue the calculation by using formula of
Spearman Brown (Hatch and Farhady, 1982: 268):
rk =
Notes: rk = the reliability of the test.
rl = the reliability of the half test.
The criteria of reliability:
0.90 – 1.00 = high
0.50 – 0.89 = moderate
0.00 – 0.49 = low
H. Validity
1. Content Validity
Content validity is the extent to which a test measures a representative sample of the subject
matter content. The focus of content validity is on the adequacy of the sample and not simply
on the appearance of a test. To assure ourselves f content validity of a test, the content of the
test must be carefully defined, and then the test items should correspond to the materials
covered in the course.
Construct validity is concerned with how well the test represents the subject matter content of
behaviors to be tested. The procedure for determining content validity is to compare the test