http://dx.doi.org/10.4236/jsea.2015.86028
Impact of Modification Made in Re-UCP on
Software Effort Estimation
Mudasir Manzoor Kirmani, Abdul Wahid
School of CS & IT, MANUU, Hyderabad, IndiaEmail: [email protected], [email protected]
Received 17 April 2015; accepted 5 June 2015; published 8 June 2015
Copyright © 2015 by authors and Scientific Research Publishing Inc.
This work is licensed under the Creative Commons Attribution International License (CC BY). http://creativecommons.org/licenses/by/4.0/
Abstract
This research work evaluates the performance of Re-UCP model and compares the results with the UCP and e-UCP method of software effort estimation. In this research work, an attempt has been made to highlight the accuracy of results by using MRE (Magnitude of Relative Error), MMRE (Mean Magnitude Relative Error), MdMRE (Median of Magnitude Relative Error) tools to check the error rate and PRED (20) and PRED (10) method to find out the predictability of accuracy of Re- UCP software effort estimation method. The observations made from the results are based on the comparison of Re-UCP, e-UCP and UCP models of software effort estimation.
Keywords
Re-UCP, e-UCP, UCP, Software Engineering, Empirical Software Engineering, Software Project Management
1. Introduction
work is an effort to validate revised use-case point model by using 14 software projects in order to estimate ef-forts which can show improved inclination in its behaviour and higher degree of acceptance with adaptability to improve the significance of its worth.
This research work is an effort to evaluate the results of the proposes effort estimation model inspired from the fundamentals of UCP, iUCP and e-UCP in order to estimate efforts which can show improved inclination in its behaviour and higher degree of acceptance with adaptability to improve the significance of its worth. The re-sults of the newly designed model named as Re-UCP after comparing with the existing UCP and e-UCP are va-lidated using MRE (Magnitude of Relative Error), MMRE (Mean Magnitude Relative Error) [13]-[15] and by measuring predictability using PRED (20) and PRED (10).
2. Use Case Points Method
The UCP method is the extension of Function Point method with the benefit of requirement analysis in the ob-ject-oriented process. It starts with measuring the functionality of the system based on the use case model in a count called Unadjusted Use Case Point (UUCP). The same technical factors are used as of Function Points. The UCPs shows an estimation of the size of the system which can be further mapped to man hours in order to cal-culate the effort required to develop a system [16] [17]. Actors and use cases are classified into simple, Average and Complex categories according to their complexity and assigned some weight factors.
The unadjusted use case point UUCP is calculated using the following equation: UUCP=UAW+UUCW
where UAW is unadjusted actor weight and UUCW is unadjusted use-case weight. Finally the use case points UCP are calculated using the following equation:
UCP=UUCP TCF EF∗ ∗
where UUCP is unadjusted use case point, TCF is technical complexity factor and EF is environmental com-plexity factor.
The number of parameters in TCF technical complexity factor is 14 and EF environmental complexity factor used in UCP method is 8 [3].
Further the effort is estimated by mapping the UCP with man-hours.
Effort=UCP PHper UCP∗
where PHper UCP is Person Hours per UCP.
3. Extended Use Case Point Method (e-UCP)
The extended use case point method (e-UCP) is a revised version of UCP method and was proposed by Kasi Pe-rivasamy and Aditi Ghade in 2009 [14]. The e-UCP model considers some additional information about the re-lationships between actors and use cases. The e-UCP is focused on internal details of a use case by including the use case narrative in effort estimation process of a software development project in the early stages of develop-ment. It starts with measuring the functionality of the system based on the use case model in a count called Un-adjusted Use Case Point (UUCP). The technical factors and environmental factors used were similar as used in UCP method of effort estimation. The e-UCPs shows an estimation of the size of the system which can further be mapped to man-hours in order to calculate the effort required to develop the system [18]-[20].
The value of unadjusted use case points UUCP is calculated using the following equation:
UUCP=Use Case Weight Actor Weight+ +Narratives Weight.
Finally the extended use case points e-UCP are calculated using the following equation:
e-UCP=UUCP TCF EF∗ ∗
where UUCP is unadjusted use case point, TCF is technical complexity factor and EF is environmental com-plexity factor.
The number of parameters in TCF technical complexity factor is 14 and EF environmental complexity factor used in e-UCP method is 8.
Effort=e-UCP PHper UCP∗
where PHper UCP is Person Hours per UCP.
In the UCP model of effort estimation actors were classified in 3 categories and in e-UCP actors were classi-fied into 7 categories. The use-case classification in case of UCP was 3 while as in e-UCP the categorization of use-cases was 4. The e-UCP model of effort estimation included the use-case narrative which did not exist in UCP effort estimation method.
4. Revised Use Case Point Method (Re-UCP)
In Re-UCP model [4] the functionality of the system is measured by calculating all the use case points in the system. The functionality of the system is estimated by the collective impact of corresponding factors associated with actors of the system, behaviour of use case, impact of environment and role of technical complexity factors for a software project.
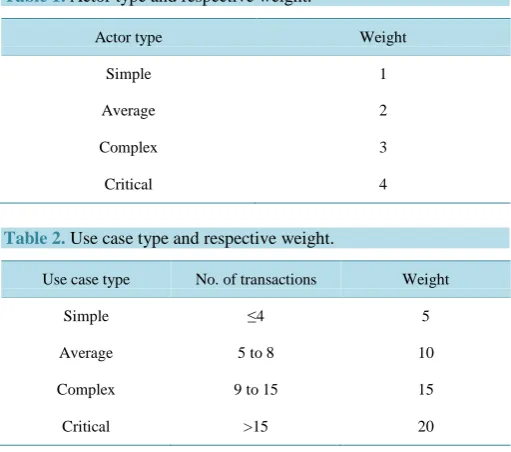
In Re-UCP actors, use-cases, environmental and other technical factors are further categorised to associate a particular impact factor on the specific use-case activity rather than functionality of the system. Unlike UCP or e-UCP wherein either actor or use case is divided into simple, average, or complex with some weight strategy, Re-UCP uses different categorization of actor and use-cases [4]. Actors in Re-UCP are categorised into simple, average, complex and critical categories with weight 1, 2, 3 and 4 respectively. The categorization of actors along with their corresponding weight is given inTable 1.
Total Unadjusted Actor weight UAW is calculated using the following equation:
(
)
UAW= Σ No. of actors their respective weight factors .∗
The use-cases are also categorized into simple, average, complex and critical categories and the detailed de-scription of use-cases with their corresponding weighting factor [4] is given inTable 2.
Total Unadjusted use-case weight UUCW is calculated using the following equation:
(
)
UUCW= Σ No. of Use cases their respective weight factors .∗
The values of UAW and UUCW are used to calculate Unadjusted Use Case Points UUCP using the following equation:
[image:3.595.185.441.495.721.2]UUCP=UAW+UUCW. The revised use case points are calculated as
Table 1. Actor type and respective weight.
Actor type Weight
Simple 1
Average 2
Complex 3
Critical 4
Table 2. Use case type and respective weight.
Use case type No. of transactions Weight
Simple ≤4 5
Average 5 to 8 10
Complex 9 to 15 15
Re-UCP=UUCP TCF ECF∗ ∗ where TCF—Technical Complexity Factor;
ECF—Environmental Complexity Factor.
In order to estimate the overall use case points of the system to be developed some other factors like envi-ronmental and technical complexity parameters need to be considered. The technical complexity factor is represented as TCF and environmental complexity factor as ECF. All the technical factors from T1 to T14 are multiplied by their corresponding weight factor as described in theTable 3 and the summation of all calculated values is the calculated value of technical complexity factor (TCF).
TF subsequently is used to obtain the value of the Technical Complexity Factor (TCF).
(
14)
i 1 TCF=0.6+ 0.01∗
∑
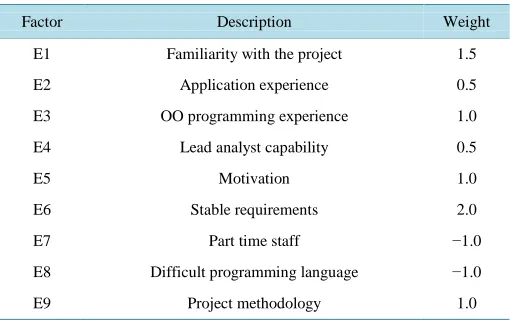
= TFi [image:4.595.187.441.291.531.2]All the environmental complexity factors from E1 to E9 are multiplied by their corresponding weight factor as described in theTable 4 and the summation of all calculated values is the value of environmental complexity factor (ECF).
Table 3. Technical complexity factor and weight.
Factor Description Weight
T1 Distributed system 2
T2 Response or throughput performance objectives 1
T3 End-user efficiency (online) 1
T4 Complex internal processing 1
T5 Code must be reusable 1
T6 Easy to install 0.5
T7 Easy to use 0.5
T8 Portable 2
T9 Easy to change 1
T10 Concurrent 1
T11 Includes special security features 1
T12 Provides direct access for third parties 1
T13 Special user training facilities are required 1
T14 Scalability 2
Table 4. Environmental complexity factor and weight.
Factor Description Weight
E1 Familiarity with the project 1.5
E2 Application experience 0.5
E3 OO programming experience 1.0
E4 Lead analyst capability 0.5
E5 Motivation 1.0
E6 Stable requirements 2.0
E7 Part time staff −1.0
E8 Difficult programming language −1.0
[image:4.595.186.441.556.716.2]EF value is used to obtain the Environmental Complexity Factor (ECF).
(
9)
i 1 ECF 1.4= + −0.03∗
∑
=EFiThe total number of the revised use case points is calculated by multiplying UUCP, TCF and ECF Re-UCP=UUCP TCF ECF∗ ∗
Effort=UCP PHper UCP∗
where PHper UCP is Person Hours per UCP.
5. Results and Discussion
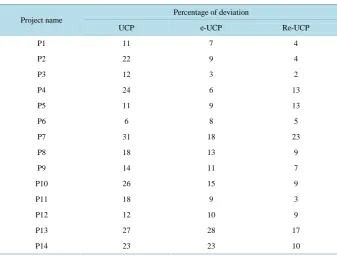
The percentage of deviation is calculated by subtracting actual effort from estimated effort and the result is the deviation which can be positive or negative. Positive deviation explains that the estimated effort is greater than actual effort whereas negative deviation explains that the estimated effort is lesser than actual effort. The data-related to percentage of deviation of estimated efforts from actual efforts in case of UCP, e-UCP and Re-UCP methods of software effort estimation is given inTable 5.
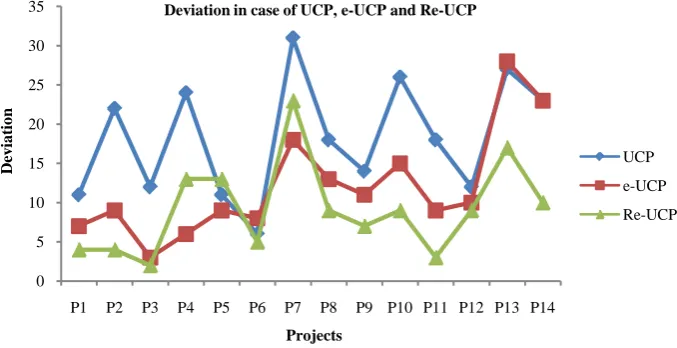
The graphical representation of the percentage of deviation using UCP, e-UCP and Re-UCP methods against the actual effort estimation is given inFigure 1. The projects P4, P5 and P7 have higher value for deviation than e-UCP but better than UCP. However, the deviation from the accurate estimate has shown improvements in case of Re-UCP method of software effort estimation proposed. The projects P1, P2, P3, P6 and P8 through P14 have performed better in comparison with the UCP and e-UCP method of effort estimation. In most of the cases across all projects from P1 to P14 there is lesser deviation either positive or negative calculated using Re-UCP software effort estimation methods when compared to UCP and e-UCP method of effort estimation.
5.1. Impact of Scalability on Technical Complexity Factor
[image:5.595.144.482.463.720.2]The impact of “Scalability” as a new parameter in technical complexity factor was evaluated based on the com-parison between the TCF value calculated with scalability as 14th parameter and TCF value calculated by ex-cluding scalability parameter from TCF. The result of the comparison is given in Figure 2. The TCF value
Table 5. Percentage of deviation from actual estimated efforts for UCP, e-UCP and Re-UCP methods.
Project name Percentage of deviation
UCP e-UCP Re-UCP
P1 11 7 4
P2 22 9 4
P3 12 3 2
P4 24 6 13
P5 11 9 13
P6 6 8 5
P7 31 18 23
P8 18 13 9
P9 14 11 7
P10 26 15 9
P11 18 9 3
P12 12 10 9
P13 27 28 17
Figure 1. Actual efforts and deviations using UCP, e-UCP and Re-UCP.
Figure 2.Impact of scalability on TCF.
calculated using scalability as one of the parameter is higher than the TCF value calculated by excluding scala-bility parameter.
The “Revised use case points Re-UCP” calculated using the proposed method with inclusion of scalability was higher than the value of Re-UCP calculated by excluding scalability parameter. The resultant of the com-parison is given inFigure 3. The higher value of Re-UCP here signifies that if scalability has more importance in a software development process then extra efforts will be required for the software development process which will be able to handle increased workload by repeatedly applying a cost-effective strategy for extending a system’s capacity.
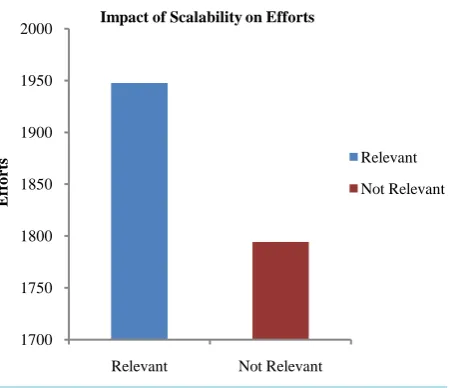
The “Efforts” calculated using TCF value which included scalability parameter was compared with the efforts calculated using TCF value which did not include scalability parameter and the result of the same is given in Figure 4. This implies if the scalability is of top priority and needs to be implemented while developing the software project then the efforts required for completion of the software development process will incur more cost. However, if the scalability of the software to be developed is not of any concern then the efforts required to develop the software will be lesser in comparison with the need for scalability.
5.2. Impact of Project-Methodology on ECF
The impact of project-methodology as a new parameter in environmental complexity factor was evaluated by comparing the ECF value calculated with project-methodology as 09th parameter with ECF value calculated by
0 5 10 15 20 25 30 35
P1 P2 P3 P4 P5 P6 P7 P8 P9 P10 P11 P12 P13 P14
D
ev
ia
tio
n
Projects
Deviation in case of UCP, e-UCP and Re-UCP
UCP
e-UCP
Re-UCP
1.12 1.14 1.16 1.18 1.2 1.22 1.24 1.26 1.28
Relevant Not Relevant
T
C
F
v
a
lu
es
Impact of Scalability on TCF
Figure 3. Impact of scalability on Re-UCP.
Figure 4. Impact of scalability on efforts.
excluding project-methodology parameter from ECF. The result of the comparison is given in Figure 5. The ECF value calculated using project-methodology as one of the parameter was lesser than the ECF value calcu-lated by excluding project-methodology parameter.
The revised use case points Re-UCP calculated using the proposed method with inclusion of project-metho- dology was lower than the value of Re-UCP calculated by excluding project-methodology parameter. The resul-tant of the comparison is given inFigure 6.
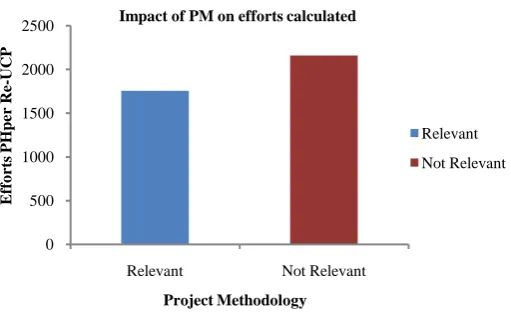
The “Efforts” calculated using ECF value which included project-methodology parameter was compared with the efforts calculated using ECF value which did not include project-methodology parameter and the result of the same is given inFigure 7. This implies if the project-methodology selected for the development of a soft-ware project is an appropriate approach then the efforts required will be lesser. However, if the project-metho- dology selected for the development of a software project is not an appropriate then the efforts required for the development of the software project will be higher. Therefore, it is very important to select project-methodology which is optimal for the software development project in order to manage software projects effectively and effi-ciently.
In project P1 and P3 the estimated effort is greater than the efforts obtained by either of the three effort esti-mation methods. In projects P2, P6 to P14 the estimated effort is less than the efforts acquired by either of these specified methods. Among the fourteen projects the efforts obtained in nine projects by Re-UCP is less than the
84 86 88 90 92 94 96 98
Relevant Not Relevant
Re
-UCP
p
o
in
ts
Impact of Scalability on Re-UCP
Relevant
Not Relevant
1700 1750 1800 1850 1900 1950 2000
Relevant Not Relevant
E
ffo
rt
s
Impact of Scalability on Efforts
Relevant
Figure 5. Impact of project-methodology on ECF.
[image:8.595.187.443.442.603.2]Figure 6. Impact of project-methodology on Re-UCP.
Figure 7. Impact of project-methodology on efforts.
efforts estimated using UCP and e-UCP methods. In projects P1, P2, P3, P6, P8 to P14 the estimated deviation by using Re-UCP method is very less as compared to UCP and e-UCP and the estimated efforts by the same method obtained are almost significant with the actual efforts.
6. Evaluation
In order to evaluate accuracy of estimated efforts using a software effort estimation method different tools and techniques are available to ensure that the quality of results. In this research work combination of MRE
(Magni-0 0.1 0.2 0.3 0.4 0.5 0.6 0.7 0.8 0.9
Relevant Not Relevant
E
CF
Project Methodology Impact of Project Methodology on ECF
Relevant
Not Relevant
0 20 40 60 80 100 120
Relevant Not Relevant
Re
v
is
ed
Us
e
Ca
se
P
o
in
ts
Re
-UCP
PM: Project Methodology Impact of PM on Re-UCP calculated
Relevant
Not Relevant
0 500 1000 1500 2000 2500
Relevant Not Relevant
E
ff
o
rt
s P
H
p
er
R
e-UCP
Project Methodology Impact of PM on efforts calculated
Relevant
tude of Relative Error), MMRE (Mean Magnitude of Relative Error) and PRED (20) is used to evaluate the per-formance of proposed software estimation method Re-UCP and the results have been compared with the UCP and e-UCP methods to find out a suitable effort estimation method for estimating efforts in early stages of soft-ware development.
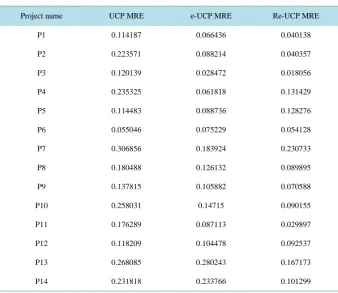
There are several criterions to evaluate predictions of estimates and in order to evaluate the UCP, e-UCP and Re-UCP Magnitude Relative Error (MRE) is calculated for each project as given below inTable 6. The MRE is calculated using the following equation for all the projects P1 through P14.
MRE= actual effort−estimated effort actual effort
All the MRE values are used to find out the value of MMRE Mean Magnitude of Relative Error and is calcu-lated as:
i n i 1 1
MMRE MRE.
n
= =
=
∑
The MMRE (Mean Magnitude Relative Error) is calculated to indicate the relative amount by which the esti-mated effort is an under-estimate or over-estimate in comparison to the actual estimate. MMRE is used in most of the research work as evaluation criterion due to its independent-of-units characteristic which means that MMRE is independent of units of estimated effort like person-hours, person-months or man-hours etc. MMRE is a meaningful tool used to summarize statistics and is very important in evaluating a software effort estimation model. The MMRE values for UCP, e-UCP and Re-UCP are graphically shown inFigure 8.
The Median Magnitude Relative Error MdMRE for UCP, e-UCP and Re-UCP is given inFigure 9.
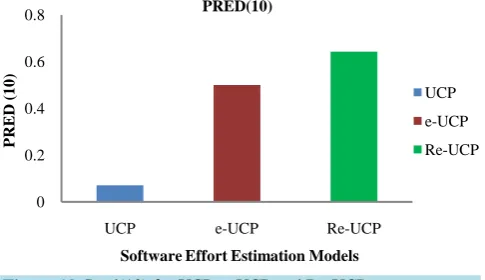
PRED(x) is simply the percentage of estimates that are within x% of the actual efforts. Therefore, PRED (10) will be the percentage of estimated that are within 10% of the actual efforts and the graph for PRED (10) of UCP, e-UCP and Re-UCP is given inFigure 10.
[image:9.595.144.483.428.721.2]PRED (20) will be the percentage of estimated that are within 20% of the actual efforts and the graph for PRED (20) of UCP, e-UCP and Re-UCP is given inFigure 11.
Table 6. MRE values for UCP, e-UCP and Re-UCP.
Project name UCP MRE e-UCP MRE Re-UCP MRE
P1 0.114187 0.066436 0.040138
P2 0.223571 0.088214 0.040357
P3 0.120139 0.028472 0.018056
P4 0.235325 0.061818 0.131429
P5 0.114483 0.088736 0.128276
P6 0.055046 0.075229 0.054128
P7 0.306856 0.183924 0.230733
P8 0.180488 0.126132 0.089895
P9 0.137815 0.105882 0.070588
P10 0.258031 0.14715 0.090155
P11 0.176289 0.087113 0.029897
P12 0.118209 0.104478 0.092537
P13 0.268085 0.280243 0.167173
Figure 8. MMRE fpr UCP, e-UCP and Re-UCP.
[image:10.595.192.436.91.241.2]Figure 9. MdMRE for UCP, e-UCP and Re-UCP.
[image:10.595.193.436.408.548.2]Figure 10. Pred(10) for UCP, e-UCP and Re-UCP.
Figure 11. Pred(20) for UCP, e-UCP and Re-UCP. 0
0.05 0.1 0.15 0.2
UCP e-UCP Re-UCP
M
M
R
E
Software Effort Estimation Models Mean Magnitude Relative Error
UCP
e-UCP
Re-UCP
0 0.05 0.1 0.15 0.2
UCP e-UCP Re-UCP
MdMR
E
Software Effort Estimation Models Median Magnitude Relative Error
UCP
e-UCP
Re-UCP
0 0.2 0.4 0.6 0.8
UCP e-UCP Re-UCP
P
RE
D (
1
0
)
Software Effort Estimation Models PRED(10)
UCP
e-UCP
Re-UCP
0 0.5 1
UCP e-UCP Re-UCP
P
RE
D (
2
0
)
Software Effort Estimation Models PRED(20)
UCP
e-UCP
[image:10.595.192.437.454.695.2]The Mean Absolute Error helps to understand the distribution of MRE values. The MAE for UCP, e-UCP and Re-UCP software effort estimation models is given inFigure 12. The distribution from theFigure 12 justifies the improved results in Re-UCP in comparison with UCP and e-UCP method of effort estimation for software projects in early stages of development.
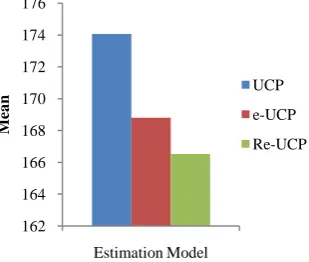
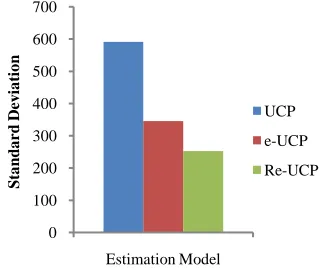
Means of estimated efforts for UCP, e-UCP and Re-UCP is given inFigure 13. Standard Deviation of esti-mated efforts for Re-UCP for UCP, e-UCP and Re-UCP is given inFigure 14.
Comparison of variance of estimated efforts for UCP, e-UCP and Re-UCP is given inFigure 15. The graphi-cal representation of mean, standard deviation and variance of efforts for all software projects P1 through P14 given inFigure 13 throughFigure 15 shows the better performance of Re-UCP model in comparison with UCP and e-UCP models of effort estimation for software development projects in the early stages of development.
Means of deviation from actual efforts for UCP, e-UCP and Re-UCP is given inFigure 16. Standard Devia-tion of deviaDevia-tion from actual efforts for UCP, e-UCP and Re-UCP is given inFigure 17.
[image:11.595.144.482.309.530.2]Variance of deviation from actual efforts for “Re-UCP” for UCP, e-UCP and Re-UCP is given inFigure 18. The graphical representation of mean, standard deviation and variance of deviation from actual estimation for all software projects P1 through P14 given inFigure 16 throughFigure 18 reiterates the better performance of Re-UCP model in comparison with UCP and e-UCP models of effort estimation for software development projects in the early stages of development.
Figure 12. Mean absolute error.
Figure 13. Mean absolute error. 0
100 200 300 400 500 600 700
UCP e-UCP Re-UCP
M
AE
Software Effort Estimation Models Mean Absolute Error
UCP
e-UCP
Re-UCP
162 164 166 168 170 172 174 176
Estimation Model
M
ea
n UCP
e-UCP
[image:11.595.237.392.573.704.2]Figure 14.Standard deviation of estimated effort.
[image:12.595.232.397.245.383.2]Figure 15. Variance of estimated effort.
Figure 16. Mean of deviation.
[image:12.595.232.395.571.706.2]Figure 18. Variance of deviation.
7. Conclusions
The deviation percentage calculated using Re-UCP justifies the improved performance of Re-UCP method of software effort estimation in comparison with UCP and e-UCP methods of software effort estimation. The ob-servations from the different software projects show the impact of including scalability as the 14th parameter and project-methodology as the 9th parameter of technical complexity factors respectively.
In order to validate the findings from the research work, the results were validated using MRE (magnitude of relative error) for each project using UCP, e-UCP and Re-UCP models of software effort estimation. The MMRE (mean magnitude relative error) also strengthened the observation of improved performance in use case of Re-UCP. The analysis of results was further validated by applying predictability 20% & 10%, the observa-tions from PRED (20) and PRED (10). With the rapid change in nature of software development process and in-crease in complexity of nature of software projects, it is very important to carry out continuous refinements of effort estimation model for maintaining consistency and accuracy of estimated efforts.
Proposal for Future Work
The validation process for Re-UCP needs to be carried out for large scale different software projects in order to increase acceptability. The future research needs to be carried out to enhance the advantages of Re-UCP for large-sized software projects across vertical and horizontals.
References
[1] Alves, R., Valente, P. and Nuno, J.N. (2013) Improving Software Effort Estimation with Human-Centric Models: A Comparison of UCP and iUCP Accuracy. Proceedings of the 5th ACM SIGCHI Symposium on Engineering Interactive Computing Systems, 287-296. http://dx.doi.org/10.1145/2494603.2480300
[2] Anda, B., Angelvik, E. and Ribu, K. (2002) Improving Estimation Practices by Applying Use Case Models. Product Focused Software Process Improvement. Springer, Berlin, 383-397. http://dx.doi.org/10.1007/3-540-36209-6_32
[3] Karner, G. (1993) Metrics for Objectory. University of Linköping, Sweden.
[4] Kirmani, M.M. and Wahid, A. (2015) Revised Use Case Point (Re-UCP) Model for Software Effort Estimation. Inter-national Journal of Advanced Computer Science and Applications, 6, 65-71.
[5] Ochodek, M., Nawrocki, J. and Kwarciak, K. (2011) Simplifying Effort Estimation Based on Use Case Points. Infor-mation and Software Technology, 53, 200-213. http://dx.doi.org/10.1016/j.infsof.2010.10.005
[6] Robiolo, G. and Orosco, R. (2008) Employing Use Cases to Early Estimate Effort with Simpler Metrics. Innovations in Systems and Software Engineering, 4, 31-43. http://dx.doi.org/10.1007/s11334-007-0043-y
[7] Kumari, S. and Pushkar, S. (2013) Performance Analysis of the Software Cost Estimation Methods: A Review. Inter-national Journal of Advanced Research in Computer Science and Software Engineering, 3, 229-238.
[8] Clemmons, R.K. (2006) Project Estimation with Use Case Points. The Journal of Defense Software Engineering, 18- 22.
[9] Jena, P.P. and Mishra, S. (2014) Survey Report on Software Cost Estimation Using Use Case Point Method. Interna-tional Journal of Computer Science & Engineering Technology, 5, 280-287.
[10] Jha, P., Jena, P.P. and Malu, R.K. (2014) Estimating Software Development Effort Using UML Use Case Point (UCP) 0
50000 100000 150000 200000 250000 300000 350000 400000
Estimation Model
V
a
ri
a
n
ce UCP
e-UCP
Method with a Modified Set of Environmental Factors. International Journal of Computer Science and Information Technologies, 5, 2742-2744.
[11] Nagar, C. (2011) Software Efforts Estimation Using Use Case Point Approach by Increasing Technical Complexity and Experience Factors. International Journal on Computer Science and Engineering, 3, 3337-3345.
[12] Nageswaran, S. (2001) Test Effort Estimation Using Use Case Points. Quality Week, 1-6.
[13] Nassif, A.B. (2010) Enhancing Use Case Points Estimation Method Using Soft Computing Techniques. Journal of Global Research in Computer Science, 1, 12-21.
[14] Periyasamy, K. and Ghode, A. (2009) Cost Estimation Using Extended Use Case Point (e-UCP) Model. International Conference on Computational Intelligence and Software Engineering, Wuhan, 11-13 December 2009, 1-5.
http://dx.doi.org/10.1109/cise.2009.5364515
[15] Robiolo, G. and Orosco, R. (2008) Employing Use Cases to Early Estimate Effort with Simpler Metrics. Innovations in Systems and Software Engineering, 4, 31-43. http://dx.doi.org/10.1007/s11334-007-0043-y
[16] Ruhe, M., Jeffery, R. and Wieczorek, I. (2003) Cost Estimation for Web Applications. 25th International Conference on Software Engineering, 3-10 May 2003, 285-294. http://dx.doi.org/10.1109/icse.2003.1201208
[17] Carroll, E.R. (2005) Estimating Software Based on Use Case Points. Companion to the 20th Annual ACM SIGPLAN Conference on Object-Oriented Programming, Systems, Languages, and Applications, 257-265.
http://dx.doi.org/10.1145/1094855.1094960
[18] Subraiadi, A.P., et al. (2014) Critical Review of the Effort Rate Value in Use Case Point Method for Estimating Soft-ware Development Effort. Journal of Theoritical and Applied Information Technology, 59, 735-744.
[19] Ashman, R. (2004) Project Estimation: A Simple Use-Case-Based Model. IT Professional, 6, 40-44.
http://dx.doi.org/10.1109/MITP.2004.41
[20] Azzeh, M. (2013) Software Cost Estimation Based on Use Case Points for Global Software Development. 5th Interna-tional Conference on Computer Science and Information Technology, 214-218.