27
Performance Comparisons of Novel Feature Vector
Selection Methods for Iris Recognition
H B Kekre
Phd,Sr. Professor, MPSTME,
NMIMS University, Vileparle
(w), Mumbai-56, India
Tanuja K Sarode
Phd,Asst. Prof. Computer
Engineering Department, TSEC
Mumbai-50, India
Sunayana V Jadhav
Asst. Prof. Department of IT
K.J Somaiya college of
Engineering Mumbai-77, India
ABSTRACT
The use of biometric systems has been increasingly encouraged by both government and private entities in order to replace or improve traditional security systems. The iris is commonly recognized as one of the most reliable biometric measures: it has a random morphogenesis and no genetic penetrance.
In today’s world, where terrorist attacks are on the rise, employment of infallible security systems is a must. This makes Iris recognition systems unavoidable in emerging security & authentication.
In this paper an iris recognition system based on various transformation methods is proposed. A novel approach of selecting feature vector for performance comparison is implemented. Also the performance comparisons of all the transformation methods is done to achieve better accuracy and efficiency on the basis of number of correct sample identified. The proposed system does not need any pre-processing and segmentation. DCT, HAAR, and WALSH, SLANT and KEKRE’S Transforms are tested on different size of feature vector to get best possible results.
General Terms
Iris recognition, biometric systems, performance comparison, Security, Feature Extraction.
Keywords
Biometric Recognition, Feature Vector, partial feature vector, Upper Diagonal feature vector.
1.
INTRODUCTION
[image:1.595.316.547.452.614.2]An iris is the area of the eye where the pigmented or colored circle, usually brown or blue, rings the dark pupil of the eye as shown in figure1. Iris recognition efficiency is rarely impeded by glasses or contact lenses with some exceptions [7].
Fig 1: A human eye
The iris is a thin membrane on the interior of the eyeball. Iris patterns are extremely complex are individual (even in fraternal or identical twins).the iris patterns are formed by six months after birth, get stable after a year and they remain same for life. Imitation is almost impossible and iris Patterns are easy to capture and encode.
Iris recognition is forecast to play a role in a wide range of other applications in which a person's identity must be established or confirmed.
Generally, iris recognition system consists of four major steps. They include image acquisition from iris scanner, iris image preprocessing, feature extraction and recognition. Image acquisition is a very important process as iris image with bad quality will affect the entire iris recognition process. It is critical to be implemented through good hardware design as well as software interface. What equally important is the iris image preprocessing step for mobile applications as the iris images taken by the users are less controllable as in the controlled laboratory environment. Improper iris image preprocessing can also influence the subsequent processes like feature vector extraction and recognition.
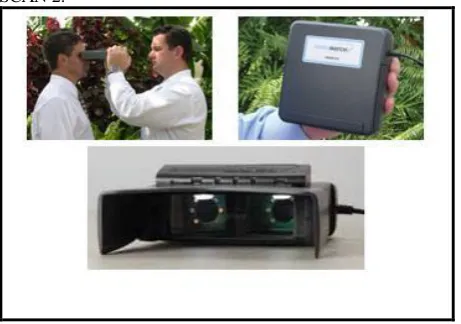
[image:1.595.96.239.582.681.2]The iris-scan process begins with a photograph. A specialized camera, typically very close to the subject, no more than three feet, uses an infrared imager to illuminate the eye and capture a very high-resolution photograph. This process takes only one to two seconds and provides the details of the iris that are mapped, recorded and stored for future matching/verification. The following figure2 shows Dual Iris Capture Scanner I SCAN 2.
Fig 2: Dual Iris Capture Scanner I SCAN 2
28 perfectly identify an individual, given millions of possibilities
[6]. Figure1 shows eye with iris.
2.
RELATED WORK
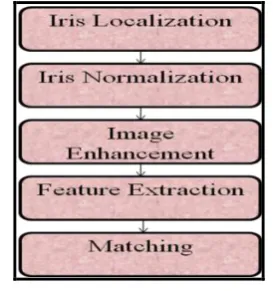
There are 5 basic stages of iris recognition namely iris Localization, iris Normalization, Image Enhancement, Feature Extraction and Matching that are shown in figure 3
2.1
Iris Localization
[image:2.595.97.234.306.452.2]It detects the inner and outer boundaries of iris. The inner and outer boundaries of iris have been approximated as circles. The centre, radius of iris and pupil is then determined. The centre of iris and pupil need not be same. Hough transform is a standard computer vision algorithm used to determine the geometrical parameters [3] in an image such as lines or circles. In this method an edge map is generated by calculating the first derivatives of intensity values in an eye image and then thresholding the result. From the edge map, votes are cast in Hough space for the parameters of circles passing through each edge point. These parameters are the centre coordinates and the radius which are sufficient to describe any circle.
Fig 3: Five basic stages of Iris Recognition
2.2
Iris Normalization
After successfully segmenting iris region from an eye image, next step is to transform the iris region to the fixed dimensions. Dauman devised the homogeneous rubber sheet model [9]. This model remaps each point within the iris region to polar coordinates from the Cartesian coordinates.
2.3
Iris Image Enhancement
To compensate for low contrast, poor light source and position of light source the enhancement of the normalized image is very important. Local histogram analysis [3] and the simple threshold operation can be utilized to reduce the reflection noise.
2.4
Feature Extraction
Various algorithms has been proposed and employed by large number of researchers to extract the significant features from the normalized iris. For example Haar wavelet transform [2] can transform huge data sets to considerably smaller representations.
Dauman has proposed a novel method of feature extraction using 2D Gabor filters. Gabor filter’s impulse response is defined by the multiplication of harmonic function with Gaussian function. The phase information present in the iris image is extracted using Gabor filters as it does not depend upon extraneous factors like illumination, contrast and camera. Field has proposed a log Gabor filter for feature extraction which is Gaussian on logarithmic scale. The
advantage of Log filter is used to remove the DC component present in the image.
2.5
Matching
The last step in iris recognition system is the matching of individual iris feature vectors with that of iris feature vectors stored in the database. The Hamming distance gives a measure of how many bits are same between two bit patterns. Using the Hamming distance of two bit patterns, a decision can be made as to whether the two patterns were generated from different irises or from the same one. An individual iris region contains features with high degrees of freedom. Each iris region will produce a bit-pattern which is independent to that produced by another iris. On the other hand, two iris codes produced from the same iris will be highly correlated. Hamming distance is the matching metric employed by Dauman[3].The advantage of hamming distance is fast matching speed because the templates are in binary format.
3.
PROPOSED METHOD
[image:2.595.331.525.317.443.2]Algorithm for applying transformation on color iris images to generate and match feature vectors each of size 128×384 is given in [1]. Example of same is shown in the figure4 below
.
Fig 4: Feature Vector
In this paper iris recognition is done in two steps, first step is Feature Extraction and second is Matching. Feature Vector is generated using DCT, Haar, Walsh, Slant and Kekre’s Transforms according to [1].
3.1
2D DCT
[image:2.595.351.497.572.666.2]The DCT decomposes a signal into its elementary frequency components. When applied to an M×N image/matrix, the 2D-DCT compresses all the energy information of the image and concentrates it in a few coefficients located in the upper-left corner of the resulting real-valued M×N DCT/frequency matrix. Matrix for 4x4 DCT is shown below.
Fig 5: 4x4 DCT matrix
3.2
The Haar Transform
29
Fig 6: 4x4 Haar matrix
3.3
The Walsh Transform
Its matrix is defined as a set of N rows, denoted Wj, for j = 0,
1, ..., N - 1, which has the following properties
:
Wj takes on the values +1 and -1.
Wj[0] = 1 for all j.
Wj xWkT=0, for j k and Wj xWkT =N, for j=k.
Wj has exactly j zero crossings, for j = 0, 1, ...., N-1.
Each row Wj is either even or odd w.r.t. to its midpoint.
[image:3.595.99.241.76.151.2]The 4x4 Walsh transform matrix is shown below
Fig 7: 4x4 Walsh matrix
3.4
The Slant Transform
Slant transform is a member of the orthogonal transforms. It has a constant function for the first row, and has a second row which is a linear (slant) function of the column index. The matrices are formed by an iterative construction that exhibits the matrices as products of sparse matrices, which in turn leads to a fast transform algorithm. The 4x4 Slant transform matrix is shown below.
Fig 8: 4x4 Slant matrix
3.5
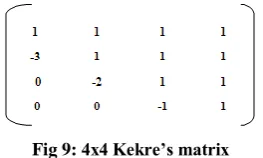
The Kekre’s Transform
Kekre’s transform matrix can be of any size NxN, which need not to be an integer power of 2. All upper diagonal and diagonal elements of Kekre’s transform matrix are 1, while the lower diagonal part except the elements just below diagonal is zero. The 4x4 Kekre’s transform matrix is shown below.
Fig 9: 4x4 Kekre’s matrix
3.6
Detailed Scheme of implementation
After applying the transformation methods most of the important features of an image are get concentrated at its right hand side’s top corner, base on this new methods are proposed for selecting feature vector for comparisons based on nature of energy compactions which are partial FV method and Upper Diagonal FV method. Matching of two Feature vectors will be done using MSE (mean square error). [image:3.595.320.539.275.377.2]Detailed Scheme of implementation is shown below in following figure 10.
Fig 10: Block Diagram of proposed Iris Recognition system.
3.6.1
Partial FV Method
[image:3.595.104.231.374.444.2]FV of size Instead of selecting whole feature vector of size 128×384 if we select part of size M×N then it is called as partial FV.Partial 8×8 is shown in the figure11 below.
Fig 11: Selecting 8×8 of FV.
3.6.2
Upper Diagonal FV Method
[image:3.595.329.529.474.587.2]Diagonal FV method is improvement of partial FV method where only upper diagonal elements of partial FV are considered. Upper Diagonal FV of size 8×8 is shown in the figure12 below.
[image:3.595.327.530.653.754.2]30
4.
RESULT AND DISCUSSIONS
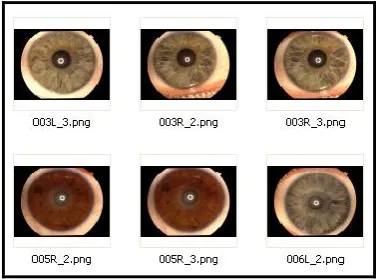
[image:4.595.323.534.72.213.2]Firstly Feature Vectors are created for the database images with specific transformation methods using algorithm [1]. We have used phoenix database consisting of irises of 64 individuals. Each individual has 3 images corresponding to the left and 3 images corresponding to the right eye. Six iris images in portable network graphics (PNG) format of each individual were taken into consideration. Thus in all there are (64×6) 384 such images as a part of our database. We have resized each image to a 128×128. Out of 384 images two images each of left and right eye in the database is kept for testing and one image each is used as query image. System is tested by giving left/right query images which is checked for the entire database of left as well as right iris images.Figure13 shows sample images of Phoenix database of iris
.
Fig 13: Sample images of Phoenix database of iris.
[image:4.595.317.536.122.361.2]Table1 shows comparisons of whole FV, Partial FV and Upper Diagonal FV selection methods with respect to DCT, Haar and Walsh transform. Different size of Feature vector like 4×4, 8×8, and 16×16 are considered and percentage of number of samples correctly identified is calculated.
Table 1.Comparisons of all FV selection methods with respect to DCT, Haar and Walsh transform, using feature
vector of size 4×4, 8×8, 16×16 and number of correct sample identified in percentage.
FV Size
Transform Ful
l Partial FV
Upper Diagonal FV
128 X12 8
4X4 8X8 16X16 4X4 8X8 16X16
DCT 66.40 71.87 73.4 68.75 65.6 74.2 70.31
Haar 66.40 67.78 75 71.87 68.7 72.6 70.31
Walsh 66.40 66.40 75 71.87 70.3 74.2 71.09
Slant 66.40 67.6 75 70.3 65.62 75 71.3
Kekre’s 66.4 0
56.2 5
53.9 53.12 56.2
5
53.9 53.12
5.
PERFORMANCE EVALUATION
Figure14,15 shows performance of both the FV selection method using three different transform DCT, Haar ,Walsh slant and Kekre’s with respect to Genuine Acceptance Rate (GAR) that is number of correct sampled identified
.
[image:4.595.72.262.251.391.2]Fig 14: Results in Bar Graph for partial FV
Fig 15: Results in Bar Graph for Upper Diagonal FV
As shown in the figure14 if whole FV is considered it gives 85 GAR for all three transformation methods DCT, Haar Walsh slant and Kekre’s because normalized matrices are used.
In Partial FV selection method for 8×8 FV gives best results with Haar Walsh and Slant transform with 96 GAR.i.e 75% accuracy.
In Upper Diagonal FV selection method for 8x8 FV size gives best result with DCT and Walsh transform with 95 GAR i.e. 74.21% accuracy which is shown in figure 15. Slant transforms gives 96 GAR i.e.75% DCT and Walsh both are known for best energy compaction and slant transform
increases the speed of computations but DCT is lossy
compression technique so depending on application we
can select any one of them as the best possible solution.
For both the feature vector selection methods according to their performance accuracy gives pyramid like graph where peak is at 8×8 FV.
6.
CONCLUSION
[image:4.595.49.295.524.687.2]31
7.
REFERENCES
[1] H. B. Kekre, Tanuja K. Sarode, Vinayak Ashok Bharadi, Abhishek A. Agrawal, Rohan J.Arora, and Mahesh C. Nair “Performance Comparison of DCT and VQ Based Techniques for Iris Recognition” journal of electronic science and technology, vol. 8, no. 3, September 2010.
[2] Patnala S. R. Chandra Murty1, E. Sreenivasa, Reddy, and I. Ramesh Babu “Iris Recognition System Using Fractal Dimensions of Haar Patterns” International Journal of Signal Processing, Image Processing and Pattern Recognition Vol. 2, No.3, September 2009.
[3] Atul Bansal, Ravinder Agarwal, R.K. Sharma “Trends in Iris Recognition Algorithms”2010 Fourth Asia International Conference on Mathematical/Analytical Modeling and Computer Simulation.
[4] H. B. Kekre, Tanuja K. Sarode, Vinayak Ashok Bharadi, Abhishek A. Agrawal, Rohan J.Arora, and Mahesh C. Nair “Iris Recognition Using Vector Quantization” journal of electronic science and technology, vol. 8, no. 3, September 2010.
[5] Http://phoenix.inf.upoml.cz/iris/download/, (referred on 18-08-2011, 10:00 p.m.).
[6] Http://www.cl.cam.ac.uk
[7] Sarah E. Baker, Amanda Hentz, Kevin W. Bowyer, and Patrick J. Flynn “Degradation of Iris Recognition Performance Due to Non-Cosmetic Prescription Contact Lenses”, june8, 2010.
[8] Z. Wei, X. Qui, Z. Sun, and T. Tan, “Counterfeit Iris Detection Based on Texture Analysis”, Proc. of IEEE Int’l Conf. on Pattern Recognition vol. 5, no. 2, 2008.
[9] J. Dauman “How iris recognition works”, IEEE Trans. CSVT, vol. 14, no.1, pp.21-30, 2004.
[10]Mahdi Jampour , Ali Naserasadi, Majid Estilayee, and Maryam Ashourzadeh, “Extract and Classification of Iris
Images by Fractal Dimension and Efficient Color of Iris”, International Journal of Computer Applications (0975 – 8887) ,Volume 18– No.1, March 2011.
[11]Aditya Abhyankar, Stephanie Schuckers, “Novel Biorthogonal Wavelet based Iris Recognition for Robust Biometric System”, International Journal of Computer Theory and Engineering 1793-8201, Vol. 2, No. 2 April, 2010.
[12]Christian Rathgeb, Andreas Uhl, “Bit Reliability driven Template Matching in Iris Recognition”, 978-0-7695-4285, 2010 IEEE .
[13]W. Boles and B. Boashash, “A human identification technique using images of the iris and wavelet transform,” IEEE Trans. Signal Processing, vol. 46, no. 4, pp.1185-1188, 1998
[14]R. Wildes, “Iris recognition: an emerging biometric technology,” Proc. of IEEE, vol. 85, no. 9, pp. 1348-1363, 1997.
[15]J. Cui, Y. Wang, T. Tan, L. Ma, and Z. Sun, “A fast and robust iris localization method based on texture segmentation,” in Proc. of SPIE Defense and Security Symposium, Orlando, FL, Florida, 2004, pp. 401-408.
[16]R.P.Wildes, “Iris Recognition: An Emerging biometric technology” Proceeding of the IEEE, vol. 85, pp. 1348-1363, Sep 1997.
[17]D. Monro; S. Rakshit; D. Zhang, “DCT-Based Iris Recognition,” IEEE Trans. Pattern Analysis and Machine Intelligence, IEEE Transactions on, vol. 29, pp. 586-595, 2007.