A software based Resource Selection Process in
Competitive Network Environment using ANOVA
(A Case Study)
S. Vaitheeswaran
Final year, B.E. Mechanical Engineering Sri Sairam Engineering
College, Chennai-600 044.
S. Santhosh
Final year, B.E. Mechanical Engineering Sri Sairam Engineering
College, Chennai-600 044.
B. Vijaya Ramnath
Professor, Department of Mechanical Engineering
Sri Sairam Engineering College, Chennai-600 044.
ABSTRACT
The trend of the today‟s competitive manufacturing scenario has completely changed from quantity oriented to quality oriented products with minimum cost. At this juncture, several industries are now aiming in producing low cost products without compromising the quality. This paper evaluates the influence of type of lathe on the „productivity‟ during the selection of a suitable brand of machine tool from a group of three brands for a leading manufacturing industry. For selecting the Machine tool, a real time study has been undertaken in the industry and the data were acquired. Other factors which were likely to affect the productivity of the lathe like tool type and skill of the operator were also included in the study as per the industry‟s specifications. From the data acquired a Latin square design was designed to determine the suitability of the three brands of lathe. A software package using Visual Basic has been developed to carry out ANOVA calculations. The ANOVA results showed that the there was no significant difference in the productivity. This means that the industry can go forward for buying the cheapest machine thereby they are economically benefitted.
Keywords
Competitive manufacturing scenario, productivity, software package, ANOVA.
1.
INTRODUCTION
After the industrial revolution, the growth of industrial and manufacturing sector has become intangible. And today, we come across enormous technological advancements especially in the field of precision manufacturing. This has boosted up the manufacturing concerns to produce reliable and high quality products.
This paper deals with the selection process of a Machine tool from a suitable manufacturer for performing required operations in a manufacturing industry. The industry‟s specifications were deeply analyzed and a practical trial run of three different brands of Machine tool was performed. Since the industry aims to have high productivity, the Machine tool under three different tools and three different operators of varying skills are considered. A trial run was perfectly designed incorporating all these parameters into consideration. The data was collected and analyzed using Analysis of Variance (ANOVA) with a Latin square design.
2.
LITERATURE SURVEY
Mingers and Harzing (2007) presented journal ranking for business and management based on a statistical analysis of the Harzing data set which contains 13 rankings.
Mechri et al., (2010) presented a new approach in which the Analysis Of Variance (ANOVA) is used to identify the design variables that have the most impact on the variation of the building energy performance for a typical office building and to allocate the contribution of each variable to this variation. Trabelsi and Rezgui (2010) investigated individual performance of trainees who are subjected to two interrelated courses, namely, CAD and CADCAM, established regression models which deal with the correlation between Exam and Continuing Assessment scores and outlined individual performances of trainee.
Bharathi and Natarajan (2010) found the smallest set of genes that can ensure highly accurate classification of cancer from micro array data by using supervised machine learning algorithms and obtained very high accuracy with only two genes.
Graham and Julian (2010) assessed whether changes occurred in the trainees' confidence, mental health literacy, attitudes towards effective treatments, mental health knowledge and skills and community mental health ideology following training.
Vendômois and Roullier (2009) presented for the first time a comparative analysis of blood and organ system data from trials with rats fed three main commercialized genetically modified (GM) maize (NK 603, MON 810, MON 863), which are present in food and feed in the world.
scavengers i.e., reduced glutathione (GSH) and vitamin C were estimated in 60 controls and 89 type 2 diabetic patients using one way ANOVA (F-test) for multiple group comparison.
Beccacece and Borgonovo (2011) showed that Tsetlin and Winkler‟s multivariate risk attitudes imply ultra modularity of the utility function and also demonstrated that geometric properties of a multivariate utility function can be successfully studied by utilizing an integral function expansion (functional ANOVA).
Bertaccini and Varriale (2007) proposed to use a forward search procedure that orders the observations by their closeness to the hypothesized model. The procedure can be applied following two different strategies: one that adds units maintaining the relative group dimension and the other that adds only one new unit at each step of the search.
Gönder et al., (2011) investigated the application of two-step nanofiltration (NF) process in the purification of biologically treated pulp and paper wastewater for the purpose of reuse. In the first step, the effect of operating conditions such as pH, temperature, transmembrane pressure and volume reduction factor (VRF) on the membrane fouling was investigated using FM NP010 membrane. Membrane fouling was minimized by optimizing the operating conditions using Taguchi experimental design method. The smaller-the-better signal-to-noise (S/N) ratio was used to analyze the results of experiments.
Reynolds (1995) showed that explicit formulae can be found for the two missing observations, which can therefore be calculated directly without the need for an iterative procedure. Zhang (2012) proposed a simple and accurate approximate degrees of freedom (ADF) test. The ADF test was shown to be invariant under affine-transformations, different choices of contrast matrix for the same null hypothesis, or different labeling schemes of cell means. Moreover, it could be conducted easily using the usual F-distribution with one unknown degree of freedom estimated from the data.
Bouveresse (2011) presented a modification of the ANOVA– PCA method, proposed by Harrington to identify significant factors and interactions in an experimental design. This modified method used the idea of multiple table analysis, and looked for the common dimensions underlying the different data tables, or data blocks, generated by the “ANOVA-step” of the ANOVA–PCA method, in order to identify the significant factors.
Rajput (2011) using the revised fuzzy analytic hierarchy process (AHP) introduced a new decision process to include the time dependency of decisions and statistical weighting from the standard analysis of variance (ANOVA). The application of the method was shown using a case study in the selection of wafer slicing and coating process for a three-year operation time.
3.
NOTATIONS USED
M1 – Machine tool of brand 1
M2 – Machine tool of brand 2
M3 – Machine tool of brand 3
O1 – Operator 1 (high skilled)
O2 – Operator 2 (medium skilled)
O3 – Operator 3 (low skilled)
T1 – tool type 1 (tool material : High Speed Steel)
T2 – tool type 2 (tool material : Cemented carbide)
T3 – tool type 3 (tool material : Tungsten carbide)
Ti – sum of the parameters in the row of table 3
Tj – sum of the parameters in the column of table 3
xij – sum of squares of the parameters listed in the row and column of table 3
n – number of elements (3)
Tk – sum of the parameters in the row of table 4
F0 – obtained value of „F‟ from the observed data
4.
PROBLEM IDENTIFICATION AND
SOLUTION
A leading manufacturing industry in southern part of India is in need of purchasing about 100 Machine tools for its new plant as part of their expansion and modernization process. The industry had called for quotation from different Machine tool manufacturers. From the bids received from various leading machine tool manufacturers, three brands were chosen based on their previous track record. Now, the industry needs to know which one among the three brands would have high productivity with least cost and also with less rejection rate. The industry is now in a position to test the compatibility of these three brands with different tools and different skill level of operators. So, the industry decided to run a trial on all the three machine tool brands and select a suitable brand that would have high productivity with least rejection rate.
5.
DATA ACQUISITION AND
ANALYSIS
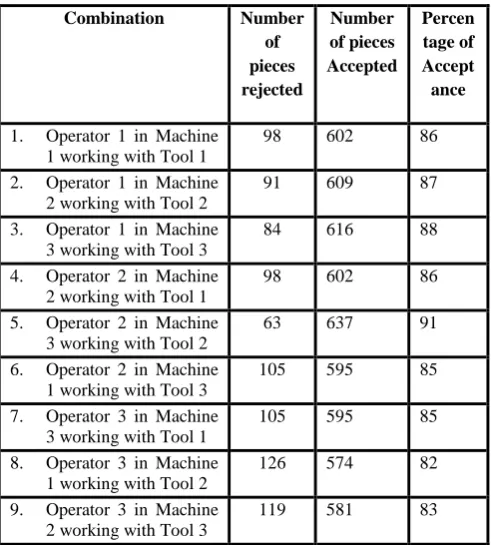
The practical trial run was planned to run all three machine simultaneously for 21 hours i.e. for three shifts (each shift lasted for seven hours). In this process, three different tools and three different operators were randomly coupled and made to work in the machines to produce 700 pieces. Three sets of products were produced by the three machines in each shift, thus totally nine sets of products were obtained with each set containing the prescribed 700 pieces.
Table 1. Percentage of Components accepted among 700 pieces produced
Combination Number
of pieces rejected
Number of pieces Accepted
Percen tage of Accept
ance
1. Operator 1 in Machine 1 working with Tool 1
98 602 86 2. Operator 1 in Machine
2 working with Tool 2
91 609 87 3. Operator 1 in Machine
3 working with Tool 3
84 616 88 4. Operator 2 in Machine
2 working with Tool 1
98 602 86 5. Operator 2 in Machine
3 working with Tool 2
63 637 91 6. Operator 2 in Machine
1 working with Tool 3
105 595 85 7. Operator 3 in Machine
3 working with Tool 1
105 595 85 8. Operator 3 in Machine
1 working with Tool 2
126 574 82 9. Operator 3 in Machine
2 working with Tool 3
119 581 83
6.
ANOVA
The technique of Analysis of Variance (ANOVA) is used to test among different statistical models and judge whether the observed variance in a particular variable is significant. Here, a continuous response variable, known as a dependent variable, is measured under experimental conditions identified by classification variables, known as independent variables. Since the productivity is mainly influenced by the Machine tool and the percentage of acceptance they become the experimental variables. Apart from these variables, tool type and operator skill also influence the productivity and so they are designated as extraneous variables.
The two types of ANOVA are as discussed below, 1. One way ANOVA
The one way analysis of variance allows comparing several groups of observations, all of which are independent but possibly with a different mean (for each group). A test which is of great importance is whether all the means are equal or not. The observations all arise from one of several different groups (or have been exposed to one of several different treatments in an experiment).
2. Two way ANOVA
3. Two Way Analysis of Variance is a way of studying the effects of two factors separately (their main effects) and (sometimes) together (their interaction effect).
The following are some important principles used in design of experiments and their relationships are shown in fig.1 and explained below:
5.1. Randomization
Randomization is the process by which experimental units (the basic objects upon which the study or experiment is carried out) are allocated to treatments; that is, by a random process and not by any subjective and hence possibly biased approach. The treatments should be allocated to units in such a way that each treatment is equally likely to be applied to each unit. Randomization is preferred since alternatives may lead to biased results. The main point is that randomization tends to produce groups for study that are comparable in unknown as well as known factors likely to influence the outcome, apart from the actual treatment under study. The analysis of variance (ANOVA) F-tests used here assumes that treatments have been applied randomly.
5.2. Replication
Measurements are usually subject to variation and uncertainty. Measurements are repeated and full experiments are replicated to help identify the sources of variation and to better estimate the true effects of treatments.
5.3. Local Control
Measurements are usually subject to variation and uncertainty. Measurements are repeated and full experiments are replicated to help identify the sources of variation and to better estimate the true effects of treatments.
7.
MODELLING THE MACHINE TOOL
SELECTION PROBLEM
[image:3.595.49.295.101.374.2]RANDOMIZATION
TECHNIQUE
REPLICATION
PROCESS
LOCAL CONTROL
OVER VARIABLES
VALIDITY OF
ESTIMATED
EXPERIMENTAL
ERROR
REDUCTION OF
[image:4.595.71.524.69.317.2]EXPERIMENTAL ERRORS
EFFICIENCY
[image:4.595.317.540.378.723.2]Fig 1: Principle of design of Experiments
Table 2 Productivity during Various Shifts
Table 3 Parameters of ANOVA
Parameter T1 T2 T3 Ti Ti2/n O1 M1-86 M2-87 M3-88 261 22707 O2 M2-86 M3-91 M1-85 262 22881.33 O3 M3-85 M1-82 M2-83 250 20833.33 Column
Total
258 280 255 773 66421.67 Tj
2
/n 22016 22533.33 21845 66395
x
ij2=
66449
Table 4 Parameters Related To Machines Only
Machine Brand
Percentage of Acceptance
Tk Tk2/n
[image:4.595.318.539.383.723.2]M1 86 85 82 253 21336.33 M2 87 86 83 256 21845.33 M3 88 91 85 264 23232 Total 773 66413.67
Table 5 ANOVA
Sum of variance
Sum of squares
Degree of freedom
Mean of squares
F0
Between operators
Q1 = 29.556
n-1 = 2 14.78 10.231
Between tools
Q2 = 2.8889
n-1 = 2 1.444 1
Between machines
Q3 = 21.556
n-1 = 2 10.78 7.4615
Residual Q4 = 2.8889
(n-1)(n-2) = 2
1.444
Parameter T1 T2 T3
0 2 4 6 8 10 12 14 16 18 20
Standard Value
Between Operators
Between Tools
[image:5.595.65.269.71.247.2]Between Machines
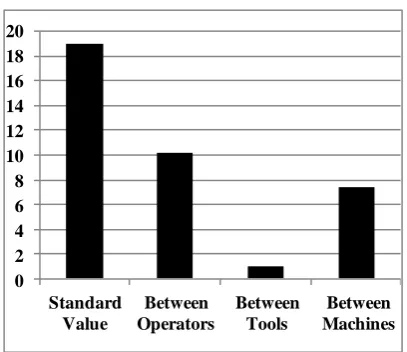
Fig: 2 Graphical Comparisons between Standard and Obtained Results
8.
RESULTS AND CONCLUSIONS
It has been observed from the standard F-tables that for degree of freedom (2, 2) at 95% probability (5% level of significance) standard value, F5%= 19. All the obtained values are less than the standard value. So, it can be concluded that there‟s no significant difference between operators or tools or machines.
Thus a systematic procedure has been adopted and the following conclusions were drawn:
(1) The productivity of the industry will not get varied by purchasing any one of the three brands of Machine tool.
(2) As there‟s no significant difference in the capabilities of machines, the industry may choose the machine with lowest cost.
9.
FEATURES OF ANOVA AS
INTERPRETED FROM THIS
RESEARCH
While the conventional resource selection techniques are qualitative, ANOVA is a mathematical and quantitative approach for resource selection.
Though the computational work involved for ANOVA is a bit complicated, once they are programmed using software like Visual Basic, the computation becomes simpler.
It‟s easy to switch to a higher level of significance (acceptance) by changing the coding. Hence ANOVA allows upgradation of quality measures followed in the industry.
Most importantly, ANOVA exhibits the effect of each input variable (say, operators) on the output variable (here, percentage of acceptance).
10.
REFERENCES
[1] Mingers. J and Harzing. A, 2007. Ranking journals in business and management: a statistical analysis of the Harzing data set, European Journal of Information Systems, 4(16), 303–316.
[2] Houcem Eddine Mechri, Alfonso Capozzoli and Vincenzo Corrado, 2010. Use of the ANOVA approach for sensitive building energy design, Applied Energy, 87, 3073–3083.
[3] Trabelsi, A. and Rezgui M., 2010. A multifactor ANOVA study for trainees performance measurement subjected to CADCAM and CAD courses,International Journal of Vocational and Technical Education, 2(3), 41 –54.
[4] Bharathi, A. and Natarajan, A.M. 2010. Cancer Classification of Bioinformatics data using ANOVA, International journal of computer theory and engineering, 2 (3), 369-373.
[5] Graham, A.L. et al., 2010 “Improving responses to depression and related disorders: evaluation of a innovative, general, mental health care workers training program”, International Journal of Mental Health Systems, Vol. 4.
[6] Vendômois, J. and Roullier, F., 2009. “A Comparison of the Effects of Three GM Corn Varieties on Mammalian Health”, International Journal on Biological Sciences, 5, 706-726.
[7] Samuel, T. V., 2011. “Proxidant and antioxidant status in type 2 diabetes with relation to its duration”, International Journal of Pharma and Bio Sciences, 2(2), B-386-391.
[8] Beccacece, F. and Borgonovo, E., 2011. “Functional ANOVA, ultramodularity and monotonicity: Applications in multiattribute utility theory”, European Journal of Operational Research, 210, 326–335.
[9] Bertaccini, B. and Varriale, R. 2007. “Robust Analysis Of VAriance: An approach based on the Forward Search”, Computational Statistics & Data Analysis, 51, 5172 – 5183.
[10] Gönder, .Z.B., Arayici, S. and Barlas, H., 2011. Advanced treatment of pulp and paper mill wastewater by nanofiltration process: Effects of operating conditions on membrane fouling, Separation and Purification Technology, 76, 292–302.
[11] Reynolds J. F., 1995. Estimating missing observations in ANOVA, International Journal of Mathematical Education in Science and Technology, 26(6), 895-901. [12] Jin-Ting Zhang. 2012. An approximate degrees of
freedom test for heteroscedastic two-way ANOVA, Journal of Statistical Planning and Inference, 142(1), 336-346.
[13] D. Jouan-Rimbaud Bouveresse et al. 2011. Identification of significant factors by an extension of ANOVA–PCA based on multi-block analysis, Chemometrics and Intelligent Laboratory Systems, 106(2), 173-182 [14] Harish C. Rajput et al. 2011. Including time dependency