T E C H N I C A L N O T E S
Open Access
T
2
mapping of the heart with a double-inversion
radial fast spin-echo method with indirect echo
compensation
Tomoe Hagio
1, Chuan Huang
2,3, Aiden Abidov
4,5, Jaspreet Singh
4, Bujji Ainapurapu
4, Scott Squire
6,
Denise Bruck
5and Maria I Altbach
6*Abstract
Background:The abnormal signal intensity in cardiac T2-weighted images is associated with various pathologies including myocardial edema. However, the assessment of pathologies based on signal intensity is affected by the acquisition parameters and the sensitivities of the receiver coils. T2mapping has been proposed to overcome limitations of T2-weighted imaging, but most methods are limited in spatial and/or temporal resolution. Here we present and evaluate a double inversion recovery radial fast spin-echo (DIR-RADFSE) technique that yields data with high spatiotemporal resolution for cardiac T2mapping.
Methods:DIR-RADFSE data were collected at 1.5 T on phantoms and subjects with echo train length (ETL) = 16, receiver bandwidth (BW) = ±32 kHz, TR = 1RR, matrix size = 256 × 256. Since only 16 views per echo time (TE) are collected, two algorithms designed to reconstruct highly undersampled radial data were used to generate images for 16 time points: the Echo-Sharing (ES) and the CUrve Reconstruction via pca-based Linearization with Indirect Echo compensation (CURLIE) algorithm. T2maps were generated via least-squares fitting or the Slice-resolved Extended Phase Graph (SEPG) model fitting. The CURLIE-SEPG algorithm accounts for the effect of indirect echoes. The algorithms were compared based on reproducibility, using Bland-Altman analysis on data from 7 healthy volunteers, and T2 accuracy (against a single-echo spin-echo technique) using phantoms.
Results:Both reconstruction algorithms generated in vivo images with high spatiotemporal resolution and showed good reproducibility. Mean T2difference between repeated measures and the coefficient of repeatability were 0.58 ms and 2.97 for ES and 0.09 ms and 4.85 for CURLIE-SEPG. In vivo T2estimates from ES were higher than those from CURLIE-SEPG. In phantoms, CURLIE-SEPG yielded more accurate T2s compared to reference values (error was 7.5-13.9% for ES and 0.6-2.1% for CURLIE-SEPG), consistent with the fact that CURLIE-SEPG compensates for the effects of indirect echoes. The potential of T2mapping with CURLIE-SEPG is demonstrated in two subjects with known heart disease. Elevated T2values were observed in areas of suspected pathology.
Conclusions:DIR-RADFSE yielded TE images with high spatiotemporal resolution. Two algorithms for generating T2maps from highly undersampled data were evaluated in terms of accuracy and reproducibility. Results showed that CURLIE-SEPG yields T2estimates that are reproducible and more accurate than ES.
Keywords:Cardiovascular magnetic resonance, Myocarditis, Edema, T2, Mapping, Radial, FSE, Indirect echo
* Correspondence:[email protected]
6Department of Medical Imaging, University of Arizona, Tucson, Arizona, USA Full list of author information is available at the end of the article
Background
T2-weighted imaging is an important technique in
Car-diovascular Magnetic Resonance (CMR) and it has been used for the diagnosis of a series of pathologies [1-10]. Because inflammation in tissue leads to T2 contrast
changes, T2-weighted imaging can be used to detect
myocardial edema [9]. Currently, the most frequently used technique to look at edema in the heart is the triple inversion recovery prepared sequence (triple IR), which yields black-blood images with fat suppression [10]. The images are interpreted by looking at high signal intensity regions within the myocardium that are indicative of water accumulation. A drawback of the method is that the contrast between diseased and normal myocardium is dependent on the choice of parameters, e.g., TE. Fur-thermore, the signal intensity modulation caused by the use of multiple receivers (i.e., coil sensitivities) makes it more challenging to distinguish edematous areas from healthy myocardium.
T2mapping of the heart has been proposed as an
al-ternative for diagnosing myocardial edema [11-14]. Kim, et al. [11] implemented a breath-hold ECG-triggered double inversion recovery (DIR) multi-echo fast spin-echo (FSE) pulse sequence as a black-blood technique to quantify R2 (1/T2) in the myocardium. The method is
fast and has high temporal resolution (data for 10 TE time points are acquired within a breath hold) but low in-plane spatial resolution (acquisition matrix size = 128 × 72) due to the time constraints imposed by the breath hold. Bright-blood techniques such as the T2-prepared
steady-state free-precession (T2prep-SSFP) methods [12-14] have
also been proposed for T2 mapping of the heart for
breath-hold [12,13] and free-breathing [14] acquisitions. The technique yielded images with better spatial reso-lution (acquisition matrix size = 130 × 160) than the Carte-sian DIR-FSE method but with lower temporal resolution (only 2 to 3 TE time points). In the T2prep-SSFP pulse
sequence the TE images are collected sequentially, which can introduce misregistration between time points [13,14]. In this work we present and evaluate a double inver-sion recovery radial fast spin-echo (DIR-RADFSE) tech-nique [15,16] for T2 mapping of the heart. Because in
radial acquisitions each radial line goes though the cen-ter of k-space, a single DIR-RADFSE k-space data set can be divided into partial sets from which images at dif-ferent TEs (number of TEs = ETL) can be reconstructed [17]. In a typical setup for CMR applications we collect data with high temporal resolution (16 TE time points) and since data for all TEs are acquired in each TR period the effects of misregistration between TE sets are mini-mized. Higher spatial resolution can also be achieved be-cause the spatial resolution is primarily determined by the number of readout points in radial sampling. Radial k-space trajectories are intrinsically more robust against
motion artifacts compared to the conventional Cartesian k-space scanning [18,19], a clear advantage for T2-weighted
imaging of the heart. To limit the scan time to a breath hold we only collect a limited number of radial views per TE (typically 16 views) thus, each TE data set is highly undersampled. Images from highly undersampled k-space data can be reconstructed with an echo sharing (ES) algo-rithm [17] or a model-based algoalgo-rithm we recently deve-loped: CUrve Reconstruction via pca-based Linearization with Indirect Echo compensation(CURLIE) algorithm [20]. CURLIE takes into account the effect of indirect echoes (e.g., stimulated echoes) that are present in multi-echo spin-echo acquisitions [20]. The DIR-RADFSE technique is evaluated here in phantoms and in vivo.
Methods
All human studies were performed under informed consent with a protocol approved by the University of Arizona Institutional Review Board.
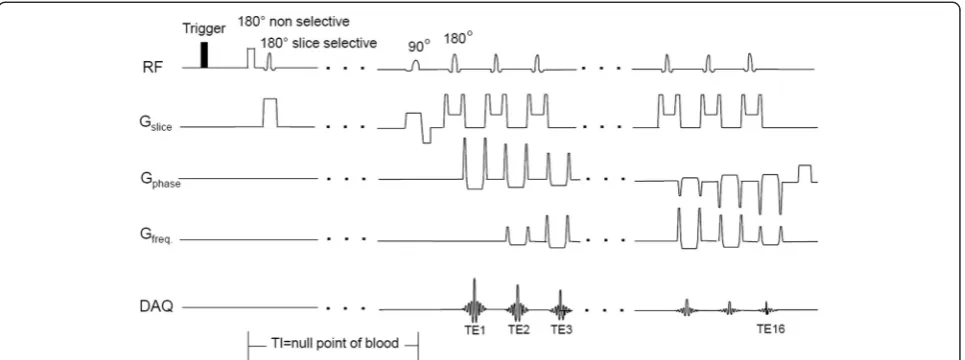
All data were acquired on a 1.5 T Signa HDxt GE MR scanner (General Electric Healthcare, Milwaukee, WI) using the DIR-RADFSE pulse sequence [15,16]. As shown in Figure 1, the ECG or peripheral gating (PG) signal trig-gers a DIR preparation period to null the signal from flow-ing blood [21]. After the null point of blood, data are collected using a radial FSE acquisition scheme. The angu-lar order of radial views is chosen to minimize artifacts from T2decay and motion as well as to provide good
k-space coverage for each TE data set [22].
In vivo imaging
Data were acquired in a breath hold (16-22 s depending on heart rate) using an 8-channel phased-array receiver coil with ETL = 16, for a total of 256 radial views with 256 read-out points per view. The total number of radial views per TE was 16 (~4% sampling relative to the Nyquist condi-tion). Other parameters were: TR = 1RR, slice thickness = 8 mm, field-of-view (FOV) = 48 × 48 cm2, and BW = ± 31.25 kHz. In this work we used PG triggering because it naturally adds ~200 ms to the time between the R-wave and the trigger pulse. When adding the PG delay to the in-version time (TI) for nulling blood (300-400 ms for heart rates in the range of 60-80 bpm and TR = 1RR), the FSE acquisition is naturally timed to start in diastole. Saturation bands were placed within the TI period, prior to data ac-quisition, to suppress unwanted signal from structures within and outside the FOV. Chemical-shift selective satur-ation was used for fat suppression. Patients were scanned with the DIR-RADFSE pulse sequence as part of a clinical CMR exam. For these subjects Late Gadolinium Enhance-ment (LGE) images were acquired during the systolic phase of the cardiac cycle, 10 to 15 minutes after the intra-venous injection of MultiHance (gadobenate dimeglumine, Bracco Diagnostics Inc., USA).
Phantom study
Phantoms with 6 different T2values were prepared using
MnCl2solutions (50 μM, 75 μM, and 150μM) or agar
gels at different concentrations (0.6%, 1.2%, and 2.0%) mixed with 1.5 mM NiCl2(to adjust the T1to ~ 900 ms).
The phantoms covered T2 values in the range of
38-170 ms.
The phantoms were imaged with the DIR-RADFSE pulse sequence with the same parameters described above except for FOV = 24 × 24 cm2; the heart rate was simulated to 60 bpm so that TR = 1 s. T2 mapping was
performed using the ES and the CURLIE-SEPG algo-rithms, as described below. A region of interest (ROI) was manually drawn to encompass all the pixels within the phantom and the mean T2 was obtained for each
ROI. T2measurements were also carried out with a
Carte-sian single-echo spin-echo pulse sequence with TE = 9, 18, 27, and 36 ms, TR = 3 seconds, and matrix size = 128 × 64. The latter method was used as a reference for T2
estima-tion without the effect of indirect echoes. The reference T2 values were calculated by fitting the TE images to a
single exponential signal model using least-squares fitting.
Image reconstruction and T2mapping
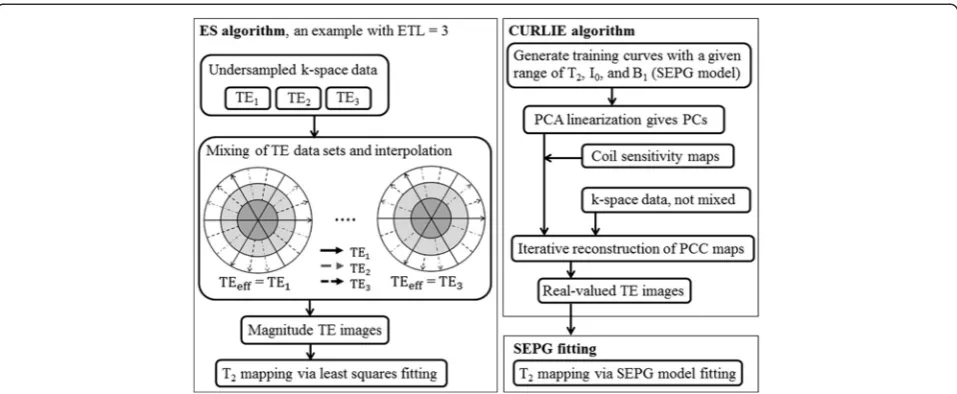
All algorithms were implemented in Matlab (MathWorks, Natick, MA). Figure 2 shows a flow chart for the ES and CURLIE algorithms used for the reconstruction of TE images from highly undersampled data. As indicated in the figure, the ES approach mixes radial views acquired at different TEs to form k-space data sets weighted to the TE of the data in the center. The TE k-space data sets are used to reconstruct magnitude images at different effec-tive TEs (TEeff) for each receiver coil using filtered
back-projection. The sum-of-squares of the individual receiver
coil images is used to obtain the TE images that are used in the T2estimation. The TE images are fit to a single
ex-ponential signal model using least-squares fitting to obtain the T2map.
CURLIE is a model-based reconstruction algorithm where the TE data sets are not mixed but used in an iterative manner by fitting the expected signal model to the acquired TE data [20]. A general frame work for model-based reconstructions for FSE data is given below:
^
θ¼argminθ X
n FTn Snðθ;T EnÞ
−Kn 2 ;
n
ð1Þ
where FT(⋅) is the forward Fourier transform and S(.) describes the model of the signal in the image domain according to a set of parameters θ and the TE time points. Kn are the acquired k-space data atTEn, the TE
at the nth SE point. Equation (1) minimizes the differ-ence between the acquired k-space data and the signal model by iterating over the values ofθ.
To account for the effect of indirect echoes in the sig-nal model we use the Slice-resolved Extended Phase Graph (SEPG) model developed by Lebel and Wilman [23]. SEPG incorporates the effects of flip angle imper-fections through a known slice profile (e.g., along z). Given the flip angles of the excitation pulse (α0(z)) and
refocusing pulses (αn(z); n= 1,…, ETL), the sensitivity of
the transmit B1 field, and the Io,T2, and T1, the signal
intensity of thenthecho point can be represented by:
Sn¼I0
Z
EPG Tð 1;T2;B1;α0ðzÞ;⋯;αnðzÞ;nÞdz ð2Þ
[image:3.595.58.541.89.269.2]We have previously shown that non-linear equations (such as (2)) make model-based reconstruction un-stable. To overcome this problem we developed a
principal-component based reconstruction, where a linear approximation to the signal model based on principal components (PCs) is used [24]. Thus, Eq. (1) can be reformulated as:
b
M¼argminM
XL
n¼1 FT MbP T n
−Kn
2
n o
; ð3Þ
where Pb is the matrix consisting of the vectors of PCs, generated by singular value decomposition from a set of T2training curves.Mis the vector of the PC coefficients
and is obtained using a conjugate gradient minimization algorithm. TE images are then generated from the ma-trix of PC coefficients,Mb, andP.b
The algorithm used in this work, incorporates complex coil sensitivities (Cj) and a penalty term that exploits the spatial compressibility of the PC coefficient maps accor-ding to the compressed sensing theory [25] into Eq. (3):
b
M¼argminM X#coils
j¼1
XL
n¼1FT CjMP^ T n
−Kj;n 2þ X
iλiPenaltyið ÞM
o:
n
ð4Þ
The steps of the CURLIE-SEPG algorithm are summa-rized in Figure 2. The training curves for obtaining the PCs were derived using the SEPG model for T2= 30-300 ms
(increment = 1 ms) and B1= 0.8-1.2 (increment = 0.05).
Since SEPG fitting is rather insensitive to T1 [20,23] we
fixed T1= 1000 ms based on the literature values for
myo-cardium [26]. The number of PCs used was 6. The penalty term in (4) consisted of the 1-norms of the wavelet trans-form (Daubechies 4, code obtained from http://www-stat. stanford.edu/~wavelab) and the total variation of the PC coefficient maps. A weight of 0.005 was used for the
penalty terms. The coil sensitivities were calculated by div-iding the complex images for each coil by the sum-of-squares of the images for all coils. The complex coil im-ages used for the coil sensitivity estimation were obtained by combining k-space data from all TEs (i.e., data from 256 radial views) followed by filtered-back projection. The coil sensitivity maps were smoothed to reduce noise. Once the TE images were generated from Mb and Pb, T2maps
were obtained via SEPG fitting using Eq. (2).
Reproducibility study
T2estimation was compared among reconstruction
algo-rithms using the mean T2 values of a ROI manually
drawn on the left ventricle (LV). In the reproducibility study, mean T2 estimates from each experiment were
compared using the Bland-Altman analysis.
Results
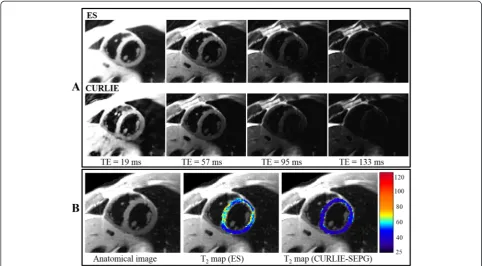
T2Estimation with DIR-RADFSE
Images reconstructed from DIR-RADFSE data acquired in a single breath hold for a normal volunteer are shown in Figure 3. Figure 3A shows 4 (out of 16) images at different TEs obtained from the undersampled data sets (16 radial views per TE) using the ES and the CURLIE reconstruc-tion algorithms. Figure 3B (left) shows the image gene-rated from the full k-space radial data set (256 radial views). This type of image (referred throughout this paper as the anatomical image) has a T2-weighted contrast
comparable to a TE of 57 ms. Figure 3B also shows the colorized T2maps of the LV myocardium overlaid on the
[image:4.595.59.538.88.285.2]anatomical image for both ES and CURLIE-SEPG. Note
Figure 2Flow charts of the ES and the CURLIE algorithms.The left panel shows a diagram for the generation of TE images with the ES algorithm by mixing TE data in k-space. For simplicity an ETL = 3 is used in the diagram (compared with ETL = 16 used in this paper). T2maps are
generated after a least-squares fitting of the magnitude TE images. The right panel outlines the main steps for the generation of the TE images based on the CURLIE algorithm. T2maps are generated after SEPG fitting of the complex TE images.
that the ES reconstruction yields higher T2values than the
CURLIE-SEPG algorithm. This can also be observed by the slightly slower signal decay of the myocardium in the ES TE images compared to the CURLIE reconstruction.
T2estimation on phantoms (Table 1) showed the same
trend. Note that T2estimates are higher with the ES
re-construction than with CURLIE-SEPG. The latter were closer to the reference T2values obtained from a
single-echo spin-single-echo experiment. The T2estimation error was
0.6-2.1% for CURLIE-SEPG and 7.5-13.9% for ES. The standard deviations were also smaller with CURLIE-SEPG than ES.
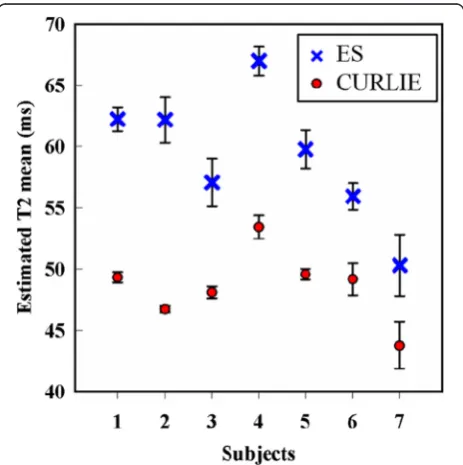
Reproducibility study
To evaluate the reproducibility of T2mapping with
DIR-RADFSE we imaged 7 healthy volunteers; each subject was imaged twice during the same imaging session. T2
maps were generated with the ES and the CURLIE-SEPG algorithms to test the effect of reconstruction on the reproducibility of T2 mapping. The Bland-Altman plots
(Figure 4) and analysis (Table 2) show high agreement between T2 values from repeated measures for both
re-construction algorithms. The mean T2 difference was
[image:5.595.56.539.89.355.2]slightly lower with CURLIE-SEPG (0.09 ms) than with ES (0.58 ms). The coefficient of repeatability were 2.97 for
Figure 3Images of a healthy volunteer obtained with DIR-RADFSE. (A)The TE images are reconstructed from undersampled data sets (16 radial views per TE) using the ES and the CURLIE algorithms.(B)The anatomical image, reconstructed by filtered back-projection using the full k-space data set (all 256 radial views), and a colorized T2map of the left ventricle myocardium overlaid on the anatomical image are displayed for
both algorithms. The anatomical image, TE images and T2maps are generated from the same k-space data (acquired in a single breath hold).
Table 1 Mean and standard deviation (stdev) of T2estimates on phantoms with different T2values
Gold standard ES CURLIE-SEPG
T2(ms) T2mean (ms) T2stdev (ms) % error T2mean (ms) T2stdev (ms) % error
38 43.28 4.74 13.89 38.80 1.24 2.11
55 60.71 5.10 10.38 55.79 2.72 1.44
75 81.16 6.67 8.21 75.97 2.93 1.29
78 85.00 6.83 8.97 78.46 2.49 0.59
112 120.88 9.41 7.93 112.73 4.64 0.65
170 182.69 9.65 7.46 171.60 6.12 0.94
[image:5.595.58.540.614.724.2]CURLIE-SEPG and 4.85 for ES, also indicating slightly better reproducibility with CURLIE-SEPG.
In agreement with the results shown above, the T2
es-timates obtained with ES were higher than those with CURLIE-SEPG for all 7 volunteers, as shown in Figure 5.
T2mapping with DIR-RADFSE and CURLIE-SEPG in
clinical CMR
An example of DIR-RADFSE in a subject diagnosed with hypertrophic cardiomyopathy and ventricular ectopy is shown in Figure 6. The top panel shows 3 out of the 16 TE images reconstructed from undersampled TE data (16 radial views per TE) using CURLIE. The bottom panel shows the anatomical image together with the colorized T2map of the LV overlaid on the anatomical
image. The LGE image is also shown in the figure. There are areas of high T2signal in the lateral and inferior LV
wall and the RV insertion points which correspond to areas of fibrosis seen on the LGE image. In addition, the TE images and T2 map reveal a focal area of high T2
(T2> 120 ms) in the anterior and antero-septal segment
(as indicated by the arrow) with no matching area of fibrosis on the LGE image, suggesting the presence of edema. This is consistent with recent reports [1,27-30], where T2imaging was found to be a more sensitive tool
of edematous inflammatory processes than LGE.
Another case for a subject with a history of cardiomyo-pathy, coronary artery disease, and a myocardial infarction
incidence, is shown in Figure 7. The infarct region is typi-cally characterized by a thinning of the myocardial wall as well as by the presence of sub-endocardial and/or trans-mural scar. In this patient, predominantly sub-endocardial scar tissue can be seen as an area of bright signal in the LGE image in the inferior and infero-lateral wall (arrow). The clinical findings for this patient did not indicate the presence of edema. The DIR-RADFSE images are in concordance with the LGE images showing the thinned myocardial wall and higher T2 values around the region
[image:6.595.60.540.89.213.2]corresponding to scarred tissue in the LGE image. The average T2around the scarred region (arrow) was ~89 ms. Figure 4Bland-Altman plots for the (A) ES and (B) CURLIE-SEPG reconstructions.Each point in the figure shows the mean T2estimates
(x-axis) and the difference in the pair of T2estimates (y-axis). The central horizontal lines in each plot are the mean of the differences in the pairs
of T2estimates. The outer dotted horizontal lines mark the lower/upper limits of agreement, calculated as: mean T2difference ± 1.96 × standard
[image:6.595.306.538.441.674.2]deviation of T2differences.
Table 2 Bland-Altman analysis Reconstruction
algorithm
Limits of agreement (ms) Coefficient of
repeatabilitya Mean
ΔT2
Lower limit
Upper limit
ES 0.58 −4.27 5.43 4.85
CURLIE-SEPG 0.09 −2.88 3.06 2.97
a
Coefficient of repeatability is defined as 1.96 times the standard deviation of the T2differences between the two measurements. Thus, a lower coefficient of
repeatability indicates higher reproducibility.
Figure 5Plot of mean T2values of the left ventricle myocardium
in healthy subjects.Data for 7 healthy subjects are shown for T2
estimates obtained with the ES and the CURLIE-SEPG algorithms. In all subjects, T2values are higher with the ES algorithm compared to the
CURLIE-SEPG algorithm.
[image:6.595.55.292.643.708.2]In contrast, the rest of the myocardium had the average T2of ~53 ms. The slight increase in T2in this case might
be due to fluid in the extracellular space within the scar.
Discussion
In this work, we introduced and evaluated a black-blood radial FSE imaging technique, DIR-RADFSE, for T2
map-ping of the heart. Using the DIR-RADFSE pulse sequence combined with algorithms tailored to reconstruct highly undersampled data we have shown that we can obtain as many as 16 TE images with high spatial resolution from data acquired in a single breath hold. Since all TE points are collected within each TR period, misregistration bet-ween data sets is minimized, and T2 mapping can be
performed voxel-wise without the need of image registra-tion. The radial acquisition has also an advantage over
Cartesian trajectories for CMR applications due to its in-herent robustness to motion [18,19].
The limited number of k-space lines available at each TE requires reconstruction algorithms that can compen-sate for the effects of undersampling. The algorithms evaluated in this work, ES and CURLIE-SEPG, have been designed to reconstruct TE images from undersampled radial data. In sets of data acquired on 7 volunteers, both algorithms have shown to yield highly reproducible T2
maps. However, the estimated T2 values were higher
with the ES algorithm than with CURLIE-SEPG.
The T2overestimation by ES comes from several
fac-tors. Indirect echoes, which are a consequence of imper-fections associated with the refocusing pulses in multiple echo pulse sequences, are known to lead to T2
[image:7.595.57.540.89.247.2]overesti-mation. The major difference and the benefit of the new algorithm, CURLIE combined with SEPG fitting, is that
Figure 6Images of a subject diagnosed with hypertrophic cardiomyopathy.(Top) Three out of the 16 TE images reconstructed from undersampled data sets (16 radial views per TE) using CURLIE. (Bottom) The anatomical image, reconstructed by filtered back-projection using the full k-space data set (all 256 radial views), is shown on the lower left panel. The colorized T2map of the left ventricle overlaid onto the anatomical
image is displayed in the lower middle panel for CURLIE-SEPG. The LGE image is shown in the lower right panel.
Figure 7Images of a patient with myocardial infarct scar.(Top) Three out of the 16 TE images reconstructed from undersampled data sets (16 radial views per TE) using CURLIE. (Bottom) The anatomical image, reconstructed by filtered back-projection using the full k-space data set (all 256 radial views), is shown on the lower left panel. The colorized T2map of the left ventricle overlaid onto the anatomical image is displayed
[image:7.595.56.541.532.685.2]it incorporates the effect of indirect echoes in the signal model thus, reducing T2overestimation.
The magnitude reconstruction used to obtain the TE images in the ES algorithm is also a source of T2
over-estimation. Taking the magnitude of the data causes the noise distribution to become non-Gaussian (i.e. strictly positive) for data with low signal-to-noise ratio (SNR) [31]. Thus, for data at the latter TEs (where the SNR may be compromised) the magnitude operation artifi-cially increases the signal intensity of these time points, which in turn yields higher T2 values. This is not
spe-cific to the ES algorithm but to every algorithm that is based on a magnitude reconstruction (note that we have used a magnitude operation for the reference spin-echo data, however the SNR of the reference scan was higher because the data was fully sampled). In contrast, the model-based CURLIE algorithm does not suffer from the problems associated with a magnitude reconstruc-tion because the data fitting is done in k-space using complex data [20,24].
TE mixing in the ES algorithm can also cause T2
over-estimation [17]. As can be seen in Figure 2, TE mixing increases from the center to the outer part of k-space (the high spatial frequency region). This affects the T2
estimation of objects with high spatial frequency content as the edges of the myocardial wall.
An advantage of the ES reconstruction is its recon-struction speed compared to the CURLIE-SEPG method, which is based on an iterative and more com-putationally expensive algorithm. Improvements of the ES reconstruction, such as incorporating a thicker refocusing slice [32] or using a spoiler gradient editing method [33-35] for reducing the effects of indirect echoes as well as implementing a reconstruction based on the fitting of complex data, can alleviate T2
overestimation.
DIR-RADFSE is a black-blood imaging method which relies on the suppression of flowing blood. As reported before, a drawback of black-blood T2-weighted images
(e.g., the triple IR method) is that the high signal inten-sity of stagnant (unsuppressed) blood makes it difficult to differentiate edema from blood stasis at the infarct-tissue border [1,36]. The advantage over the conventional triple IR method is that DIR-RADFSE yields T2maps, in addition
to the T2-weighted images, allowing for a“quantitative”
as-sessment of the myocardium. Thus, with DIR-RADFSE we expect that the signal from blood stasis should be dif-ferentiated from the myocardium based on differences in T2values provided that the spatial resolution is adequate
to resolve the endocardial region from the blood pool. Another advantage of using T2 values to characterize
changes in the myocardium instead of differences in signal intensity (as done with conventional triple IR methods) is the insensitivity of T2maps to coil sensitivities.
Conclusions
In this work, we present results of cardiac T2mapping
using the DIR-RADFSE technique. DIR-RADFSE yields TE images with high spatial and temporal resolution from data acquired in a single breath hold. Since the ac-quired data per TE time point are highly undersampled, two algorithms were evaluated for image reconstruction and T2 mapping: the echo sharing (ES) algorithm and
the model-based CURLIE-SEPG algorithm. Although both algorithms yielded reproducible T2maps,
CURLIE-SEPG yielded T2estimates that are closer to a reference
standard, the single-echo spin-echo method. This is consistent with the fact that CURLIE-SEPG compensates for the effect of indirect echoes. The technique can have a significant impact in the detection of pathologies char-acterized by abnormal T2values.
Competing interests
The authors declare that they have no competing interests.
Authors’contributions
TH carried out the experiments including image acquisition, reconstruction, and analysis of data; drafted the manuscript. CH was involved in the implementation of the reconstruction algorithms, phantom experiments; edited the manuscript. AA conceptualized the studies and the workflow, performed the clinical diagnosis and interpreted the in-vivo MRI images; edited the manuscript. JS participated in the image acquisition and helped understanding the cardiac pathology. BA participated in the image acquisition and helped in the recruitment of subjects. SS acquired the MRI data and managed data for in-vivo studies. DB helped with subject recruitment and data management. MIA conceptualized the studies and the workflow, directed experiments and data analysis, and help writing the manuscript. All authors read and approved the final manuscript.
Acknowledgement
NIH grant R01HL085385 and the Edward and Virginia Madden Award.
Author details
1Biomedical Engineering Graduate Interdisciplinary Program, University of Arizona, Tucson, Arizona, USA.2Department of Mathematics, University of Arizona, Tucson, Arizona, USA.3Departments of Radiology and Psychiatry, Stony Brook University, Stony Brook, New York, USA.4Department of Medicine, University of Arizona, Tucson, Arizona, USA.5Arizona Sarver Heart Center, University of Arizona, Tucson, Arizona, USA.6Department of Medical Imaging, University of Arizona, Tucson, Arizona, USA.
Received: 24 July 2014 Accepted: 31 December 2014
References
1. Abdel-Aty H, Zagrosek A, Schulz-Menger J, Taylor AJ, Messroghli D, Kumar A, et al. Delayed enhancement and T2-weighted cardiovascular magnetic resonance imaging differentiate acute from chronic myocardial infarction. Circulation. 2004;109(20):2411–6.
2. Cury RC, Shash K, Nagurney JT, Rosito G, Shapiro MD, Nomura CH, et al. Cardiac magnetic resonance with T2-weighted imaging improves detection of patients with acute coronary syndrome in the emergency department. Circulation. 2008;118(8):837–44.
3. Friedrich MG, Abdel-Aty H, Taylor A, Schulz-Menger J, Messroghli D, Dietz R. The salvaged area at risk in reperfused acute myocardial infarction as visualized by cardiovascular magnetic resonance. J Am Coll Cardiol. 2008;51(16):1581–7.
4. Ubachs JF, Engblom H, Erlinge D, Jovinge S, Hedström E, Carlsson M, et al. Cardiovascular magnetic resonance of the myocardium at risk in acute reperfused myocardial infarction: comparison of T2-weighted imaging
versus the circumferential endocardial extent of late gadolinium enhancement with transmural projection. J Cardiovasc Magn Reson. 2010;12:18.
5. Francone M, Bucciarelli-Ducci C, Carbone I, Canali E, Scardala R, Calabrese FA, et al. Impact of primary coronary angioplasty delay on myocardial salvage, infarct size, and microvascular damage in patients with ST-segment elevation myocardial infarction: insight from cardiovascular magnetic resonance. J Am Coll Cardiol. 2009;54(23):2145–53.
6. Eitel I, Desch S, Fuernau G, Hildebrand L, Gutberlet M, Schuler G, et al. Prognostic significance and determinants of myocardial salvage assessed by cardiovascular magnetic resonance in acute reperfused myocardial infarction. J Am Coll Cardiol. 2010;55(22):2470–9.
7. Abdel-Aty H, Cocker M, Strohm O, Filipchuk N, Friedrich MG. Abnormalities in T2-weighted cardiovascular magnetic resonance images of hypertrophic cardiomyopathy: regional distribution and relation to late gadolinium enhancement and severity of hypertrophy. J Magn Reson Imaging. 2008;28(1):242–5.
8. Eitel I, von Knobelsdorff-Brenkenhoff F, Bernhardt P, Carbone I, Muellerleile K, Aldrovandi A, et al. Clinical characteristics and cardiovascular magnetic resonance findings in stress (takotsubo) cardiomyopathy. JAMA. 2011;306(3):277–86.
9. Yelgec NS, Dymarkowski S, Ganame J, Bogaert J. Value of MRI in patients with a clinical suspicion of acute myocarditis. Eur Radiol. 2007;17(9):2211–7. 10. Florian A, Jurcut R, Ginghina C, Bogaert J. Cardiac magnetic resonance
imaging in ischemic heart disease: a clinical review. J Med Life. 2011;4(4):330–45.
11. Kim D, Jensen JH, Wu EX, Sheth SS, Brittenham GM. Breathhold multiecho fast spin-echo pulse sequence for accurate R2 measurement in the heart and liver. Magn Reson Med. 2009;62(2):300–6.
12. Huang TY, Liu YJ, Stemmer A, Poncelet BP. T2 measurement of the human myocardium using a T2-prepared transient-state TrueFISP sequence. Magn Reson Med. 2007;57(5):960–6.
13. Giri S, Chung YC, Merchant A, Mihai G, Rajagopalan S, Raman SV, et al. T2 quantification for improved detection of myocardial edema. J Cardiovasc Magn Reson. 2009;11:56.
14. Giri S, Shah S, Xue H, Chung YC, Pennell ML, Guehring J, et al. Myocardial T2 mapping with respiratory navigator and automatic nonrigid motion correction. Magn Reson Med. 2012;68(5):1570–8.
15. Altbach MI, Barr T, Singh J, Ainapurapu B, KC D, Squire S, et al. T2 mapping of the heart with high temporal and spatial resolution using a radial double inversion fast spin-echo pulse sequence with view sharing. J Cardiovasc Magn Reson. 2012;14 Suppl 1:O112.
16. Barr T, Huang C, Bilgin A, Abidov A, Altbach MI. Indirect Echo Corrected Fast T2 mapping of the Heart from Highly Undersampled Radial FSE Data Using the CURLIE Reconstruction. Proc Intl Soc Mag Reson Med. 2013;21:1420. 17. Altbach MI, Bilgin A, Li Z, Clarkson EW, Trouard TP, Gmitro AF. Processing of
radial fast spin-echo data for obtaining T2 estimates from a single k-space data set. Magn Reson Med. 2005;54(3):549–59.
18. Glover GH, Pauly JM. Projection reconstruction techniques for reduction of motion effects in MRI. Magn Reson Med. 1992;28(2):275–89.
19. Ferreira PF, Gatehouse PD, Mohiaddin RH, Firmin DN. Cardiovascular magnetic resonance artefacts. J Cardiovasc Magn Reson. 2013;15:41. 20. Huang C, Bilgin A, Barr T, Altbach MI. T2 relaxometry with indirect echo
compensation from highly undersampled data. Magn Reson Med. 2013;70(4):1026–37.
21. Simonetti OP, Finn JP, White RD, Laub G, Henry DA. "Black blood" T2-weighted inversion-recovery MR imaging of the heart. Radiology. 1996;199(1):49–57. 22. Theilmann RJ, Gmitro AF, Altbach MI, Trouard TP. View-ordering in radial fast
spin-echo imaging. Magn Reson Med. 2004;51(4):768–74. 23. Lebel RM, Wilman AH. Transverse relaxometry with stimulated echo
compensation. Magn Reson Med. 2010;64(4):1005–14.
24. Huang C, Graff CG, Clarkson EW, Bilgin A, Altbach MI. T2 mapping from highly undersampled data by reconstruction of principal component coefficient maps using compressed sensing. Magn Reson Med. 2012;67(5):1355–66.
25. Doneva M, Börnert P, Eggers H, Stehning C, Sénégas J, Mertins A. Compressed sensing reconstruction for magnetic resonance parameter mapping. Magn Reson Med. 2010;64(4):1114–20.
26. Messroghli DR, Plein S, Higgins DM, Walters K, Jones TR, Ridgway JP, et al. Human myocardium: single-breath-hold MR T1 mapping with high spatial resolution-reproducibility study. Radiology. 2006;238(3):1004–12. 27. Eitel I, Kubusch K, Strohm O, Desch S, Mikami Y, de Waha S, et al. Prognostic
value and determinants of a hypointense infarct core in T2-weighted cardiac
magnetic resonance in acute reperfused ST-elevation-myocardial infarction. Circ Cardiovasc Imaging. 2011;4(4):354–62.
28. Abdel-Aty H, Simonetti O, Friedrich MG. T2-weighted cardiovascular magnetic resonance imaging. J Magn Reson Imaging. 2007;26(3):452–9. Review.
29. Edwards NC, Routledge H, Steeds RP. T2-weighted magnetic resonance imaging to assess myocardial oedema in ischaemic heart disease. Heart. 2009;95(16):1357–61.
30. Wright J, Adriaenssens T, Dymarkowski S, Desmet W, Bogaert J.
Quantification of myocardial area at risk with T2-weighted CMR: comparison with contrast-enhanced CMR and coronary angiography. JACC Cardiovasc Imaging. 2009;2(7):825–31.
31. Gudbjartsson H, Patz S. The Rician distribution of noisy MRI data. Magn Reson Med. 1995;34(6):910–4.
32. Pell GS, Briellmann RS, Waites AB, Abbott DF, Lewis DP, Jackson GD. Optimized clinical T2 relaxometry with a standard CPMG sequence. J Magn Reson Imaging. 2006;23:248–52.
33. Poon CS, Henkelman RM. Practical T2 quantitation for clinical applications. J Magn Reson Imaging. 1992;2:541–53.
34. Majumdar S, Orphanoudakis SC, Gmitro A, O’Donnell M, Gore JC. Errors in the measurements of T2 using multiple-echo MRI techniques. I. Effects of radiofrequency pulse imperfections. Magn Reson Med. 1986;3:397–417. 35. Does MD, Snyder RE. Multiecho imaging with suboptimal spoiler gradients.
J Magn Reson Imaging. 1998;131:25–31.
36. Viallon M, Mewton N, Thuny F, Guehring J, O'Donnell T, Stemmer A, et al. T2-weighted cardiac MR assessment of the myocardial area-at-risk and salvage area in acute reperfused myocardial infarction: Comparison of state-of-the-art dark blood and bright blood T2-weighted sequences. J Magn Reson Imaging. 2012;35:328–39.
Submit your next manuscript to BioMed Central and take full advantage of:
• Convenient online submission
• Thorough peer review
• No space constraints or color figure charges
• Immediate publication on acceptance
• Inclusion in PubMed, CAS, Scopus and Google Scholar
• Research which is freely available for redistribution