BIROn - Birkbeck Institutional Research Online
Fenner, Trevor and Levene, Mark and Kaufmann, Eric P. and Loizou, George
(2017) A multiplicative process for generating a beta-like survival function
with application to the UK 2016 EU referendum results. International Journal
of Modern Physics C 28 (11), p. 1750132. ISSN 0129-1831.
Downloaded from:
Usage Guidelines:
Please refer to usage guidelines at or alternatively
A multiplicative process for generating a beta-like survival
function with application to the UK 2016 EU referendum results
Trevor Fenner [email protected], Eric Kaufmann [email protected]2, Mark Levene [email protected], and George Loizou [email protected]1
1Department of Computer Science and Information Systems 2Department of Politics, Birkbeck, University of London
London WC1E 7HX, U.K.
Abstract
Human dynamics and sociophysics suggest statistical models that may explain and provide us with better insight into social phenomena. Contextual and selection effects tend to produce extreme values in the tails of rank-ordered distributions of both census data and district-level election outcomes. Models that account for this nonlinearity generally outperform linear models. Fitting nonlinear functions based on rank-ordering census and election data therefore improves the fit of aggregate voting models. This may help improve ecological inference, as well as election forecasting in majoritarian systems.
We propose a generative multiplicative decrease model that gives rise to a rank-order distribution, and facilitates the analysis of the recent UK EU referendum results. We supply empirical evidence that the beta-like survival function, which can be generated directly from our model, is a close fit to the referendum results, and also may have predictive value when covariate data are available.
Keywords: referendum results, generative model, multiplicative process, rank-order
distribu-tion, beta-like survival function
1
Introduction
Social and technological networks are examples of complex social systems [Bar07], giving rise to human dynamics that may be explained by generative stochastic processes. The study of human behaviour has a wider remit than the study of networks, similar to the goals of
sociophysics[Gal08, SC14], where notions from statistical physics are used to examine social
One method which helps in understanding human dynamics is the specification of a
gene-rative modelthat defines a stochastic process, resulting in a power law or another distribution
demonstrating the possible evolution of a complex system [FLL15]. Early exponents of the generative model method were Simon [Sim55] and, more recently, Barab´asi’s group [AB02] and other researchers [BSV07]. The objective of such research has a similar vision to that of
social mechanisms[HS98], which explore the procedures or mechanisms that help us
under-stand known social phenomena.
In this paper, we employ the multiplicative process [Mit04, Zan08] introduced in [FLL17], which is described by the same underlying equations as the generative model proposed in [FLL15] (see Subsection 2.1). This was designed to capture the essential dynamics of survival analysis applications [KK12]. As in [FLL17], we introduce rank-ordering into the model as a natural mechanism in situations where there is no intrinsic ordering of the data, such as constituency-based election results [FLL17] or, as in this paper, regional referendum results (see Subsection 3.1). Rank-ordering [SKKV96] is a technique in which we rank the data objects according to some numerically described feature. We then plot this feature against rank, and finally analyse the resulting distribution. Examples of rank-order distributions are: the distribution of large earthquakes [SKKV96], Zipf’s rank-frequency distribution [MH99], the size distribution of cities [BGVV99], and the distribution of historical extreme events [CTT+12].
In many real-world situations, Zipf’s distribution, or more generally a power-law distri-bution, may only manifest itself for small and intermediate ranks, while for larger ranks a more pronounced cutoff is observed [MAB+09]. This has led researchers to combine these two regimes into a single distribution, calledthe beta-like function[NC08, MAB+09] (see
Sub-section 2.2), which appears to exhibit universal behaviour for rank-order distributions and is asymptotically a beta distribution [JKB95]. Whereas, in [NC08], the beta-like function is shown to be indirectly linked to a multinomial multiplicative process, here we introduce the
beta-like survival functionas a direct and intuitive consequence of a multiplicative decrease
process, where an attrition function controls the rate of decrease of the survival function at each stage of the process. In Section 2.2, we will show that our beta-like survival function can be approximated by the beta-like function. In particular, the attrition function is a mixture of preferential (cf. preferential attachment [AB02]) and uniform attrition mechanisms, where the former is inversely proportional to the rank of the voting district and the latter is uniform over the voting districts.
The main contribution of the paper is to demonstrate the suitability of the beta-like survival function − a rank-ordered distribution generated from a multiplicative process −
for modelling the UK 2016 EU regional referendum results (see Subsection 3.2). The EU referendum involved a binary choice, where voters had to choose between remaining in or leaving the EU. Voting behaviour in referenda often exhibits greater volatility than that found in general elections [LeD02]. In a referendum, parties are often internally divided over the issues, so party ideology is less of an issue than in a general election. Moreover, uncertainties can introduce shifts in opinion when doubts are raised on important issues during the course of a campaign. The UK EU referendum, also known as the “Brexit” referendum, will be analysed for many years to come, as it is considered a momentous event in the history of Europe.
specifications predict little of the variation in individual-level voting. Yet there is a quandary. At the aggregate level, census-based socioeconomic models account for much of the variation in seat-level outcomes. While scholars of voting downplay socio-demographics, these are enjoying a renaissance among election forecasters, who have augmented polls with census data to refine seat-level predictions [Sil12]. These outperform blanket vote-to-seat conversion rules such as the cube law [KS50]. Panel studies deploying aggregate data, which consider the effects of variables such as economic change, “homegrown” candidacy and incumbency on election results, perform extremely well in predicting seat-level changes over time [Fai09]. In this paper, we show how the use of a rank-ordered distribution can improve the accuracy of aggregate-level models (see Subsection 3.3). In particular, we focus on Britain’s referendum on whether to leave the European Union. Held on 23 June 2016, the Leave side won an unexpected 52-48 percent victory.
2
A multiplicative process for generating a rank-order
distri-bution
We next present a generative model in the form of a multiplicative process [Mit04, Zan08] that can also be viewed as a survival model, similar to the one introduced in [FLL15] in the context of human dynamics; this model was first introduced in [FLL17] but, for completeness, we repeat it in Subsection 2.1 in the context of a referendum, and then introduce the beta-like survival function in Subsection 2.2.
2.1 The dynamics of the multiplicative process
In its simplest form, a multiplicative process generates a log-normal distribution [JKB94, LSA01], and has applications in many fields, such as economics, biology and ecology [Mit04]. The solution to the multiplicative process we propose will be utilised in Section 3.1, in the context of a rank-ordered model of the proportion of votes attained for a particular answer in a multiple-choice question referendum.
We assume a countable number of indices where, for a given answer, the ith index repre-sents theith district ranked in descending order of the number of votes for that answer. For any stage s,s≥0, we let µ(i, s), 0≤µ(i, s) ≤1, be the probability that a potential vote is “lost” in theith district at that stage. Usuallyµ(i, s) is known as themortality rate function, but here we prefer to call it the attrition function, which is more descriptive in the context of voting. We always require thatµ(0, s) = 0 for all s.
We now letF(i, s), 0≤F(i, s)≤1, be a discrete function representing, for a given answer, the expected proportion of the popular vote potentially attainable for that answer in district
iat stage s. Initially, we set F(0,0) = 1 for a dummy district 0, and F(i,0) = 0 for alli >0. The dynamics of the multiplicative process is captured by the following two equations:
F(0, s) = 1 for s≥0, (1)
and
Equations (1) and (2) define the expected behaviour of a stochastic process [Ros96] descri-bing how, asiincreases, the vote decreases in districts where the given answer is less popular. For any particular vote, the attrition function is the probabilistic mechanism that decides whether the vote will be “lost” or not. The process obeys Gibrat’s law [Eec04], which in its original form states that the proportional rate of growth of a firm is independent of its absolute size. In our context, Gibrat’s law states that the proportional rate of decrease in the popular vote is independent of the actual number of votes cast for the given answer in the district.
As in [FLL15], we approximate the discrete function F(i, s) by a continuous function
f(i, s), andµ(i, s) is now also a continuous function; f(i, s) is known as thesurvival function. Initially, we have f(0, s) = 1 for alls, and f(i,0) = 0 for alli >0.
The dynamics of the model is now captured by the first-order hyperbolic partial differential equation [Lax06],
∂f(i, s)
∂s +
∂f(i, s)
∂i +µ(i, s)f(i, s) = 0, (3)
which is the same as that encountered in age-structured models of population dynamics [Cha94].
Eq. (3) is the well-known transport equation in fluid dynamics [Lax06], and the renewal
equation in population dynamics [Cha94]. Following Eq. (1.22) in [Cha94], the solution of
Eq. (3), when i≤s, is given by
f(i, s) = exp
−
Z i
0
µ(i−t, s−t)dt
. (4)
As noted above, f(i, s) is well-defined as long as i≤ s holds. In practice, s is bounded above by the number of voting districts, say n, and so onlyn stages of Eq.(2) are necessary.
2.2 The beta-like survival function
The beta-like function[NC08, MAB+09], see Eq. (7) below, is a discrete version of the beta
distribution [JKB95], which has been shown to be a very good fit for a variety of rank-ordered data distributions. Here we propose the similar beta-like survival function, which is derived from Eq. (4) using specific attrition function introduced in Eq. (5) below. In [NC08], an argument is given that relates the beta-like function to a multinomial multiplicative process, while here we show that it can be derived as a direct consequence of the multiplicative process introduced in Section 2 with the attrition function in Eq. (5).
We now derive the beta-like survival function from Eq. (4) by introducing the following attrition function, which is a mixture of rank-dependent and rank-independent attrition:
µ(i, s) = α
i+κ + β
s, (5)
whereα, β and κ are positive constants, and i≤s.
componentβ/s modelsuniform attrition at stage s, where we note that sis bounded above by the number of voting districtsn.
Preferential attrition might occur, for instance, because a district’s rank in terms of its Brexit vote share may exert a contextual effect on the voting decisions of its constituent individuals; or may attract voters to move from other districts with similar political charac-teristics; or may produce an increased supply of local election volunteers. All these could produce positive feedback.
Thus, from Eq. (4), it follows that the survival function is given by
f(i, s) = exp
αln
κ i+κ
+βln
1− i
s
=
κ i+κ
α
1− i
s
β
. (6)
We callf(i, s) thebeta-like survival function, motivated by the following argument. LettingK =καs−β and assuming that κ is much smaller than i, Eq. (6) can be approxi-mated by
f(i, s)≈Ki−α(s−i)β, (7) which is the beta-like function proposed in [NC08]; we note that we obtain the Lavalette
functionin the special case when α=β [FMY+16].
Therefore, the multiplicative process presented in Section 2 provides a direct and intui-tive generaintui-tive model for the beta-like function. In contrast, the multinomial multiplicaintui-tive process described in [NC08] is indirectly linked to the beta-like function via a stretched ex-ponential [LS98] derived by ranking the components of a multinomial distribution, and only afterwards fitting a beta-like function.
We crystalise Eq. (6) by fixingκ= 0.5 and including a scaling constantCfor normalisation purposes, so that
f(i, s) =C
0.5
i+ 0.5
α
1− i
s
β
. (8)
The justification for fixingκis that its sole purpose in Eq. (5) is to prevent the first term being undefined when i= 0; settingκ= 0.5 seems sensible since, when iis large, the precise value of κ is rather unimportant.
It can be seen that the beta-like survival function in Eq. (8) combines two regimes. The second term exhibits a polynomial decay, whereas the first term, which dominates when iis significantly less than s, exhibits power-law behaviour. In terms of Eq. (5), the preferential attrition component gives rise to the power-law regime, while the uniform attrition component gives rise to the polynomial decay regime.
We define a linear transformationf∗(i, s) off(i, s) as follows:
f∗(i, s) =τ f(i, s) +ρ=τ
0.5
i+ 0.5
α
1− i
s
β
+ρ, (9)
where the scaling constantC from Eq. (8) is absorbed into the slope parameter τ, and ρ is
3
Analysis of the UK 2016 EU referendum results
We now make use of the rank-ordering distribution and the beta-like survival function, as introduced in Section 2, to analyse the Remain and Leave votes in the 2016 EU referendum for the 382 Local Authority districts in the UK (we will often refer to these simply as districts); the full set of electoral results is available online at The Electoral Commission web site [Ele16]. We first show how to apply our model in the context of a referendum.
3.1 Application of the model to the analysis of referendum results
We consider a multiple-choice question referendum with several options, where the votes are aggregated over the whole electorate [LeD02]. In particular, the voting takes place across the country in a designated number of Local Authority districts.
We make use of the rank-ordering technique [SKKV96] in the context of a voter model
[FLL17] as follows. Focusing on one particular answer to the referendum question, we model the proportion of votesVi attained for that answer in districti, whereirepresents therankof the district and 0≤Vi ≤1. Thus, ordering the districts in descending order of the proportion of votes, we obtain thevotes vector(Vi) = (V0, V1,· · ·)T, where:
V0 > V1 > V2 >· · ·Vi>· · ·. (10)
District 0 is a “dummy” district withV0 = 1. In the unlikely event that two districts have
exactly the same proportion of votes, their order is chosen randomly.
The votes vector is analogous to the empirical survival function ˆS(·) [KK12], where Vi, which corresponds to ˆS(i), can be viewed as an estimate of the expected proportion of the popular vote in districti, given thatVi−1 was the proportion in districti−1; cf. the
Kaplan-Meier estimator [KM58, KK12] in the context of survival models. In the context of the voter
model, we see that ˆS(i) ≈f(i, n), where n, the final stage, is equal to the number of voting districts.
The rank-ordering of the districts, as in Eq. (10), can be simulated by the multiplicative process described in Section 2, where i corresponds to the ith highest ranked district. An appropriate attrition functionµ(i, s) is used, which is usually decreasing ini. In terms of the voter model, as we consider less popular districts for the given answer, i.e. those of lower “rank” (remembering that a lower rank is represented by a higher distict number), more votes are “lost”.
contacted by a party, they are more likely - all other things being equal - to have voted for that party [FGE+16]. Thus contextual effects enhance political supply, which contributes to further positive feedback and nonlinear vote distributions over location. Taking account of this clustering within the geographic distribution of both independent and dependent variables helps improve model fit in aggregate election analyses.
We also note that the effect of the community on the individual’s decision making has been studied in terms of a threshold effect in models of opinion spreading [BNH17]. An earlier paper [Chw99] dealing with collective action considers the case where an individual will participate only if the total number of participants is above the individual’s threshold.
In Subsection 3.2, using nonlinear least squares regression, we fit beta-like survival functi-onsf(i, s) to the referendum results vectors (Vi) for both the entire UK and Scotland, and in Subsection 3.3 we investigate how the beta-like survival function can be used to associ-ate regional covariassoci-ates with the referendum data. We use subscriptsU and S to denote the UK and Scotland, respectively, for example,fU(i, s) andfS(i, s). All the computations were carried out using the Matlab software package.
3.2 Analysis of the referendum results using the beta-like survival function
The overall result for the entire UK electorate was 48.11% for Remain and 51.89% for Leave. The fitted parametersα,βandC for the UK regional referendum results as a whole, together with the coefficient of determination R2 [Mot95] are shown in Table 3.2. As can be seen,
the power-law exponent α for Leave is significantly lower than that for Remain, while the decay exponent β for Leave is somewhat higher than that for Remain. This may indicate that the proportions of votes for Leave were more “stable” across the country than those for Remain. In other words, it is feasible that positive feedback driven by contextual effects on individual vote choice mattered more in Remain than Leave areas. BothR2 values are very high, indicating very good fits of the beta-like survival function to the data.
Option α β C R2
Leave 0.0357 0.2094 0.7801 0.9913
Remain 0.1286 0.1244 1.0740 0.9930
Table 1: Nonlinear least-squares regression fitting the beta-like survival functionfU(i, s) to the empirical results vector (Vi)U of the regional results for the UK EU referendum.
We now consider the results over the 32 Local Authority districts in Scotland, which, in contrast to the UK as a whole, had a majority of 62% for Remain. The fitted parameters for Scotland are shown in Table 3.2 together with theR2 values, which again indicate very good fits. As for the overall UK results, the proportions of votes for Leave were more “stable” than those for Remain, despite the different overall result. The fitted curves and data points for the districts, for both the entire UK and Scotland, are shown graphically in Figure 1.
Option α β C R2
Leave 0.0322 0.1540 0.4984 0.9765
[image:9.595.190.414.108.154.2]Remain 0.0848 0.0333 0.8274 0.9822
Table 2: Nonlinear least-squares regression fitting the beta-like survival function fS(i, s) to the empirical vector (Vi)S of the regional results for the Scottish EU referendum.
0 50 100 150 200 250 300 350 400
Region (ranked) 0.1
0.2 0.3 0.4 0.5 0.6 0.7 0.8 0.9 1
Proportion of votes
EU referendum results for the UK
Leave
Remain
0 5 10 15 20 25 30 35
Region (ranked) 0.1
0.2 0.3 0.4 0.5 0.6 0.7 0.8
Proportion of votes
EU referendum results for Scotland
[image:9.595.92.453.218.362.2]Leave Remain
Figure 1: Regression curve and regional data points for the UK (left) and for Scotland (right).
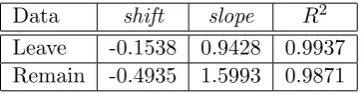
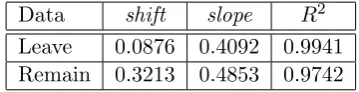
are shown in Table 3.2. Similarly, Table 3.2 shows the result of fittingfU∗(i, s) to (Vi)S. The linear transformations demonstrate that, although the overall results for the UK as a whole and Scotland were very different, as can be seen in Figure 1, the patterns for the regional proportions for the UK and Scotland are linearly related for both Leave and Remain. The extreme results in Figure 1 suggest that positive feedback is operating, whether through contextual effects (see [GH16]) or selective migration of those with pro-Leave or pro-Remain characteristics toward districts where they are already concentrated.
Data shift slope R2
Leave -0.1538 0.9428 0.9937
Remain -0.4935 1.5993 0.9871
Table 3: The shiftand slope parameters,ρ and τ, fittingfS∗(i, s) to (Vi)U.
3.3 Analysis of four covariates with the beta-like survival function
[image:9.595.210.392.525.572.2]Data shift slope R2
Leave 0.0876 0.4092 0.9941
[image:10.595.209.389.108.154.2]Remain 0.3213 0.4853 0.9742
Table 4: The shiftand slope parameters,ρ and τ, fittingfU∗(i, s) to (Vi)S.
To demonstrate how our rank-order distribution may be used for explanatory purposes, we outline a baseline methodology using a single covariate. Our methodology is as follows, whereγ denotes a covariate.
(i) We first order γi, for districts i= 0,1,2, . . ., in descending order, where γ0 = 1 for the
dummy district 0, in order to obtain the empirical covariate vector (γi).
(ii) We then use nonlinear least-squares regression to fit a beta-like survival functiong(i, s) to the vector (γi) from (i); this gives the fitted parametersα,β and C, as in Eq. (8). (iii) We now use linear regression to fit the transformed beta-like survival function g∗(i, s),
with the values ofα,β andCobtained in (ii), to the votes vector (Vi) of the Leave results of the referendum. This yields the corresponding shift and slope parameters, ρ and τ, respectively, as in Eq. (9). Since voters had only two choices, we could equivalently choose to regress on the Remain results.
As a proof of concept, we chose four census covariates, which the literature suggests may be associated with the Leave vote: “White-qualification”, which represents the average qualification level of the white British population in a district (excluding Scotland); “Identify-as-English”, which represents the share of White British people in a district identifying as English rather then British, Irish or Welsh (excluding Scotland and Wales); “Social-grade”, which represents the average occupational level of the White British population in a district (excluding Scotland); and “Carstairs-index”, which represents the Carstairs deprivation index in a district (excluding Scotland) [MB06]. The Carstairs index of multiple deprivation, deve-loped by Paul Norman, is an index of four components from the census. Namely, proportion of residents without cars, male unemployed, low status occupational groups and overcrowded households. Social grades (AB, C1, C2, DE) and qualification levels (none, 1, 2, apprentices-hip, 3, 4 and above) were encoded and averaged to obtain an index for each Local Authority district.
As an exploratory step, we show, in Figure 2, a scatter plot of the proportion of votes against the covariate values. These exhibit good correlation for all the covariates apart from the Carstairs-index. The actual Pearson and Spearman correlations and the linear regression parameters, i.e. theshiftand slope, are given in Table 3.3. We note that White-qualification has a negative correlation with the proportion of Leave votes, and that for the Carstairs-index a weighted least squares linear regression [FWS06] was applied to obtain theshiftand
slope. We further note that, as expected, theR2 value for the Carstairs-index is significantly
lower than for the others, even though the R2 values for the other three covariates are not particularly high.
1.5 2 2.5 3 3.5 0.2
0.4 0.6
0.8 White-qualification
0.5 0.6 0.7 0.8 0.9 0.2
0.4 0.6
0.8 Identify-as-English
1.5 2 2.5
0.2 0.4 0.6
0.8 Social-grade
-5 0 5 10 15
0.2 0.4 0.6
[image:11.595.164.445.116.354.2]0.8 Carstairs
Figure 2: Scatter plots for the four chosen covariates; the y-values represent the proportion of Leave votes for a district and the x-values represent the values of the covariate for the district.
Covariate Pearson Spearman shift slope R2
White-qualification -0.8340 -0.7876 1.5335 -0.3971 0.6955
Identify-as-English 0.8139 0.7375 -0.6730 1.7063 0.6624
Social-grade 0.7602 0.7171 -0.7904 0.6226 0.5779
Carstairs-index 0.0267 0.2664 0.5639 0.0120 0.4161
Table 5: Pearson and Spearman correlation between the proportion of votes and the covariate values per district, and the parameters obtained from their linear regression.
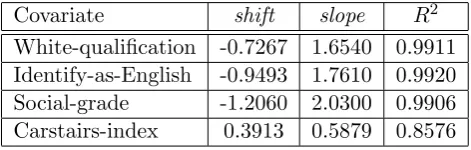
In Table 3.3 we give the fitted parameters for the linear transformation according to Eq. (9), together with theirR2 values, which indicate a very good fit for all covariates, apart from the Carstairs index where R2 is less than 0.9. We observe from Table 3.3 that theR2
values are much higher than the ones in Table 3.3, indicating that our methodology using beta-like survival functions may yield better predictive models than traditional ones based on linear regression of the raw covariate data.
Covariate α β C R2
White-qualification 0.0548 0.0370 3.4830 0.9964 Identify-as-English 0.0200 0.0559 0.8414 0.9966
Social-grade 0.0189 0.0441 2.4870 0.9950
[image:12.595.163.438.107.183.2]Carstairs-index 0.1620 0.6626 19.860 0.9972
Table 6: Nonlinear least-squares regression fitting of a beta-like survival function to the empirical covariate vectors of the four covariates.
Covariate shift slope R2
White-qualification -0.7267 1.6540 0.9911 Identify-as-English -0.9493 1.7610 0.9920
Social-grade -1.2060 2.0300 0.9906
Carstairs-index 0.3913 0.5879 0.8576
Table 7: Theshiftandslopeparameters from the linear transformation of the beta-like functi-ons of the four covariates to the empirical votes vector.
4
Concluding remarks
Most phenomena in the social sciences are not normally distributed across geographical units because individuals and contexts influence each other. Contextual and selection effects lead to positive feedback loops that produce extreme geographic concentrations of both social characteristics and political opinions/behaviour.
We model the UK EU regional referendum results with a multiplicative decrease process, using an attrition function, that gives rise to a rank-order distribution representing the pro-portion of votes for a particular answer in each district. The discrete model is approximated by a continuous one leading to the solution given in Eq. (4), which is identical to that of the renewal equation in population dynamics [Cha94].
We suggest that nonlinear social models of aggregate voting behaviour can outperform linear models. The beta-like survival function, obtained using an attrition function that is a mixture of preferential and uniform attrition mechanisms, is shown to generate an improved model for the UK EU referendum results. Our results fit in well with the results in [MAB+09], where the beta-like function was shown to exhibit universal behaviour for rank-order distri-butions in several apparently unrelated disciplines.
We have also shown that the beta-like survival function could be instrumental in building a predictive model of the referendum results through a judicious choice of covariates. The methodology we presented in Subsection 3.3 may be used in tandem with traditional regression methods [FWS06] and may, in fact, have some advantages as rank-order distributions are very good at smoothing the data.
[image:12.595.182.418.238.313.2]transformations, apart from the linear transformation in Eq. (9), which could potentially improve the predictive power of the model. Aggregate models of voting are important for understanding electoral geography, inferring individual-level relationships in the absence of individual data, and for predicting election results in majoritarian systems. Our nonlinear modelling technique, based on rank-ordering outcome and predictor variables, helps advance scholarship in these areas of political science.
Acknowledgements
The authors would like to thank the reviewer for constructive comments, which helped us to improve the paper.
References
[AB02] R. Albert and A.-L. Barab´asi. Statistical mechanics of complex networks. Reviews
of Modern Physics, 74:47–97, 2002.
[Bar07] A.-L. Barab´asi. The architecture of complexity: From network structure to human dynamics. IEEE Control Systems Magazine, 27:33–42, 2007.
[BGVV99] S. Brakman, H. Garretsen, C. Van Marrewijk, and M. Van den Burg. The return of Zipf: Towards a further understanding of the rank-size distribution. Journal
of Regional Science, 39:183–213, 1999.
[BNH17] L. B¨ottcher, J. Nagler, and H.J. Herrmann. Critical behaviors in contagion dyn-amics. Physical Review Letters, 118:088301–1–088301–5, 2017.
[BO11] A. Bentley and P. Ormerod. Agents, intelligence, and social atoms. In E. Slinger-land and M. Collard, editors, Creating Consilience: Integrating the Sciences and
the Humanities, pages 205–222. Oxford University Press, New York, NY, 2011.
[BSV07] S. B¨orner, S. Sanyal, and A. Vespignani. Network science. Annual Review of
Information Science & Technology (ARIST), 41:537–607, 2007.
[Cha94] B. Charlesworth. Evolution in age-structured populations. Cambridge Studies in Mathematical Biology: 13. Cambridge University Press, Cambridge, UK, 2nd edition, 1994.
[Chw99] M.S.-Y. Chwe. Structure and strategy in collective action. American Journal
Sociology, 105:128–156, 1999.
[CMF13] A. Chatterjee, M. Mitrovi´c, and S. Fortunato. Universality in voting behavior: an empirical analysis. Nature Scientific Reports, 3:1049, 2013.
[CTT+12] C.-C. Chen, C.-Y. Tseng, L. Telesca, S.-C. Chi, and L.-C. Sun. Collective Weibull behavior of social atoms: Application of the rank-ordering statistics to historical extreme events. Europhysics Letters, 97:48010–1–48010–6, 2012.
[Ele16] The Electoral Comission. EU referendum results. See www. electoralcommission.org.uk/find-information-by-subject/
elections-and-referendums, 2016.
[Fai09] R.C. Fair. Presidential and congressional vote-share equations. American Journal
of Political Science, 53:55–72, 2009.
[FC07] S. Fortunato and C. Castellano. Scaling and universality in proportional elections.
Physical Review Letters, 99:138701–1–138701–4, 2007.
[FGE+16] E.J. Fieldhouse, J. Green, G. Evans, H. Schmitt, C. van der Eijk,
J. Mellon, and C. Prosser. British election study internet
pa-nel waves 1-9. See www.britishelectionstudy.com/data-object/
british-election-study-combined-wave-1-9-internet-panel, July 2016.
[FLL15] T. Fenner, M. Levene, and G. Loizou. A stochastic evolutionary model for captu-ring human dynamics. Journal of Statistical Mechanics: Theory and Experiment, 2015:P08015, August 2015.
[FLL17] T. Fenner, M. Levene, and G. Loizou. A multiplicative process for generating the rank-order distribution of UK election results. Quality & Quantity, 2017. To appear.
[FMY+16] O. Fontanelli, P. Miramontes, Y. Yang, G. Cocho, and W. Li. Beyond Zipfs law: The Lavalette rank function and its properties. PLoS ONE, e0163241:14 pages, September 2016.
[FWS06] R.J. Freund, W.J. Wilson, and P. Sa. Regression Analysis: Statistical Modeling
of a Response Variable. Academic Press, San Diego, CA., second edition, 2006.
[Gal08] S. Galam. Sociophysics: A review of Galam models. Journal of Modern Physics C, 19:409–440, 2008.
[GH16] M.J. Goodwin and O. Heath. The 2016 referendum, Brexit and the left behind: An aggregate-level analysis of the result. The Political Quarterly, 87:323–332, 2016.
[HS98] P. Hedstr¨om and R. Swedberg. Social mechanisms: An introductory essay. In P. Hedstr¨om and R. Swedberg, editors, Social Mechanisms: An Analytical
Appro-ach to Social Theory, pages 1–31. Cambridge University Press, Cambridge, UK,
1998.
[JKB94] N.L. Johnson, S. Kotz, and N. Balkrishnan. Continuous Univariate Distributions,
Volume 1: Chapter 14. Wiley Series in Probability and Mathematical Statistics.
John Wiley & Sons, New York, NY, second edition, 1994.
[JKB95] N.L. Johnson, S. Kotz, and N. Balkrishnan. Continuous Univariate Distributions,
Volume 2: Chapter 25. Wiley Series in Probability and Mathematical Statistics.
John Wiley & Sons, New York, NY, second edition, 1995.
[KM58] E.L. Kaplan and P. Meier. Nonparametric estimation from incomplete
observati-ons. Journal of the American Statistical Association, 53:457–481, 1958.
[KS50] M.G. Kendall and A. Stuart. The law of cubic proportions in election results.
British Journal of Sociology, 1:183–196, 1950.
[Lax06] P.D. Lax. Hyperbolic Partial Differential Equations. Courant Lecture Notes. American Mathematical Society, Providence, RI, 2006.
[LeD02] L. LeDuc. Opinion change and voting behaviour in referendums.European Journal
of Political Research, 41:711–732, 2002.
[LS98] J. Laherr`ere and D. Sornette. Stretched exponential distributions in nature and economy: fat tails with characteristic scales.European Physical Journal B, 2:525– 539, 1998.
[LSA01] E. Limpert, W.A. Stahel, and M. Abbt. Log-normal distributions across the sciences: Keys and clues. BioScience, 51:341–352, 2001.
[MAB+09] G. Mart´ınez-Mekler, R. Alvarez Mart´ınez, M. Beltr´an del Rio, R. Mansilla, P. Mi-ramontes, and G. Cocho. Universality of rank-ordering distributions in the arts and sciences. PLoS ONE, 4(3):e4791, 2009.
[MB06] O. Morgan and A. Baker. Measuring deprivation in England and Wales using 2001 Carstairs scores. Health Statistics Quarterly, 31:28–33, 2006.
[MH99] C.D. Manning and H.Sch¨utze. Foundations of Statistical Natural Language
Pro-cessing: Section 1.4.3. MIT Press, Cambridge, MA., 1999.
[Mit04] M. Mitzenmacher. A brief history of generative models for power law and lognor-mal distributions. Internet Mathematics, 1:226–251, 2004.
[Mot95] H. Motulsky. Intuitive Biostatistics. Oxford University Press, Oxford, 1995.
[NC08] G.G. Naumis and G. Cocho. Tail universalities in rank distributions as an alge-braic problem: The beta-like function. Physica A, 387:84–96, 2008.
[ONS13] Office of National Statistics ONS. Census of England and Wales 2011. Local authorities in England and Wales. Seewww.nomisweb.co.uk, 2013.
[PS10] R.K. Pan and S. Sinha. The statistical laws of popularity: universal properties of the box-office dynamics of motion pictures. New Journal of Physics, 12:115004 (23pp), 2010.
[Ros96] S.M. Ross. Stochastic Processes. John Wiley & Sons, New York, NY, second edition, 1996.
[SC14] P. Sen and B.K. Chakrabarti. Sociophysics: An Introduction. Oxford University Press, Oxford, 2014.
[Sim55] H.A. Simon. On a class of skew distribution functions. Biometrika, 42:425–440, 1955.
[SKKV96] D. Sornette, L. Knopoff, Y.Y. Kagan, and C. Vanneste. Rank-ordering statistics of extreme events: Application to the distribution of large earthquakes. Journal
of Geophysical Research, 101:13–883–13–893, 1996.
[Zan08] D.H. Zanette. Multiplicative processes and city sizes. In S. Albeverio, D. Andrey, P. Giordano, and A. Vancheri, editors,The Dynamics of Complex Urban Systems