© 2017, IRJET | Impact Factor value: 5.181 | ISO 9001:2008 Certified Journal | Page 360
Reactive Power Compensation in Single Phase Distribution System
using SVC, STATCOM & UPFC
Ajeet Kumar Rawat
1, Dr. A.S Pandey
2, Ankit Kumar Srivastava
31
(P.G Scholar) EE Department KNIT Sultanpur, U.P (INDIA)-228118
2(Professor) EE Department KNIT Sultanpur, U.P (INDIA)-228118
3(PHD Scholor) EE Department KNIT Sultanpur, U.P (INDIA)-228118
---***---Abstract -
Matlab-Simulink Model of a single-phase grid with a Static Var Compensator (SVC), Static Synchronous Compensator (STATCOM) and Unified Power Flow Controller (UPFC) for compensation of reactive power and for maintaining the power factor in the grid close to unity is presented. Facts devices used in transmission and distribution system to improve power transfer capability and enhance power system stability. First the Uncompensated model of single phase distribution system is considered for 25MW and 50MVAR load and the system is analyzed. Then the same model is compensated using Facts devices like SVC, STATCOM and UPFC. In this paper, it is tried to show the application of SVC, STATCOM and UPFC in single phase distribution system for compensation of reactive power. Next the comparative study has been done among SVC, STATCOM and UPFC and tried to figure out which device is best suited and provide optimal compensation to the system. The entire work has been done in MATLAB/SIMULINK environment.Key Words
:
FACTS, SVC, STATCOM, UPFC, Reactive Power
1.INTRODUCTION
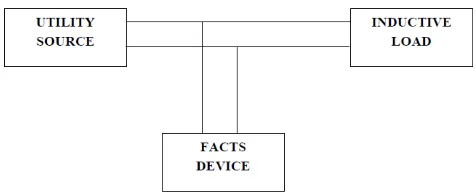
Power Generation and Transmission is a complex process, requiring the working of many components of the power system in tandem to maximize the output. One of the main components to form a major part is the reactive power in the system. The total power in AC network is calculated as algebraic sum of Active and Reactive power. In which compensation of reactive power improves the quality of power. [1] It is required to maintain the voltage to deliver the active power through the lines. Loads like motor loads and other loads require reactive power for their operation. To improve the performance of ac power systems, we need to manage this reactive power in an efficient way and this is known as reactive power compensation. There are two aspects to the problem of reactive power compensation: load compensation and voltage support. Load compensation consists of improvement in power factor, balancing of real power drawn from the supply,better voltage regulation, etc. of large fluctuating loads. Voltage support consists of reduction of voltage fluctuation at a given terminalof the transmission line. Two types of compensation can beused: series and shunt compensation. These modify the
[image:1.595.315.553.275.372.2]parameters of the system to give enhanced VAR compensation.
Figure 1: Block Diagram of Reactive Power Compensation Technique
Development of power electronics based devices help to improve transmission loss and increase the power transfer capability of power system. Parameters like voltage, real and reactive power flow can be controlled by using FACTS devices in transmission line. In this paper Static Synchronous Compensator (STATCOM), Static VAR Compensator (SVC) and Unified Power Flow Controller (UPFC) have been used to verify the performance and determine the power transfer quality. [2] Flexible AC Transmission (FACT) devices are static equipments which helps in not only for compensating reactive power but also control one or more AC transmission parameters. Flexible AC Transmission Devices includes Static synchronous compensator, Thyristor switched reactor, Static synchronous series compensator, Thyristor switched capacitor, Thyristor switched series reactor. All these equipment are static instruments, so there is no dynamic effect. Static synchronous compensator (STATCOM) basically includes a DC power capacitor, a converter (may act as rectifier when reactive power is being absorbed and as an inverter when reactive power is being supplied to the transmission system), step up transformer, series inductors etc.
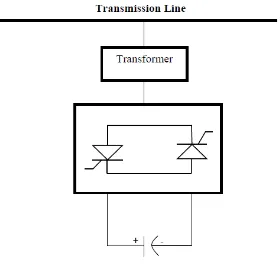
1.1 Static Var Compensator (SVC)
© 2017, IRJET | Impact Factor value: 5.181 | ISO 9001:2008 Certified Journal | Page 361 to provide fast-acting reactive power compensation on
[image:2.595.354.521.161.293.2]electrical systems. In other words, static var compensators have their output adjusted to exchange inductive or capacitive current in order to control a power system variable such as the bus voltage.
Figure 2: SVC (Static Var Compensator)
The variation of reactive power is accomplished by controlling the thyristor’s firing instants and, accordingly, the current that flows by the reactance.
1.2 Static Synchronous Compensator (STATCOM)
STATCOM is a shunt connected Fact device. Its capacitive or inductive output current is controlled independent of the ac system voltage. Fig 3: shows a simple one line diagram of STATTCOM based on a voltage source converter.
Figure 3: Static Synchronous Compensator (STATCOM)
The voltage converter converts dc voltage to ac voltage by using power electronics devices such as GTO, MOSFET, Thyristors and the ac voltage inserted into the line using transformer. If output of the STATCOM is more than the line voltage, converter will supply lagging reactive power to the transmission line. If line voltage is more than the STATCOM output voltage then STATCOM will absorbs lagging reactive power from the system.
1.3 Unified Power Flow Controller (UPFC)
UPFC is a device which can be used as multifunctional Facts device. UPFC has back-to-back voltage source converters.
[image:2.595.80.245.169.278.2]One is connected in parallel to the line and other is connected in series with the line through transformer as shown in Fig. 4. Both converters are operated from common dc link which is provided by a dc storage capacitor.
Figure 4: Unified Power Flow Controller (UPFC)
It is an ideal ac-to-ac converter in which real power can flow both sides between ac terminals of the two converters. Independently both converters can absorb or generate reactive power at it ac output terminals. The voltage source converter 1 is supply or absorbs the real power demand by voltage source converter 2 at the common dc link to support the real power exchange resulting from the series voltage injection. The voltage source converter 1 which is connected to transmission line via shunt transformer to fulfill the dc link power demand by voltage source converter 2. The Independent shunt reactive compensation for the line is done by voltage source converter 1, which can also generate or absorb controllable reactive power.
2. OBJECTIVE
The main objective of this paper is to implement facts devices in single phase distribution system for increasing the flow of real and reactive power to the load and improvement in the power factor of the utility end irrespective of the load.
2.1 Description of the system
[image:2.595.92.232.454.586.2]© 2017, IRJET | Impact Factor value: 5.181 | ISO 9001:2008 Certified Journal | Page 362 Table 1: System Parameters
Grid
Voltage 11 kV
Frequency 50 Hz
Source Resistance 0.01Ω
Source Inductance 1mH
Transmission line
Frequency 50 Hz
R 0.02568 Ω per unit length
L 0.2 mH per unit length
Length 10 kM
R-L Load
Nominal Voltage 11 kV
Nominal Frequency 50 Hz
Active Power 25 MW
Reactive Power 50 MVAR
3. SIMULATION RESULTS
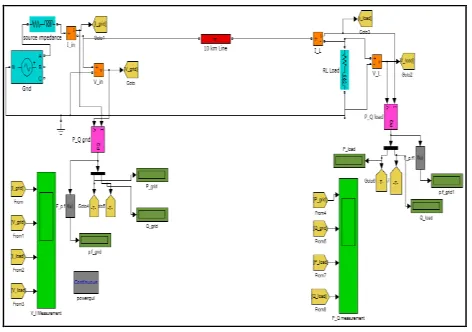
3.1 Simulink model of the system without
compensation
The Simulink model of the single phase distribution system is shown in fig.5.
Figure 5: System without compensation
Results obtain after simulation is shown in table 2.
Table 2: Parameters before compensation
Real Power (P in
MW) Reactive Power (Q in MVAR) Power factor
Grid 5.055 10.53 0.4327
[image:3.595.311.551.294.427.2]Load 3.994 7.951 0.448
[image:3.595.49.285.444.610.2]Figure 6: Shows the voltage and current waveform of the grid side and load side before compensation
Figure 7: Shows the waveform for the real power and reactive power for the grid side and load side before
compensation
3. 2 Simulink Model of the system using Static Var
Compensator (SVC)
© 2017, IRJET | Impact Factor value: 5.181 | ISO 9001:2008 Certified Journal | Page 363 Figure 8: Simulink Model of Static Var Compensator (SVC)
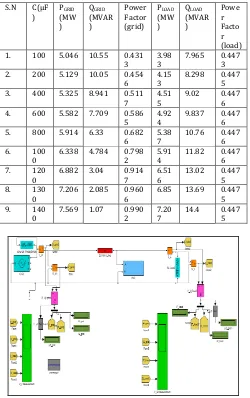
Table 3: Variation of Power Flow with change in value of capacitor
S.N C(µF ) P(MWGRID
)
QGRID
(MVAR )
Power Factor (grid)
PLOAD
(MW )
QLOAD
(MVAR )
Powe r Facto r (load) 1. 100 5.046 10.55 0.431
3 3.983 7.965 0.4473 2. 200 5.129 10.05 0.454
6 4.153 8.298 0.4475 3. 400 5.325 8.941 0.511
7 4.515 9.02 0.4476 4. 600 5.582 7.709 0.586
5 4.924 9.837 0.4476 5. 800 5.914 6.33 0.682
6
5.38 7
10.76 0.447 6 6. 100
0
6.338 4.784 0.798 2
5.91 4
11.82 0.447 6 7. 120
0 6.882 3.04 0.9147 6.516 13.02 0.4475 8. 130
0 7.206 2.085 0.9606 6.85 13.69 0.4475 9. 140
0 7.569 1.07 0.9902 7.207 14.4 0.4475
Figure 9: Simulink Model of the system with Static Var Compensator (SVC)
[image:4.595.37.288.324.711.2]SVC connected in the system will inject reactive power to compensate the reactive power in the system. Results obtain after simulation in shown in table 3 and response of the system is shown in Fig.10 and Fig.11
.
Figure 10: Shows the voltage and current waveform of the grid side and load side when SVC is connected in the
system
Figure 11: Shows the waveform for the real power and reactive power for the grid side and load side when SVC is
connected in the system
3.3 Simulink Model of the system using Static
Synchronous Compensator (STATCOM)
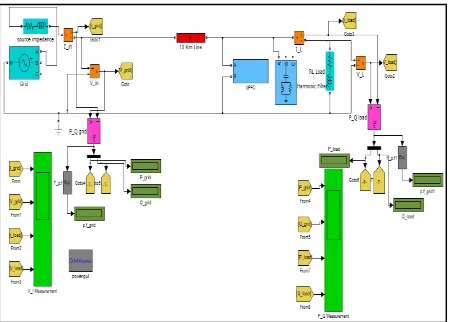
Simulink model for STATCOM (Static Synchronous Compensator) is shown in Fig.12. A Matlab/Simulink model of STATCOM is design with help of thyristors and diodes. Thyristors and diodes with pulse generators comprise voltage source convertor which converts dc into ac. A dc voltage is provided by a capacitor which is connected to a voltage source convertor as shown in Fig.12. A harmonic filter is used for reducing harmonics. STATCOM connected system is shown in Fig.13. A firing angle delay technique is employed here for controlling of STATCOM. Pulse generator 1 is fired at 0 degree while Pulse generator 2 is fired after a delay of 180 degree. With the variation of the value of capacitor reactive power compensation is achieved.
[image:4.595.308.540.361.483.2]© 2017, IRJET | Impact Factor value: 5.181 | ISO 9001:2008 Certified Journal | Page 364 Figure 12: Simulink model of Static Synchronous
[image:5.595.34.288.320.650.2]Compensator (STATCOM)
Table 4: Variation of Power Flow with change in value of capacitor
S.N C(µF) PGRID
(MW) Q(MVAR) GRID Power Factor (grid)
PLOAD
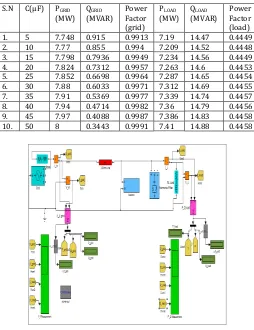
(MW) Q(MVAR) LOAD Power Factor (load) 1. 5 7.748 0.915 0.9913 7.19 14.47 0.4449 2. 10 7.77 0.855 0.994 7.209 14.52 0.4448 3. 15 7.798 0.7936 0.9949 7.234 14.56 0.4449 4. 20 7.824 0.7312 0.9957 7.263 14.6 0.4453 5. 25 7.852 0.6698 0.9964 7.287 14.65 0.4454 6. 30 7.88 0.6033 0.9971 7.312 14.69 0.4455 7. 35 7.91 0.5369 0.9977 7.339 14.74 0.4457 8. 40 7.94 0.4714 0.9982 7.36 14.79 0.4456 9. 45 7.97 0.4088 0.9987 7.386 14.83 0.4458 10. 50 8 0.3443 0.9991 7.41 14.88 0.4458
Figure 13: Simulink Model of the system with Static Synchronous Compensator (STATCOM)
As shown in above table, with the increase in capacitance power flow to the load is increasing. Also power factor at supply/grid end is also increasing with the increase in capacitance. Power factor at the supply end is improving because as the value of capacitor is increasing, flow of active power at supply end is increasing while reactivepower is reducing. Best compensation is achieved at the value of
[image:5.595.308.553.356.499.2]50µF. Response of the system voltage, current, active and reactive power flow is shown in Fig.14 and Fig.15 respectively. It should be noted that response shown in Fig.14 and Fig.15 is shown for capacitor value of 50µF i.e. responses are shown for best compensation.
Figure 14: Shows the voltage and current waveform of the grid side and load side when STATCOM is connected in the
system
Figure 15: Shows the waveform for the real power and reactive power for the grid side and load side when
STATCOM is connected in the system
3.4 Simulink Model of the system using Unified
Power Controller (UPFC)
© 2017, IRJET | Impact Factor value: 5.181 | ISO 9001:2008 Certified Journal | Page 365 Figure 16: Simulink model of Unified Power Flow
Controller (UPFC)
Figure 17: Simulink Model of the system with Unified Power Controller (UPFC)
Table 5: Variation of Power Flow with Change in value of Capacitor
S.N C(µF) PGRID
(MW) Q(MVAR) GRID Power Factor (grid)
PLOAD
(MW) Q(MVAR) LOAD Power Factor (load) 1. 5 7.744 0.9151 0.9931 7.187 14.47 0.4448 2. 10 7.771 0.8523 0.994 7.221 14.52 0.4453 3. 15 7.797 0.7851 0.995 7.245 14.56 0.4454 4. 20 7.826 0.7219 0.9958 7.274 14.61 0.4457 5. 25 7.846 0.6578 0.9965 7.294 14.66 0.4455 6. 30 7.878 0.5841 0.9973 7.323 14.71 0.4456 7. 35 7.907 0.5119 0.9979 7.354 14.76 0.446 8. 40 7.946 0.4396 0.9985 7.377 14.81 0.4459 9. 45 7.973 0.3676 0.9989 7.405 14.86 0.446 10. 50 8.008 0.2978 0.9993 7.43 14.91 0.446
[image:6.595.311.555.321.459.2]With the use of UPFC power flow in the system is increased. Results obtain after simulation is shown in table V and response is shown in Fig 18 and Fig 19 respectively.
Figure 18: Shows the voltage and current waveform of the grid side and load side when UPFC is connected in the
system
Figure 19: Shows the waveform for the real power and reactive power for the grid side and load side when UPFC
is connected in the system
As shown in the table above, with the increase in capacitance power flow to the load is increasing. Also power factor at supply/grid end is also increasing with the increase in capacitance. Power factor at the supply end is improving because as the value of capacitor is increasing, flow of active power at supply end is increasing while reactive power is reducing. Best compensation is achieved at the value of 50µF. Response of the system voltage, current, active and reactive power flow is shown in Fig.18 and Fig.19 respectively. It should be noted that response shown in Fig.18 and Fig.19 is for capacitor value of 50µF i.e. responses are shown for best compensation.
© 2017, IRJET | Impact Factor value: 5.181 | ISO 9001:2008 Certified Journal | Page 366 Response of the system voltage, current, active and reactive
power flow is shown in Fig.18 and Fig.19 respectively. It should be noted that response shown in Fig.18 and Fig.19 is for capacitor value of 50µF i.e. responses are shown for best compensation.
3.5 Comparison of Results Obtain Using SVC,
STATCOM, UPFC
After comparative analysis as shown in table 5, it is seen that best compensation is achieved with STATCOM and UPFC. Active power flow and reactive power flow is increased to the load in the system at power factor closed to unity at grid side.
Table 6: Shows comparison of results when system is connected with SVC, STATCOM and UPFC
No compensatio
n
SVC STATCOM UPFC
Grid Loa
d Grid Load Grid Load Grid Load
C(µF) N.A 1400 50 50
Real Power (MW)
5.05
5 3.994 7.569 7.207 8 7.41 8.008 7.43
Reacti ve Power (MVA R) 10.5
3 7.951 1.07 14.4 0.3443 14.88 0.2978 14.91
Power
factor 0.4327 0.448 0.9902 75 0.44 0.9991 0.4458 0.9993 0.446
4. CONCLUSION
In nominal system there are transmission losses and power flow to the load is very low. Grid is supplying power to load at very poor power factor (shown in TABLE VI). Also power flow to the load is also poor. Hence Facts devices was needed to increase the power flow to the load at the improved power factor.
When SVC (Static Var Compensator) is connected in the system then grid power factor starts improving as the value of capacitor is increasing. Best compensation is achieved at 1400µF (shown in TABLE VI). Since compensation is achieved at such a high value of capacitor, hence cost of the scheme will increase. This is the drawback of this scheme. When STATCOM (Static Synchronous Compensator) is connected in the system then grid power factor starts improving as the value of capacitor is increasing. Best compensation is achieved at 50µF (shown in TABLE VI). Compare to SVC, in case of STATCOM power factor is improved up to 0.9991 and power flow is also increased more than compared to SVC (shown in TABLE VI). Since in this case best compensation is achieved at the value of 50µF only, hence this scheme is cost effective also.
When UPFC (Unified Power Flow Controller) is connected in the system then grid power factor starts improving as the value of capacitor is increasing. Best compensation is achieved at 50µF (shown in TABLE VI). Compare to SVC, and STATCOM power factor is improved up to 0.9993 in the case of UPFC. Power flow is also increased more than compared to SVC and slightly more than STATCOM (shown in TABLE VI). Since in this case best compensation is achieved at the value of 50µF only, hence this scheme is cost effective also.
REFERENCES
[1] M.Gerald Geafari Titus, “ Reactive Power Compensation using STATCOM for Single Phase Distribution System”, in IEEE International Conference on Circuit, Power and Computing Technologies, pp. 1-5, March 2015.
[2] S.Bagchi, R Bhaduri, P N Das and S Banerjee, “ Ananlysis of Power Transfer Capability of a Long Transmission Line using FACTS Devices”, in IEEE International Conference on Advances in Computing, Communications and Informatics, pp. 601-606, Aug 2015.
[3] Gaurav Tembhunikar, Ajit Chaudhari, Nilesh Wani, Atul Gajare and Pankaj Gajare, “ A Review on Reactive Power Compensation Techniques using FACTS Devices”, International Journal of Engineering and Management Research, vol 4, no.1, pp. 76-80, Feb. 2014.
[4] Manisha Jaswani, Satyadharma Bharti and S.P Dubey, “A Study of Reactive Power Compensation in Transmission System”, International Journal of Advanced Research and Studies, pp.351-353,March 2015.
[5] Dipti Mohanty, Aziz Ahamad and A.Khan, “Modeling, Simulation and Performance Analysis of FACTS Controller in Transmission Line”, International Journal of Emerging Technology and Advanced Engineering, vol.3, no.5, pp. 428-435, May.2013.
[6] B.S. Krishna Verma, G. Vineesha, J. Trupti Kumar, K.Sasank and P.Naya Yasasvi, “Simulated Control System Design of a Multilevel STATCOM for Reactive Power Compensation”, in IEEE-international Conference On Advances In Engineering, Science And Management, pp. 257-263, March.2012.
[7] S.Selvakumaran and S.M Kalidasan, “ Power Quality Improvement in Transmission System using FACTS Devices”, in IEEE Online International Conference on Green Engineering and Technologies, pp. 1-4, Nov.2016.
© 2017, IRJET | Impact Factor value: 5.181 | ISO 9001:2008 Certified Journal | Page 367 [9] Samima Akter, Anulekha Saha and Priyanath Das, “
Modeling, Simulation and Comparison of Various FACTS Devices in Power System”, International Journal of Engineering Research & Technology (IJERT), vol.1, no.8, Oct. 2012.
[10] P.S Sensarma, K.R. Padiyar and V. Ramanarayanan, “Analysis and Performance Evaluation of a Distribution STATCOM for Compensating Voltage Fluctuations”, IEEE Trans. on Power Delivery, vol.16, no.2, pp.259-264, April.2001.
[11] Khaliq Ahmed and C Veeresh , “ An Extensive Review on Reactive Power Compensation using STATCOM and SVC”, International Journal of Emerging Technology and Advanced Engineering , vol.4, no.11, pp.131-134, Nov. 2014.
[12] Joaoi, Yutaka Ota, Yuji Shitano, Naoto Niimwra and Hirofumi Akagi, “A Phase-Shifted-PWM D-STATCOM Using a Modular Multilevel Cascade Convertor (SSBC)-Part I : Modelling, Analysis and Design of Current Control”, IEEE Trans.on Industry Applications, vol.51, no.1, pp. 279-288, Feb.2015.
[13] Jadhav Prajakta S. and A.R Thorat, “ Simulation of Sinusoidal Pulse Width Modulation (SPWM) Based DSTATCOM for Compensation of Reactive power”, ARPN Journal of Engineering and Applied Sciences,vol.10, no.7,pp.2887-2892, April 2015.
[14] Manisha Rani and Anju Gupta, “ Steady State Voltage Stability Enhancement of Power System using FACTS Devices”, in IEEE Power India International Conference (PIICON), pp. 1-6, Dec.2014.
[15] Juan Dixon, Luis Moron, Jose Rodriguez and Ricarolo Domke, “Reactive Power Compensation Technologies : State of-the-Art Review”, in IEEE Proceedings, vol.93, no.12, pp.2144-2164, Dec. 2005.
[16] R.Mienski, R.Pawelek, I.Wasiak, “Shunt compensation for power quality improvement using a STATCOM Controller; modeling and simulation”, in IEE Proceedings-Generation, Transmission and Distribution, vol.151, no.2, pp. 274-280, April 2004.
[17] Dong Shen and P.W. Lehn, “Modeling, Analysis, and Control of a Current Source Inverter-Based STATCOM”, IEEE Trans. on Power Delivery, vol.17, no.1, pp.248-153, Jan. 2002.
[18] Timothy J.E Miller, Reactive Power Control in Electric Systems, John Wiley & Sons, 1807-1982.
[19] Farhad Shahnia, Sumedha Rajakaruna and Arindam Ghosh. Static Compensators (STATCOMs) in Power Systems, Springer, 2015.