Pollution of soils by lead and its uptake and pathways in
the ecosystem.
EASTWOOD, Ian Wynne.
Available from Sheffield Hallam University Research Archive (SHURA) at:
http://shura.shu.ac.uk/19593/
This document is the author deposited version. You are advised to consult the
publisher's version if you wish to cite from it.
Published version
EASTWOOD, Ian Wynne. (1987). Pollution of soils by lead and its uptake and
pathways in the ecosystem. Doctoral, Sheffield Hallam University (United Kingdom)..
Copyright and re-use policy
SHEFFIELD CITY POLYTECHfv\C LIBRARY
TOTLEY SHEFFIELD
SI7 4AB
TELEPEN
100213231 2
in mu ii i
'i
(a
i 3
Sheffield C ity Polytechnic Totley Site Library
REFERENCE ONLY
This book must not be taken from the library
PL 1d
Fines are charged at 50p per hour
02 MAY 2002
(j^o 5 JUL 2002
ProQuest Number: 10694474
All rights reserved
INFORMATION TO ALL USERS
The quality of this reproduction is dependent upon the quality of the copy submitted.
In the unlikely event that the author did not send a com plete manuscript
and there are missing pages, these will be noted. Also, if material had to be removed,
a note will indicate the deletion.
uest
ProQuest 10694474
Published by ProQuest LLC(2017). Copyright of the Dissertation is held by the Author.
All rights reserved.
This work is protected against unauthorized copying under Title 17, United States Code
Microform Edition © ProQuest LLC.
ProQuest LLC.
789 East Eisenhower Parkway
P.O. Box 1346
POLLUTION OF SOILS BY LEAD AND ITS UPTAKE AND PATHWAYS IN THE ECOSYSTEM.
by
IAN WYNNE EASTWOOD BA(Hons) PGCE
A thesis submitted to the Council for National Academic Awards in partial fulfilment of the
requirements for the degree of Doctor of Philosophy.
Sponsoring Establishment : Department of Recreation and Environmental Studies,
Sheffield City Polytechnic.
Collaborating Establishment : Department of Environmental Health and Housing,
North East Derbyshire District Council.
T h
ABSTRACT,
POLLUTION OF SOILS BY LEAD AND ITS UPTAKE AND PATHWAYS IN THE ECOSYSTEM.
by Ian Wynne Eastwood. BA (Hons) PGCE
The thesis reviews literature relating to lead in the environment with particular reference to the distribution and pathways of lead in the soil and plant ecosystem. Methods of conducting large area soil surveys and assessing the distribution of lead and other heavy metals including cadmium, copper and zinc are also examined. A survey was conducted over a 370 km2 area of North East Derbyshire, England. Maps showing the distribution of the metals reveal anomalously high concentrations related in many instances to past industrial activity.
A simple reliable and rapid acid digestion procedure was developed and the procedure evaluated through an interlaboratory survey involving 22 laboratories. This demonstrated that analysts should seek to improve analytical performance through achieving better interlaboratory correlation rather than intralaboratory precision. A stratified random sampling protocol was developed and evaluated which allowed an estimate of precision to be placed on the results of the trace metal soil survey.
CQOTBPTS
Abstract.
Contents.
Acknowledgements.
Chapters 1 - 6 contents pages.
List of Tables.
List of Figures.
List of Plates.
Page.
i.
ii.
iii. - iv.
v. - x.
xi. - xiii,
xiv. - xv.
xvi.
Chapter 1. Introduction.
Chapter 2. Determination of lead in soil using a
large sample batch digestion procedure, 60
Chapter 3. Development of a sampling protocol for large area soil surveys of trace metal
contamination. 92
Chapter 4. The distribution of lead and other heavy metals in the soils of Rorth East
Derbyshire, England. 121
Chapter 5. Determination of lead in plant material
by atomic absorption spectrometry. 154
Chapter 6. An assessment of the contribution of soil and aerially deposited lead to the
distribution of lead in potato plants. 179
References.
Lectures and meetings attended. Publications and conference papers.
Appendices 1 - 6 .
267 296 298
ACKNOWL
EDGEMENTS,
I would particularly like to thank the following people for their assistance during the work:
Mr D G Hunt and Mr N Tranmer (Forth East Derbyshire District Council, Department of Environmental Health and Housing) and Councillor C Fox for their financial support, loan of British Standard Dust Deposit Guages and interest in the North East Derbyshire heavy metal soil survey; Mr A Reeson and Mr D Skinner and for the hours of work by the Community Service Agency Teams of Clay Cross and Eckington during the long months of soii sample collection; Dr D Turner (Associated Octel Company, Ellesmere Port, Cheshire) for his interest and the donation of a micro balance; Mr A F Barnes (Cookson Group pic [ formerly Lead Industries Group], London) for his interest and very welcome financial support to the extent of £500; Mr C R Robin (Electronic Development Co., Guildford, Surrey) for the manufacture of nickel microsampling cups and cup trays; the landowners who gave permission to have access to their land during the study, including Mr Pelly (Wentworth Estates, Wentworth, South Yorkshire), Hr Weldon (Hood Hill Farm, Nr. Chapeltown, South Yorkshire) and Mr Hall (Rowter Farm, Castleton, Derbyshire); Dr C W McLeod (Department of Chemistry, Sheffield City Polytechnic) for providing plant and soil certified reference materials; all the laboratory technical staff who over the years have given valuable assistance when required, Mr A P Newman, Mr S Douglas, Mr K Woodhouse, Mr S Devine and for
cartographic advice Miss V Hitchen and Mrs J Butt.
My present supervisors, Mike Wild and Phil Newell (Department of
Recreation and Environmental Studies, Sheffield City Polytechnic), Dr David Mowthorpe (Department of Chemistry, Sheffield City Polytechnic) and my former supervisor Prof. Ken Jackson (Department of Chemistry, University of Saskatchewan, Canada -formerly Sheffield City Polytechnic) for their encouragement, advice, perseverance, understanding, considerable expertise and guidance throughout this work; Dr M S Cresser for acting as my external examiner.
CHAPTER 1. IFTRODUCTIOK,
Page.
1.1. Lead in the environment. 1
1.2. Sources of lead. 5
1.3. Lead in the soil ecosystem.. 10
1.3.1. Available lead. 11
1.3.2. Total lead. 16
1.3.3. Soil sample preparation. 18 1.3.4. Soil sampling and surveying. 20
1.4. Lead in the plant ecosystem. 22
1.4.1. Plant sampling and surveying. 24 1.4.2. Plant sample preparation. 25
1.5. Analysis of soil and plant materials. 30
1.5.1. Analytical techniques. 31
1.5.2. Errors and contamination. 40 1.5.3. Standard reference materials (SRMs)
and quality control. 40
1.6. Soil - plant - air relationships to lead. 43 1.6.1. Movement of lead in soil to plants. 44 1.6.2. Movement and distribution of lead in plants. 49 1.6.3. Movement of lead to aerial plant parts. 51
1.7. The research programme. 56
1.7.1. Justification for research approach. 56 1.7.2. Practical limitations and methodologies. 58
1.7.3. Summary of aims. 59
CHAPT
ER 2,
DETERMINATION OF LEAD IN SOIL USING A
LARGE BATCH DIGESTION PROCEDURE
Page.
2.1. Introduction. 60
2.2. Experimental. 62
2.2.1. Equipment. 62
2.2.2. Reagents. 63
2.2.3. Procedures. 63
2.2.3.1. Collection and preparation of
soil samples. 63
2.2.3.2. Determination of total lead
in soil. 65
2.3. Optimisation of digestion technique. 65
2.3.1. Concentrated nitric acid vs.
1 + 1 nitric acid. 68
2.3.2. Effect of digestion time on digestion
efficiency. 69
2.3.3. Effect of addition of hydrogen peroxide. 72 2.3.4. Summary of optimised digestion technique. 72
2.3.5. Precision testing. 74
2.4. Evalution of digestion technique by
interlaboratory survey. 74
2.4.1. Preparation and collection of survey
samples. 75
2.4.2. Survey procedure. 77
2.4.3. Results. 78
2.4.4. Discussions. 85
CHAPTER 3. DEVELOPMENT QF A SAMPLING PROTOCOL FOR LARGE AREA SOIL SURVEYS QF TRACE METAL CONTAMINATION.
Page.
3.1. Introduction. 92
3.2. Experimental. 98
3.2.1. Equipment and reagents. 98
3.2.2. Soil survey area and sampling. 98
3.2.3. Soil sample preparation and the
determination of lead and copper. 101
3.3. Distribution of lead and copper. 101
3.4. Development of sampling protocol. 110
3.4.1. Simple random sampling. Ill
3.4.2. Stratified random sampling. 114
3.5. Conclusions. 118
CHAPTER 4. THE DISTRIBUTION OF LEAD AND OTHER HEAVY.METALS INTHE SOILS QF NORTH EAST DERBYSHIRE. ENGLAND.
Page.
4.1. Introduction. 121
4.1.1. Geology. 122
4.1.2. Soils. 125
4.1.3. Other factors of potential influence. 126
4.2. Pilot survey. 126
4.3. Experimental. 127
4.3.1. Equipment and reagents. 127
4.3.2. Sample collection and preparation. 127 4.3.3. Determination of total lead, zinc,
capper and cadmium. 130
4.4. Results and data presentation. 130
4.4.1. Lead. 137
4.4.2. Zinc. 143
4.4.3. Copper. 147
4.4.4. Cadmium. 147
CHAPT
ER 5.
DETERMINATION QF LEAD IN PLANT MATERIAL
BY ATOMIC ABSORPTION SPECTROMETRY.
Page.
5.1. Introduction. 154
5.1.1. Solid sample microsampling cup flame AAS. 157
5.1.2. Equipment and reagents. 160
5.1.3. Sample collection. 161
5.1.4. Sample preparation procedures. 162
5.2. Ashed slurried samples compared with ashed
whole punches. 167
5.2.1. Dandelion leaf. 167
5.2.2. Broad dock leaf. 169
5.2.3. Potato tuber - Pentland Javelin. 170
5.3. Whole plant analysis - Cowslip. 173
5.4. Conclusions. 176
CHAPTER 6. AN ASSESSMENT QF THE CONTRIBUTION QF SOIL ARP AERIALLY DEPOSITED LEAD TO THE DISTRIBUTION QF LEAD IN POTATO PLANTS,
Page.
6.1. Introduction. 179
6.1.1. Selection of study site locations. 182 6.1.2. Preparation of experimental soil media. 191 6.1.3. Selection and cultivation of potato plants. 193
6.1.4. Sample collection. 195
6.2. Analysis of soils after harvesting potato plants. 196
6.2.1. 1 + 1 nitric acid extraction. 197
6.2.2. 0.5 M acetic acid extraction. 198
6.2.3. 0.05 M ammonium EDTA extraction. 199 6.2.4. 1 M ammonium nitrate extraction. 199
6.2.5. N, P, K status. 200
6.2.6. Organic content (% loss on ignition). 201
6.2.7. pH. 202
6.2.8. Results and discussion. 203
6.3. Determination of lead in dust deposited material. 211
6.3.1. Discussion. 216
6.4. Estimation of tuber yield, plant growth and
moisture content. 219
6.4.1. Discussion. 226
6.5. Distribution of lead in potato plants using a
perchloric/nitric acid extraction procedure. 229 6.5.1. Sampling, sample preparation and analysis. 230
6.5.2. Results and discussion. 232
6.6. Distribution of lead in potato plants using solid sample microsampling cup flame AAS
procedure. 247
6.6.1. Sampling and sample preparation. 248 6.6.2. Solid sampling microsampling cup
procedure. 249
6.6.3. Results and discussion. 249
List of Tables,
1. Historical worldwide consumption and anthropogenic emissions of lead to the air.
2. Concentration of lead in the U. S. today and estimated natural concentrations.
3. Consumption of lead in the U.K., 1982.
4. Some reagents used in liquid/liquid extraction.
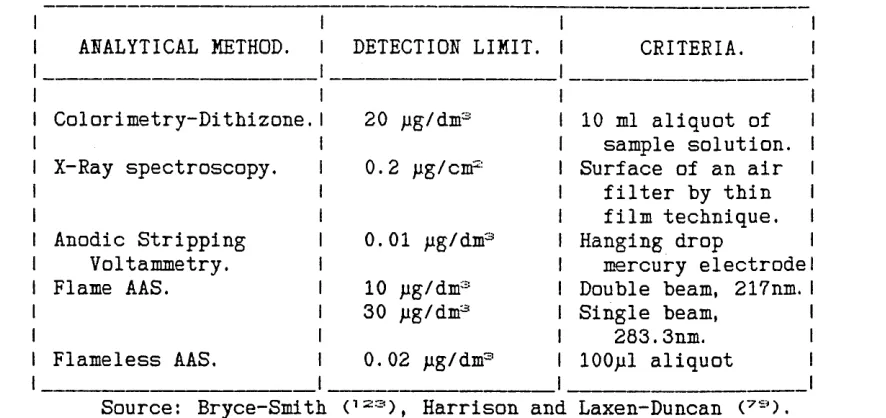
5. Detection limits for lead reported for various analytical techniques.
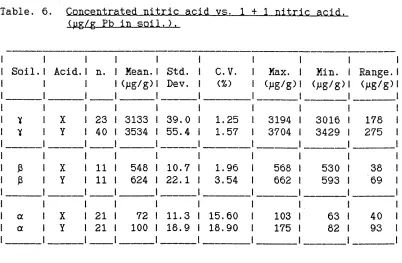
6. Concentrated nitric acid vs. 1 + 1 nitric acid. (pg/g Pb in soil).
7. Results of 't' tests of data in table 6.
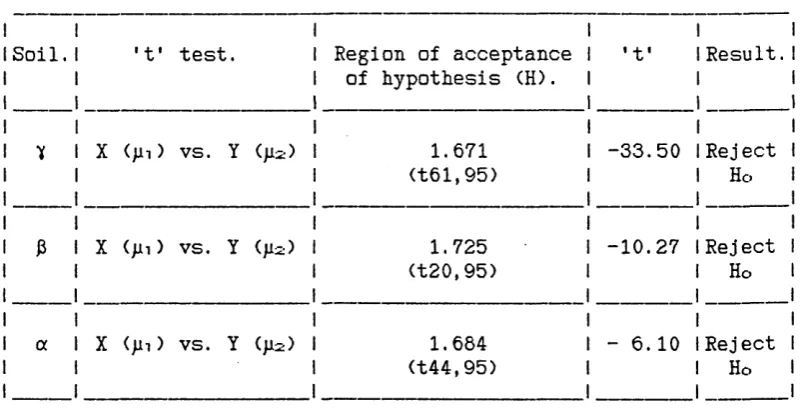
8. Effect of digestion time (A) and addition of hydrogen peroxide (B) on 1 + 1 nitric acid digestion efficiency (pg/g Pb in soil).
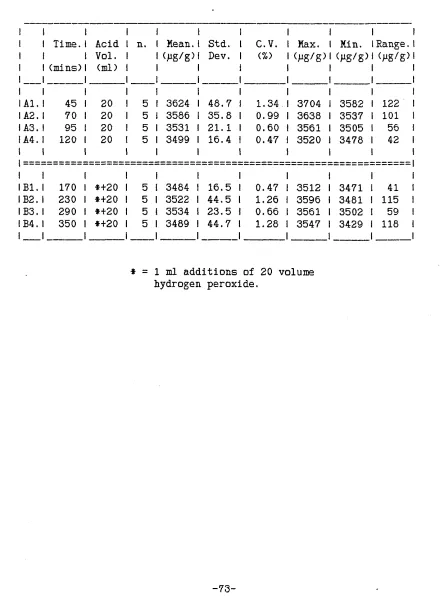
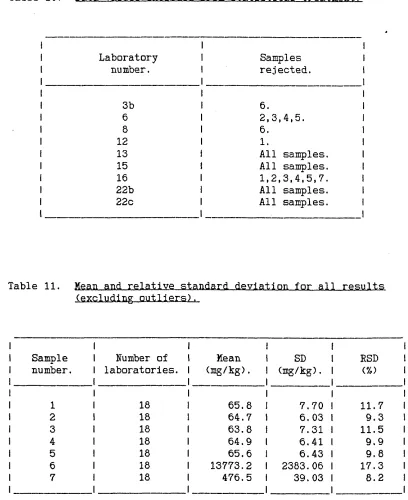
9. Results from all laboratories (Pb mg/kg soil). 10. Data values excluded from statistical treatment. 11. Mean and relative standard deviation for all
results (excluding outliers).
12. Intralaboratory precision for Soil A. (Samples 1 - 5 ) ® .
13. Analysis of variance for results from samples 1 - 5 (Soil A).
14. The effect of analytical experience and procedure on a) sample 6 (Soil B), b) sample 7 (Soil C). 15. Comparison between the results for Laboratory 20
and the mean results for all other laboratories, for Soils A, B and C.
16. Results of total lead in soils for all 121 sample locations in the km-square study (mg/kg Pb).
17. Results of total copper in soils for all 121 sample locations in the km-square study (mg/kg Cu).
18. Statistical summary of total lead and copper
concentrations for km-square study (all 121 samples).
Page.
19. Statistical summary of lead (a) and copper (b) concentrations for stratum A, B and C. *
20. Summary of total heavy metals in soil for complete survey area (n = 369) (mg/kg).
21. Comparison of ashed slurried punches (X) with ashed whole punches (Y) a) Dandelion, b) Broad Dock (pg/g Pb).
22. Comparison of ashed slurried punches (pressure cooked vs. mixer mill ground) vs. ashed whole punches,
for potato tuber slices (pg/g Pb).
23. Summary of concentrations reported for lead in potatoes.
24. Summary of field study site locations.
25. Summary of the concentrations and USDs of some
components of the soil media X, Y and Z (ALL SITES). 26. Lead in soil results using various extraction
procedures (ALL SITES).
27. The relative extraction efficiencies of the three soil extractants used (% of 'total’ element extracted by each extractant).
28. Results for lead in dust deposited material using British Standard Dust Deposit Gauges (BSDDGs)
(pg Pb/mg/nP/day) (Feb-July 1984).
29. Results for lead in dust deposited material using the Ground Level Dust Deposit Gauges (GLDDGs) during two sampling periods (pg Pb/mg/nF/day).
30. Tuber yield (ALL SITES). 31. Stem yield (ALL SITES).
32. Percentage water loss on drying parts of a potato plant (for conversion for Dry wt. to Vet wt.). 33. Lead in parts of potato plants by acid digestion
procedure. Results for leaves (ALL SITES) (pg/g dwt).
34. Lead in parts of potato plants by acid digestion procedure. Results for stems (ALL SITES)
Page
35. Lead in parts of potato plants by acid digestion procedure. Results for roots, tuber peel and tuber (peeled) (ALL SITES) (pg/g dwt).
36. Summary of the mean lead concentrations for sites 1 - 7 for soil media X, Y and Z
(Acid digestion procedure results).
37. Kean concentration of lead in potato plant sections grown in soil medium X (ALL SITES)
(pg/g dwt).
38. Kean concentration of lead in potato plant sections grown in soil medium Y (ALL SITES)
(pg/g dwt).
39. Kean concentration of lead in potato plant sections grown in soil medium Z (ALL SITES)
(pg/g dwt).
40. Summary of overall mean lead concentrations for sites 1 - 7 for soil media X, Y and Z.
A) Kicro sampling cup procedure results (pg/g). B) Acid digestion procedure results (pg/g).
235
236
252
253
254
261
List of Figures
1. Summary of the sources and routes of lead to the aerial parts of plants.
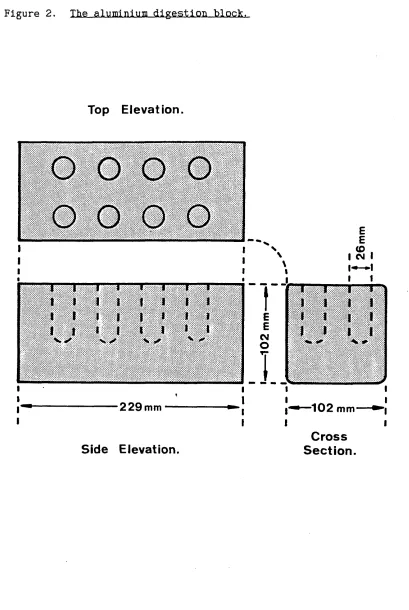
2. The aluminium digestion block.
3. The deviation of the results for each laboratory about the overall mean for: a) samples 1 - 5
(Soil A); b) Soil B; c) Soil C.
4. Kap of km-square illustrating 121 grid sample locations together with sampling strata.
5. Lead concentrations in the km-square study area (contour intervals are 50, 100, 200, 400, 600, and 800 mg/kg).
6. Copper concentrations in the km-square study area (contour intervals are 20, 30, 40, 50, 60 and 80 mg/kg).
7. 3-Dimensional projection of lead distribution.
8. 3-Dimensional projection of copper distribution.
9. Overall precision for monitoring (a) lead and (b) copper in soil when 121 grid locations are randomly sampled.
10. Survey area features, North East Derbyshire. 11. Generalised geology of the survey area,
North East Derbyshire.
12. Subregions A - P used in the sampling programme. 13. Total lead in soil distribution.
14. Total zinc in soil distribution. 15. Total copper in soil distribution.
16. 3-Dimensional map of the distribution of lead in soil a) viewed form the west,
b) viewed from the south west.
17. 3-Dimensional map of the distribution of zinc in soil viewed from the west.
18. 3-Dimensional map of the distribution of copper in soil viewed from the west.
Page.
19. Sites of historical lead smelting and processing activity.
20. Industrial archeological geochemical prospecting.
21. Distribution of lead in Primula veris L.(X 1) (jig/g Pb dry wt.)
22. Field study site locations.
23. Map of roadside transect study area.
24. Deposition of lead in dust for sites 5, 6 and 7 during February to July 1984 using British Standard Dust Deposit Gauges (BSDDGs).
25. Diagram of Ground Level Dust Deposit Gauge (GLDDG) used during the study to estimate ground level aerial dust exposure.
26. GLDDG results showing lead deposition/day at sites 1 to 7 during two sampling periods.
27. Comparison between leaf concentration and surface contamination at all sites for a) plants growing in soil medium X and b) plants growing in soil medium Y.
28. Comparison between stem concentration and surface contamination at all sites for a) plants growing in soil medium X and b) plants growing in soil medium Y.
29. The locations of plant sample sections used during the microsampling cup procedure.
30. Comparison of results obtained using the
microsampling cup procedure on a single specimen grown in soil medium X at Site 1 (Roadside) and 8
(Greenhouse).
31. Comparison of results obtained using the
microsampling cup procedure on a single specimen grown in soil medium Y at Site 1 (Roadside) and 8
(Greenhouse).
32. Comparison of results obtained using the
microsampling cup procedure on a single specimen grown in soil medium Z at Site 1 (Roadside) and 8
List q
i
plates.
PLATE PLATE PLATE PLATE PLATE PLATE PLATE PLATE PLATE PLATE PLATEI. The aluminium block digestion system. II. Stone Edge cupola - a site of historical
lead smelting activity producing a contaminated rural environment. III. Sampling leaf discs using a stainless
steel punch.
IV. Transect sites 1,3,4,5, used during the roadside study next to the A6135. V. Study site 6, near Rowter Farm,
Derbyshire.
VI. Study site 7, at Wentworth Voodhouse, South Yorkshire.
VII. The use of a portable cement mixer in homogenisation of the soil growing media X, Y and Z.
VIII. Tuber yield at site 1 (Roadside) for soil media X, Y and Z.
L = 'low' lead concentration, soil medium X M = 'medium' lead concentration, soil medium Y H = 'high' lead concentration, soil medium Z. IX. Tuber yield at site 6 (Rowter Farm) for soil
media X, Y and Z.
L = 'low' lead concentration, soil medium X M = 'medium' lead concentration, soil medium Y H = 'high' lead concentration, soil medium Z. X. Tuber yield at site 8 (Greenhouse) for soil
media X, Y and Z.
L = 'low' lead concentration, soil medium X M = 'medium' lead concentration, soil medium Y H = 'high' lead concentration, soil medium Z. XI. Relative stunting of plants after 6 weeks
in the field (Site 7.).
Left = plants in soil medium X.
Middle = plants growing in soil medium Y. Right = plants growing in soil medium Z.
CHAPTER 1. INTRODUCTION.
1.1. Lead in the environment.
The last 20 years have seen a growth in public interest in the condition of the environment and in particular aspects of its pollution. Whilst there are many potential environmental pollutants, perhaps no other pollutant has stirred up quite as much emotion in the population as the heavy metal lead. For centuries it has been recognised that lead is a poison. Frank poisoning, rare today, has historically been associated with human exposure to lead in food and drink, for example in ancient Rome ('), and also through occupational exposure. Today occupational exposure is rare with legislation for the work place to protect the employee <2 ). Public concern has recently centred on the levels of lead in the body which result from general environmental exposure at concentrations below which clinical signs and symptoms appear. These fears have been fuelled to some extent by the debate over the contribution which alkyl lead, added to petrol, may have on concentrations of lead in air and soil, and subsequently the levels of lead in food.
This concern has resulted in the undertaking of a large volume of research into the occurrence and mobility of lead in the environment. Several reviews have been published which summarise much of the published work produced during this period
( 3 , 4 , 6 , 6 , 7 , 6 , 9 , 1 0 ^
In 1974 the Fourth Report of the Royal Commission on Environmental Pollution C11) recognised the public concern and declared an intention to review the question of lead pollution in the environment. Since 1974 successive governments have reduced the levels of lead additives in petrol and paint. In 1978 the Department of Health and Social Security set up a working party chaired by Professor Lawther to 'review the overall effects on health of environmental lead from all sources and, in particular, its effects on the health and development of children and to assess the contribution lead in petrol makes to the body burden.'
The Working Party Report has been criticised by the Conservation
Society (13) and by the Campaign for Lead-Free Air (CLEAR) (1A> on the basis that the Working Party understated the effects on health of low level lead concentrations, the influence of lead in petrol, the airborne source/food pathway and also failed to produce effective measures for reducing levels of lead in the environment. Two further reports have been published which comprehensively review the subject, both the U.S. National Academy of Sciences (ie> and the Australian Academy of Sciences (1G), support the recommendation to reduce the exposure of the general public, in particular children, to lead. Whilst the recommendations of these reports are not necessarily applicable to the United Kingdom the findings .in 1983 of the Ninth Report of the. Royal Commission on Environmental Pollution (1V) are of importance.
The Ninth Report, chaired by Professor Southwood, also called for all possible steps to be taken to remove lead from the environment including the removal of lead from petrol, the development of alternatives to lead shot used for fishing and a reduction in the level of lead in paints. The Report not only recommended the removal of lead from petrol in the United Kingdom, but also called for a reduction of lead in petrol in other countries. This was to reduce the amount of lead in imported food and to reduce the concentrations of lead in transfrontier aerial movements. The Ninth Report noted that the "present average blood lead concentration of the U. K. population is approximately one quarter of the level at which features of frank lead poisoning occasionally occur (around 60 pg/dl)". No other toxin is so widely distributed in human and animal populations to the extent that it is
-3-universally present at levels greater than "one tenth of that at
which clinical signs and symptoms occur". For most people in the
U. K. the Ninth Report again identified "food and drink as the
major pathway for lead uptake", but stressed that "there is
considerable uncertainty as to the relative contributions of the
several sources of lead to this pathway", It went on to recommend
that "there should be continuing effort to gain a better
understanding of the various pathways and mechanisms by which food
is contaminated with lead", and "that priority should be given to
research to assess the relative contribution that different sources
and pathways can make to lead in dust". The Government (ie)
responded to the Ninth Report by taking several positive steps to
remove lead from the environment. In particular it set up a
programme for the removal of lead from petrol, which has resulted
in the current availability of lead free petrol in 211 service
stations in Britain (1S’). The policy was reaffirmed in the recent
1987 Budget <1S>) when Mr Nigel Lawson, the Chancellor of the
Exchequer, announced the introduction of a differential duty allowing lead-free petrol, which costs more to refine, to be made available at the same retail price of leaded petrol.
1.2. Sources pf.lesLtL
There are two broad classifications of sources of lead in the
environment, natural and anthropogenic sources (resulting from
human activities). Natural sources owe their origin to native lead
(Pb, from the latin plumbum). It occurs in insoluble forms
primarily as sulphides (galena PbS), but can also be present as
oxides (anglesite PbSCLt and crocoite PbCrCU), or as carbonate
(cerussite PbCCb), and it is in these forms that it is normally
extracted from the earth by mining activity. The lead content of
granitic rocks is mainly controlled by their potassium feldspar
content since lead is of a similar ionic size to that of potassium.
The mean lead content of some 1220 granitic rocks has been
calculated at 23 mg/kg. Metamorphic rocks typically have a lower
lead concentration than granitic rocks, the average of 3846
gneisses and schists being 17 mg/kg. Sedimentary rocks are
generally of a lower concentration than granite with the mean lead
content of 924 sands and sandstones around 10 mg/kg, of 363 clays
and shales 23.3 mg/kg, and of 779 black shales 23.8 mg/kg (2°).
Mineral veins, containing ore materials have considerably higher
concentrations than other parent rocks.
The lead is released to the earth's surface by natural weathering
of rocks, by igneous activity, by the radioactive decay of radon
gas (in the form of the isotope 210Pb), windblown dusts, fires and
by vegetation. Nriagu (21) has estimated a worldwide annual
emission of lead to air of 24.5 thousand tonnes from natural
sources compared with 449 thousand tonnes from anthropogenic
sources.
-5-It is difficult to quantify the natural concentrations of lead in
the environment since man has been mining and processing lead for
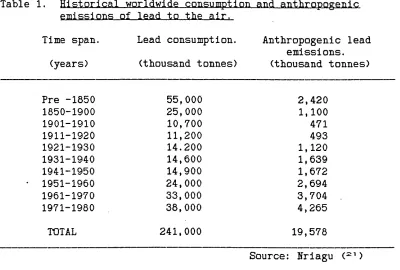
thousands of years. The early Egyptians were glazing pottery with lead as far back as 7000-5000 BC, with the earliest known specimen of metallic lead predating 3800 BC (22). Veil known in biblical times, it is even mentioned in the book of Exodus, with the process of cupellation alluded to in the book of Jeremiah. Lead was not commercially useful until Roman times where it was being produced as a waste by-product of the silver mining industry in Europe (23). Table 1 illustrates the growth in the consumption and anthropogenic emissions of lead on a worldwide basis as estimated by Hriagu (21).
Table 1. Historical worldwide consumption and anthropogenic emissions of lead to the air.
Time span, (years)
Lead consumption, (thousand tonnes)
Anthropogenic lead emissions, (thousand tonnes)
Pre -1850 55,000 2,420
1850-1900 25,000 1,100
1901-1910 10,700 471
1911-1920 11,200 493
1921-1930 14.200 1,120
1931-1940 14,600 1,639
1941-1950 14,900 1,672
* 1951-1960 24,000 2,694
1961-1970 33,000 3,704 .
1971-1980 38,000 4,265
TOTAL 241,000 19,578
Source: Hriagu (21)
[image:27.612.103.503.308.578.2]result of contamination during sampling and analysis (2A).
Chronological studies of the change in concentration of lead with
increased depth in peat (2&> and pack ice (2e) illustrate how lead
levels have risen over the earth's surface particularly since the
Industrial Revolution (27). Table 2, shows the recent
concentrations of lead in various environmental media that have
been calculated and compared with estimates for natural
environments.
Table 2. Concentration of lead in the U.S. today and estimated natural concentrations.
Environmental Present day Estimated natural Ratio of medium. concentration. concentration. concentrations
AIR.
Rural/remote 0.1-100 ng/m3 0.01-0.1 ng/m3 10-1,000
Inhabited 0.1-10 pg/m3 0.1-1.0 ng/m3 100-10,000
SOIL.
Rural/remote 5-50 pg/g 5-25 pg/g 1-2
Inhabited 10-5,000 pg/g 5-25 pg/g 2-200
WATER.
Fresh 0.005-10 pg/1 0.005-10 pg/1 1
Marine 0.005-0.015 pg/1 0.001 pg/1 10
FOOD. 0.01-10 pg/g 0.0001-0.1 pg/g 100
Source: Rational Research Council (ie)
It is apparent from Table 2 that anthropogenic emissions have raised the levels of lead in most instances above what might be considered a natural background level. The anthropogenic lead is released into the environment by non-ferrous metal mining, iron and steel production, waste incineration, petrol combustion, smelting and refining of the lead ore, and other ores in which lead may be present. It is also released during the production, utilisation,
-7-recycling and disposal of lead materials and the burning of coal.
Many studies have been performed to monitor the effect that lead,
as an anti-knock compound in petrol, has upon soils and plants
along highways <2e *23•30•31•32•33•3A•33*36 *37 *33-39-40'4 ''*2) in
locations including Australia <<d3), Venezuela iAA) and Hong Kong
<A5). Other studies have looked at sources close to the human
interface, including those around smelting complexes (46I4 7 I48,431so,5i,E21E3,e4,ss1se)) mine workings and spoil heaps (67,66,69,60,61,62,63,64,65,66,67) an(i industrial sources in
general <3e•63 *33 *70).
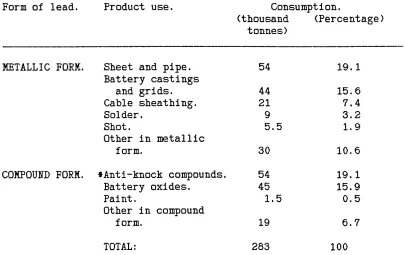
In the U.K. 293 thousand tonnes of lead were processed in 1982, approximately 60 per cent owing its origin to recycling of the metal. A breakdown of its use is shown in Table 3. Much of the lead used in a metallic form is recoverable, and in some cases up to 90% of the metallic product can be recovered by recycling. That which cannot be recovered together with much of the compound lead eventually reaches the environment by normal biogeochemical pathways until trapped in a relatively permanent environmental sink such as soil or ocean sediments. It is through these pathways that lead has become so widely dispersed that no part of the earth's surface or any form of life remains uncontaminated by anthropogenic lead.
ultimately based on soil and plants, is closely monitored in order
to determine the contribution to the total body burden of lead.
Davies (71) discusses urban sources of pollution in relation to the
levels of lead in London garden soils and their suitability for
growing vegetables for human consumption. His findings showed that
a substantial proportion of root and leafy vegetables grown in
London gardens and allotments probably exceeded the 1 mg/kg (wet
weight) limit for lead in food C72). Other studies in urban areas
and domestic gardens reinforce these findings
(49 , 73 , 74 , 7Ei , 76 , 77 , 78 ) ^
Table 3. Consumption of lead in the U.K.. 1982.
Form of lead. Product use. Consumption.
(thousand (Percentage) tonnes)
METALLIC FORM. Sheet and pipe. 54 19. 1
Battery castings
and grids. 44 15.6
Cable sheathing. 21 7.4
Solder. 9 3.2
Shot. 5.5 1.9
Other in metallic
form. 30 10.6
COMPOUND FORM. ♦Anti-knock compounds. 54 19. 1
Battery oxides. 45 15.9
Paint. 1.5 0.5
Other in compound
form. 19 6.7
TOTAL: 283 100
♦Approximately 80% of manufactured anti-knock compound is exported. Source: 9th Royal Commission Report (17)
Whilst there are many sources of lead in the environment this review will confine itself to studies closely related to aspects of lead in soil, which is the major sink for lead, and lead in plants
[image:30.612.97.503.317.572.2]-9-(particularly food stuffs) as these constitute the major routes by
which man is exposed to lead.
1.3. Lead in the soil
..ecosystem-Lead exists naturally at 'background' levels in all soils,
originating from the weathering and decomposition of the parent
rock material, igneous, metamorphic or sedimentary in origin (e).
The concentrations are approximately equal to the average
concentrations of the earth's lithosphere (7-’). The world-wide
average lead concentration of 4,970 soils has been calculated at
29.2 mg/kg with a range of <1-888 mg/kg C220). Harrison and
Laxen-Duncan <7®), suggest typical concentrations for natural soils at
between 10 mg/kg and 200 mg/kg., with polluted or mineralised soils
between 100 mg/kg and 10,000 mg/kg.
Anthropogenic lead is made available to the soil by a variety of
environmental processes (A .8 -79.8o)| primarily by the atmospheric deposition of vehicular particulate lead, smelter emissions and
remobilisation by wind of contaminated dusts. Many workers have
established that the highest concentrations of lead in soil
profiles generally occur at the surface horizons (*2 ,0 1,6 2,8 3)
owing to enrichment from the atmosphere and by biological
processes.
Lead may exist in the soil in a variety of chemical forms
which govern the type of analysis which can be performed on the
soil. When tightly bound in complex molecules lead is very
reagents may be required in order to determine the total lead
content of the soil. Such species of lead may not be readily
available to plants for uptake pi.eA.ee.ee) an£ therefore it is
often important to know the extractable or available lead content
of the soil, if plant uptake of lead is being investigated (e7).
1.3.1. Available lead.
Little is known about the mobility and availability of lead in
soils, but it has been observed that lead is lost from soils only
very slowly by leaching. Therefore a soil is likely to remain
polluted for a long period of time C7S). It tends to accumulate in
the topsoil and litter horizons (43'ee), held with other plant
available nutrients in the soil-clay-humus complex (e,6 i,7 9 1ee))
although lead itself is not an essential nutrient (®). Plant
availability to lead is dependent on a number of factors (67,6i)7i.79,eBIe9(9ol9i(92)) including soil texture
(65,64,85,32,93)^ cation exchange capacity organic matter
(7 9,ee,9 4)| an(i particular pH (79.es189,9o 192)) latter
factor is important as it has been noted that raising of pH by the
application of lime or phosphate reduces the availability of lead
to plants (eiS), therefore pH can be an important factor in
experimental design. It also affects the extractability of lead
from samples and its value should be stated where possible to
permit comparative interpretations of results. Crump and Barlow
(®3>, discuss factors governing availability and the problems
associated with its assessment. Extracting available lead is problematic, not least since the use of extractants is generally
-11-not underpinned by any significant theoretical framework, though it
has been of use in agronomy and environmental research (3&).
The extraction of available lead has been achieved through the use
of a variety of extractants and the efficiencies of various methods
have been investigated -96-97-90). Khan (eA) identified four
groups of lead compounds and suggested techniques suitable for
extraction of each type. The first group includes ionic and
molecular forms of the metal, removable from samples by water (G7).
Readily exchangeable metal ions from inorganic clay or organic
material can be removed by ion exchange with ammonium acetate or
other neutral salts p9.8B,92,96)i More firmly bound ions in
exchange complexes can be displaced using dilute acetic acid (3818B,9il95(98l99)) or other dilute acids, such as hydrochloric
acid (A3>. Predictions of total lead have been made using the
acetic acid/acetate method by Nicklow, et al. (7S). Organically
complexed lead has been extracted by ethylene diamine tetra-acetic acid (EDTA) (6 1,7 3,9 9,1 0 0) or other chelating agents by
liquid/liquid extraction. The use of some of these reagents and techniques by various authors is discussed below and is summarised in Appendix l.a.
Acetic acid extracts.*.
Acetic acid is widely used as an extractant of available lead (e*>, as it is said to stimulate plant uptake and gives a guide to plant availability (101). The general procedure is to extract an air dried sample with 0.5M acetic acid (3 5,4 6,-1 7,9 8,1 0 2) for a given
evaporating to dryness over a steam bath, before uptake in a
suitable analytical medium. The H+ ions in the acid displace bound
ions from the exchange complexes in the soil, but as it acts below
normal pH ranges, must be considered to only give an estimate of
available lead (SA). tfeuhauser and Hartenstein C-n ) and Clayton
and Tiller (9,3> record the relative efficiency of this extraction
method for various soils. tficklow, et al. (76) describes its use
in Morgan Solution (100 g of sodium acetate, 50 ml water and 30 ml
glacial acetic acid at pH 4.8), modified with EDTA, to predict total soil lead.
Ac&tate extracts.
Although the amount of lead that can be extracted by neutral ammonium acetate is generally quite small (ei4) it has been used by several investigators P - 67'85'103' 10A*10S',06), particularly in early studies. Samples are usually shaken with 0.5M acetate solution overnight. The residue may then be leached for a further period prior to analysis. Petrov, et al. C92) describe tests involving preconcentration by liquid/liquid extraction, and claim to improve detection limits up to 1 0 times by this method, although contaminated samples can give erroneous results.
Liquid/liquid
extraction.Organic complexing agents, such as the clay-humus complex, are largely found at the surface layers of the soil, with the effect that lead is tightly bound by the processes of absorption and chelation. This is presumed to represent much of the pool of plant
-13-available nutrients in the soil (ei*e<4). Extraction of the metals as diethyl dithiocarbomates (DDC) chelates is becoming popular (107), and a variety of reagents are available for this purpose, usually referred to by their acronyms (Table 4.)
Table 4. Some reagents used in liquid/liquid extraction.
1 APDC Ammonium pyrrolidine dithiocarbamate I
1 ATDC Ammonium tetramethyl dithiocarbamate 1
1 NDDC N-diethyl dithiocarbamate 1
1 NaDDC Sodium diethyl dithiocarbamate 1
1 PBHA N-phynyl benzohydroxamic acid i
1 1-PBC 1-pyrrolidine dithiocarbamate 1
1 HKA Hexamethylene ammonium 1
1 HKDC Hexamethylene dithiocarbamate 1
1 DEDTC Sodium diethyl dithiocarbamate 1
1 Dithizone Diphenyl carbazone 1
Source: Various references.
Advantages of this type of extraction procedure include: increased
stability of METAL.DDCs in acid aqueous solutions; increased specificity of extraction (10vr); the elimination of undesirable matrix effects; improvement of atomic absorption detection sensitivities since the elements of interest are in an aqueous free solvent C111).
EDTA extraction,
Ethylene diamine tetra-acetic acid is very widely used as an extractant of plant available lead ( ® s * 9 e > 1o e * 11 =i), particularly for soils rich in organic matter (eA). The soil lead is extracted as EDTA chelates, but as the organic complex sites are largely in the surface layers, more EDTA extractable lead will be extracted here than from lower layers. Davies and Roberts (S1) have tested its utility in predicting lead contents of soil and vegetation, and Edmonds, et al. (113) present a detailed extraction procedure. Clayton and Tiller (.*'*') evaluated the efficiency of EDTA in relation to other extractants and concluded that EDTA can extract a definite component of soil metal corresponding to that capable of being absorbed by plants. Pribil C11*) supports its suitability as an extractant for plant available lead.
Other techniques,.
The use of dilute hydrochloric acid has been demonstrated by Gulson et al. C*3) and by Harrison and Laxen-Duncan (,ie). Meuhauser and Hartenstein C3'1) add a note of caution to the use of extractants to predict plant available lead, stating that the availability of€
-15-heavy metals depends on numerous and unpredictable factors, and
until such factors are resolved, a standard extraction procedure
should be used by all investigators to provide a basis for
comparisons of published data. They recommend 1) a minimum
extraction period and 2) a ratio volume of 0.1N HC1 to weight of
soil needed to achieve maximum extraction. Their views are
supported by a series of comparisons on the efficiency of reagents
described above.
1.3.2. Xot&l-l&atiL.
The determination of total lead in soil usually requires the use of
strong reagents in order to dissociate all the lead held within the
molecular structures of the soil. In unpolluted soils, where lead
is present as background levels, this is mainly within the silicate
lattices (7®>. Appendix l.a. summarises some of the many digestion
and extraction procedures used to determine the total lead in soil.
The general procedure fallows a pattern where the soil is digested
in an acid, or mixture of acid and then evaporated to dryness to
facilitate the oxidative destruction of organic matter present in
the sample. This is then followed by leaching of the residue and
filtration with a dilute acid to provide samples for analysis.
Alternatively the sample may be ashed in a crucible, using a
variety of temperatures and ashing aids. The latter techniques are
mainly used for the digestion of vegetation samples (for examples of their use in soils see 33,eo(62,io9,iie,iie1n 7 1n e ) i
Many comparative studies have been undertaken to test the
12°-121), and it is probable that not all the reported agents have
the same oxidising power. Harrison and Laxen-Duncan (11£1),
Karamanos, et al. (10°) and Veneman, et al. (12°) claim
efficiencies of between 93% and 98% for various concentrations of
HNCb, whilst Veneman, et al. (12°) have also achieved 98%
extraction with an HNCbtHClCLi acid mixture. Harrison and
Laxen-Duncan (1ie) tested several acid combinations and state that the
best results are achieved with an HF:HN(b mixture. Heinrichs C1*2 )
discusses the advantages of using HNCb:HCl, whereas Scott and
Thomas (117> compare a modified HF:HC1CU procedure with a
HNCb: H^SCU: HClCLt wet ashing technique and finds the latter to be
safer and quicker if used with small samples at low temperatures.
For samples with a high organic matter content (usually determined
by loss on ignition), the use of perchloric acid is recommended for
complete oxidation (79-n 7 .123)l although prior digestion with HNCb
is recommended (119), due to the risk of explosion. For samples
which contain strongly absorbing substances such as plasticisers,
Markunas, et al. (1:2A) described a modification of the HNCbiHClCb
digestion to prevent interference during analysis by atomic
absorption spectroscopy. Stoeppler, et al. (ias) favoured the use
of a pressure digestion unit, with up to twelve sample positions
for use with HNCb. In all instances, the use of ultrapure reagents
is stressed (6 2,1 2 3,1 2 6) ^0 aVoid unnecessary contamination, which
is an important factor discussed in a later section. Techniques
have been described by Garcia-Miragaya, et al.(AA), Miller and
McFee (7’°) and Harrison and Laxen-Duncan (79), which describe the
sequential extraction of the lead in various components of soil.
-17-In conclusion, most lead in heavily polluted soils can be extracted
with concentrated HNCb, or other HNCb:ACID mixtures, except where
the soil has a high degree of organic matter, when a
perchloric: nitric acid mixture may be used with caution. Safety
aspects can be an important element in the choice of reagent to be
used, for example HF will require far more care than HNCb with only
a comparatively small percentage gain in recovery efficiency.
Likewise lengthy procedures requiring complex mixtures and
digestion stages may be too costly in time and effort for little
benefit over a simple HNCb digestion procedure. This is
particularly the case when large numbers of routine samples must be
analysed (9£i).
1.3.3. Soil sample preparation,.
Whatever the analysis to be carried out on a soil, the sample must
undergo some preparation prior to its introduction to reagents to
be used in the preferred analytical technique. Sample collection
will be discussed in the next section, but as Severson, et al.
C127) point out, different techniques of preparing soil samples
have an effect on the values obtained from subsequent chemical
determinations. They suggest a standardisation procedure for
regulatory guidelines, allowing accurate and precise analysis by
single laboratories and between laboratories. Although aggregate
size is not considered by some to be of great importance, Veneman,
et al. (12°) and Severson, et al. (127) performed a series of
tests with DTPA (pH 7.3), using samples of varying mesh sizes, some
prepared with a mechanical mortar and pestles used by the U. S.
simulated the plant-soil relationship, but in general sieving to
mesh size 1 0, < 2 mm, was sufficient for most types of analysis,
Ure (1ia) suggests that for total lead analysis the sample should
be further ground to <150 pm by agate ball mill free from
contamination. Further milling using agate mortar and pestles,
tungsten carbide or stainless steel ball mills is also recommended
by other authors p , 7 3,uie)i
On collection, soil samples should be transported in polythene bags
(71), and then dried (ei). In a survey of 71 investigators
analysing soils, 24 stated that they air dried their soils, whereas
17 oven dried their samples to constant weight over a range of
temperatures between 30-110*C. However, Harrison and Laxen-Duncan
(lie) point Dut that oven drying tended to increase moisture
absorption, therefore air drying is recommended were possible. The
Agricultural Development and Advisory Service (ADAS) <12e>
recommends drying in a current of air not exceeding 30*C, 'until
the soil feels quite dry'. Bartlet and James C 29) have reported
that dried, pulverised, sieved soil samples are prepared and stored
for laboratory research, but this can lead to problems when the
samples are remoistened. The results of tests recommend that soil
should be kept moist and aerobic during storage, in order to
facilitate restoration to the metastable state on addition of
water, of particular importance in the analysis of plant available
lead. Stones, fibrous material and plant roots are removed from
the soil sample as far as possible (12G) prior to grinding.
Sample handling is discussed in detail by Hamilton (1GO).
-19-1.3.4. Soil sampling and surveying.
Any soil sample is only one of many which could be taken to
represent a chosen site. Sampling bias can lead to distortion of
the data, and the conclusions drawn may not be representative or
justifiable due to incomplete consideration of this and many other
environmental factors such as climate, weather and cultural
practices, all of which have a bearing on the results obtained
(e3). Therefore, the reasons for site selection should always be
expressed, and the methods of choosing the sampling sites stated
(119'123), using statistically based methods if at all possible so
that results obtained by apparently random sampling are not
overstated C33). From the literature surveyed in this report it is
apparent that many investigators fail to report their sampling
techniques in any detail, whilst others mention representative
sampling of some sort, but do not elaborate on their methodology.
(Appendix l.b. summarises some of the techniques used by various
authors to sample soils.)
Amongst the representative sampling techniques used, transects and
point samples within a reference grid proved to be popular and were
used efficiently. Soil depth is an important factor and many
investigators used soil pits and profiles, stating the depths at
which their samples were taken. Others used steel augers and
divided the profile up into samples for subsequent analysis. Once
collected samples must be stored in suitable containers, normally
plastic bags, which must be clean and capable of preventing cross
Rother, et al. C131) describe a method of soil sampling developed
at the Rothampstead Experimental Station, which aims to reduce variations caused by plants, using steel tubes to take 1 0 cores at 150 mm depth. Glenn C3A) tested the weight variability of volumetric soil test samples taken with the standard 4.25 cm3 Urbana Laboratories Soil Scoop, finding that errors arise due to differences in soil moisture content, degree of pulverisation and organic matter content; gravimetric analysis, although slower, is recommended. Andresen, et al. C13*) established a permanent network of forest sites which could be sampled regularly with time, and assist future studies of the forest soils.
The formation of baseline data in order that future changes may be monitored has been carried out by Wilkins (133) for pasture in Vest Pembrokeshire, Parry, et al. (3S) in Merseyside as a component of local planning policy, Davies and Roberts (G3) near Halkyn Mountain, Clywd, Davies and Paveley O 3*) in Vales and by the Joint Unit for Research on the Urban Environment (JURUE) in the London borough of Greenwich (13S) and Valsall (13e). The presentation of baseline data for regional geochemical studies of this nature is normally achieved by the use of computer mapping. This is discussed by Davies and Roberts C137) with special reference to the synographic mapping system SYMAP and SYMVU, which allows isoline or contour maps to be produced with irregular outlines generated on the basis of values observed. They are particularly useful in presenting the skewed data that is found in distributional studies of heavy metals (62-'16). Many further examples of the use of computer graphics in environmental studies of this nature are presented by Teicholz and Berry (13s).
-21-The quantity of soil required depends on the size of the sample
area under investigation and limitations of sample preparation in
the laboratory. ADAS (133) describes a series of routine methods,
using a ' V configuration, which are normally used to sample small
field size areas (normally less than 4 ha). Studies covering
regional areas p.62,)33,iss,i36) have used sampling frequencies
of only 1 or 2 soil samples per kilometer square area, which are
said to be representative of the sample area, using stratified or
random selections of sample locations. Authors have tended to
neglect the importance of sampling, particularly in regional
studies of this nature, and this is discussed in more detail in
Chapter 3.
1.4. Lead in the plant ecosystem.
The soil is made up of 84 of the known elements, although their
proportions vary enormously, with eight elements accounting for 98%
of the weight of silicate rocks (71). The availability of an
element in the soil is dependent upon its stability at the soil
formation stage, and other soil properties such as organic content
<®>. The soil is a major supplier of nutrients, as well as
contaminants, to the plants and animals supported by it (84), but
lead is neither a macro nor a micro nutrient to plants (e), with no
beneficial role in metabolism C71). Therefore its mechanism of
entry into plants is one of considerable interest and some of the
studies that have been performed in this area are discussed in
Studies of lead in the plant ecosystem tend to fall into three
categories. Firstly there are those concerned with the use of
plants to monitor levels of lead in the ecosystem from specific and
nonspecific pollution sources (,0'4,’U 0 ), Secondly, there are the
investigations into the uptake and entry of lead into plants via roots or leaf surfaces (4 6,6 2,7 6,9 0,1 0 4,1 4 1,1 4 2,1 4 3,1 4 4,1 4s,
146,147,140,149,160,151,162,163,164^ though most of these have
involved the use of greenhouse or pot experiments which may not
duplicate movements which occur in the field environment.
Generally the studies in this second category have concluded that
although the activities of the root soil interface are probably not
metabolically linked C71), lead is taken up from polluted soils at
this site (®*es>. Thirdly there are the investigations into
subsequent transport mechanisms within plants, which suggest that
this interface acts as a barrier to foliar uptake
Khan (eA) discusses the results obtained from various
investigations made into the relationship of lead in soils and
plants, and also discusses pathways of lead from plants.
The need to study vegetation is becoming increasingly important, in
the light of recent research in urban areas which has indicated
that the lead content of domestically grown vegetables may exceed
the current lead in food regulation level of 1 pg/g (71).
Potential hazards caused by their consumption resulted in a
decrease in the World Health Organisation C73) recommended daily
intake level of 5 pg/kg body weight. As Davies (73> says, there is
a dearth of information concerning the role of home grown
vegetables in the economy of the community, and as concern over the
garden vegetables will add to those already produced (3 7,7i1 7 3,7 4,7G,7G)i This is also the case in areas where the
background level of,lead is naturally high, or elevated by metallic
ore mining p - 167-'58),
1.4.1. Plant sampling and surveying.
A wide variety of plant samples has been used by authors,
Appendix I.e. lists some of the vegetation types used, but shallow
root vegetables and agricultural crops tend to predominate because
the major site of plant exposure to lead is at the root interface,
or top 0 - 20 cm of a soil profile (OA). Davies (61'73)
acknowledges the suitability of fast growing crops such as radish
for use in plant-soil studies, though their significance in terms
of lead in the diet is comparatively negligible. Other authors
favour grasses and leafy vegetables when monitoring foliar uptake
to gain maximum contamination of the upper parts of the plant (10).
The use of vegetation in monitoring surveys is reviewed by
Lepp (7), Martin and Coughtrey (-') and Manning and Feder (10) in
some detail. Surveys fall into the following categories, those
concerned with roadside studies, smelter and other point source
studies and those studies near general industrial sources such as in urban areas with diffuse or undefined pollution sources.
As with soil sampling the plant samples analysed must be
representative of the original specimen and be collected and
handled with care to avoid unnecessary contamination. Often
samples from several different plants are bulked together prior to