Using Viewing Time to Infer User Preference in Recommender Systems
Jeffrey Parsons, Paul Ralph, Katherine Gallagher
Faculty of Business Administration Memorial University of Newfoundland
St. John’s, NL, Canada
[email protected], [email protected], [email protected]
Abstract
The need for effective technologies to help Web users locate items (information or products) is increasing as the amount of information on the Web grows. Collaborative filtering is one of the most successful techniques for making recommendations; however, most CF-based systems require explicit user ratings and a large quantity of usage history to function effectively. In addition, such systems typically rely on comparing a user to ‘similar’ users encountered before. We develop and evaluate the idea that viewing time is an indicator of preference for attributes of items, and a recommendation system based on this idea. The system uses only the current user’s navigational data in conjunction with item property data to make recommendations. We also present empirical evidence that the system makes useful recommendations.
Introduction
Whether looking for information or shopping online, the size and diversity of the Web makes it increasingly difficult to find what one is looking for. In general, it is simply not possible to examine all available alternatives. For instance, on a typical day approximately 15 million individual products are listed on eBay. Searching a catalog of this size can be frustrating and unproductive. This problem is exacerbated when the user cannot articulate specific properties of the item (s)he is seeking, or if the user does not know exactly what (s)he is seeking – the ‘I’ll know it when I see it’ feeling. Moreover, many consumers enjoy discovering the right item serendipitously, a concept difficult to incorporate into the classical notion of information search.
In this context, automated mechanisms have tremendous potential to help users locate desired information and/or products. Recent research has shown that online users have limited patience for locating material in a large information space that does not provide effective guidance (Palmer 2002). Thus, applying tools that improve the product/consumer match (decision quality) without increasing search time (cognitive effort), or decrease search time without worsening the product/consumer match, may improve customer satisfaction.
This paper presents the motivation, design, and preliminary evaluation of a recommender system that
infers user preferences from product viewing times. We begin by reviewing prior research on technologies to assist users in locating relevant items, focusing on recommender systems. Next, we review psychological evidence on the relationship between viewing time and preference, and present the results of a study conducted to determine whether this relationship can be isolated in an online shopping context. We then present our approach to recommendation, and provide some evidence of its effectiveness. The paper concludes by suggesting directions for future studies.
Guidance in Large Information Spaces
Major Methods
Three methods are commonly employed to assist online users in locating relevant items: search engines, taxonomies and, more recently, recommender systems.
Search engines index documents based on included words, and are widely used for general Web searches. They allow users who can effectively articulate what they are seeking to find it very quickly. However, search engines fail to overcome the semantic gap – they retrieve documents based on low-level features (existence of keywords), while people evaluate and use documents based on high-level concepts (such as topics or writing style). Furthermore, some research suggests that the algorithms employed by search engines are not always accurate (Hawking 1999). Perhaps more important from a theoretical standpoint, search engines require that the user articulate something about the target object, which requires that the user have a target object. Therefore their usefulness is limited to users who have a vague picture of what they seeking.
Taxonomies are fixed groupings of items based on a predetermined set of categories, and are commonly used to support browsing of online catalogs. Toms (2000) found that people most prefer to navigate using menus and least prefer to navigate using search tools, largely because of the typing involved. However, taxonomies are appropriate and useful only to the extent that the chosen categories correspond to the classification structures of those using the space (Parsons & Wand 1997), and it is well known that category structures vary among people and over time (Lakoff 1987). Attempts to overcome this difficulty are in progress (see Joh 2002 for an example).
items that may be of interest to a user. According to Toms (2000), users preferred suggestions to search tools (but preferred taxonomies to suggestions). Suggestions provide a means to personalize presentation of information, an approach taken by many online stores (Pine and Gilmore 1999). Recommender systems can overcome some of the difficulties experienced by search engines and taxonomies. They have the potential to overcome the semantic gap by inferring the concepts relevant to a user and locating relevant items in a search space organized according to concepts extracted from documents (see Deerwester et al. 1990). Moreover, they need not rely on classification; recommenders can ignore predefined categories, focusing instead on relevant properties. Shafer et al. (2001) claim that recommenders can also enhance e-tailing by converting browsers into buyers, increasing cross-sells and building loyalty. Finally, recommender systems may prove useful for selecting the most relevant content especially when display screens are small, for example, when delivering news to a personal data assistant (Billsus et al. 2002).
Recommendation Strategies and Systems
A recommendation strategy is a systematic action plan for suggesting suitable items to users. The implementation of a recommendation strategy is called a recommender system. Recommenders have been applied to many different items including movies, music, restaurants, news stories, journal articles, cars and digital cameras. In this paper, we consider only automated, personalized recommender systems, that is, recommenders that do not require constant interaction with administrators and whose recommendations are affected by knowledge of the recipient (user). Many different recommenders have been developed based on a variety of strategies including: user-to-user correlation, item-to-item correlation, item-user-to-user correlation, natural language parsing, and agent technology (see Schafer et al., 2000 for a detailed summary).
User-to-User. Making recommendations based on user-to-user similarities is called collaborative filtering (CF), a term coined by Goldberg et al. (1992) in relation to a system that included a function in which users rated email documents and created queries based on other users’ ratings. This system was extended by Resnick et al. (1994) in the GroupLens project, which applied CF to Usenet newsgroups. Like all CF systems, GroupLens assumes that similar users have similar goals. Based on this assumption, the system recommends the goals of one or more previous users to the current user. The known goals of previous users are domain-dependent, but often operationalized on an information-oriented site as the last visited page, or on an e-commerce site as products purchased. CF can be applied to many different domains (Kohrs & Merialdo 2001). Recommenders use a variety of user-to-user similarity measures, but most build a two-dimensional ratings matrix with item on one dimension and user on the other. Some use Pearson correlation (Resnick et al. 1994).
Others use functions of the angle between rating vectors, especially cosine (Mobasher et al. 2000), and adjusted cosine (Jin & Mobasher 2003). Shahabi et al. proposed a function called Projected Pure Euclidian Distance (2001b). Collaborative filtering systems have been successful in controlled environments (see Mobasher et al. 2001, Shahabi et al. 2003, and Shahabi et al., 2001a), and in real-life environments for Amazon.com, CDNOW and IMDb (see Shafer et al. 2000 for more examples).
However, CF suffers from several limitations including: sparsity, the cold start problem, the first rater problem, scalability and explicit ratings. Most users will rate only a small portion of a large item set, making the ratings matrix very sparse. Nearest neighbor algorithms (Herlocker et al. 1999) require a coincidence of ratings to produce user matches. That is, for two users to have a similarity, they must have both rated some set of products. This causes degradation in accuracy and coverage (Konstan et al. 1997 and Sarwar et al. 1998). Without sufficient ratings, the CF algorithm cannot find highly correlated users in many instances. Several attempts have been made to mitigate this problem, including ones involving clustering (Mobasher et al. 2002) and rating agents (Sarwar et al. 1998).
When a CF-based recommender is first used, a cold-start period begins in which the ratings matrix is empty (recommendation is impossible) or extremely sparse (recommendation quality is extremely low). Similarly, the first rater problem occurs when a new item is added – because no one has rated it, it cannot be recommended. Proposed solutions to these problems involve item-to-user similarity, and are discussed below. The computational complexity of nearest neighbor algorithms increases with the number of products and the number of customers, limiting the scalability of such systems. Most CF implementations force users to engage in the obtrusive and time-consuming task of rating things (Perkowitz and Etzioni 2000), which may deter potential users. In many contexts, people cannot or will not explicitly state preferences for a sufficient number of items, and even when rating sparsity is not a problem, explicitly expressed preferences may suffer from self-reporting bias. One solution to this problem involves using clickstream data (i.e., navigation patterns) instead of ratings (Mobasher et al. 2002).
LSI works by constructing vectors that represent documents, and using measures of distances between vectors to indicate the similarity of the corresponding documents. First, each document in a corpus is reduced to a vector of keyword frequencies. After using singular value decomposition to reduce dimensionality, the dissimilarity between any two documents can be measured by a function of the angle between their vectors (Deerwester et al. (1990) used the cosine of the angle) or a function of the distance between their corresponding points in the solution space. In a document-search context, the pseudo-document vector might be created by taking a weighted average of the vectors of all documents rated so far, with the weights calculated from the ratings. Because LSI extracts conceptual information, it resolves the problems caused by the many-to-many relationship between concepts and keywords, specifically synonymy (words having a shared meaning) and polysemy (words having multiple meanings). However, LSI is intended for unstructured data, such as natural language descriptions, and does not effectively use structured data, such as that often associated with online purchasing: price, size, etc. LSI has also been successfully tested with multimedia, (see Zhao and Grosky 2002a, 2002b and 2002c).
FindMe systems guide searchers through the search process by using examples. Users discard a series of unsatisfactory items by indicating which aspect of the item is most disappointing through a set of conversational buttons until an acceptable item is found. If, for example, the user indicates, “Too Expensive,” the next example will be similar to the previous, but with a lower value in the cost dimension, if such an example exists. Although FindMe systems can be effective in many situations, they are inherently conspicuous; like a search tool they must be consciously selected and endured, and are therefore not appropriate where transparency is desired. (See Burke (1999) and Burke (2000) for more details.)
Item-to-User. Item-to-user systems are necessarily more sophisticated than item-to-item and user-to-user systems because they must compare unlike objects. Some apply standard tools of information search, such as simple filters. More sophisticated approaches have also been developed. Raskutti et al. (1997) introduced a recommender based on Bayesian networks, and Cho et al. (2002) applied decision tree induction to the recommender problem (2002). Web Usage Mining, the process of applying data mining techniques to weblogs, can provide association rules that can form the basis for recommendations (Shahabi et al. 1997 and Spiliopoulou & Faulstich 1999).
Artificial Intelligence (AI) techniques have also been used to predict purchasing behavior with some success (Kim et al. 2003). Since the recommendation problem can be cast as either a classification or a prediction problem, AI may form the basis of many future recommender systems (see (Prasad 2003) for a summary of AI use in ecommerce).
Zhang and Ivengar (2002) used classifiers as the core of their recommender system. Additionally, when item-to-item techniques are combined with user-to-user techniques, as in Mobasher et al. (2000) and Jin & Mobasher (2003) the result can be considered an item-to-user system.
Each of these systems has benefits and drawbacks. Filters are clear and simple, but do not take advantage of fuzzy membership. Model-based approaches such as Bayesian networks, decision tree induction, classifiers, and association rules, are normally fast once the model is trained, but incur more upfront calculation and require a priori knowledge that may or may not be available. Web usage mining for association rules can provide useful information for cross selling, but suffers from the banana problem (Burke 1999). That is, if most customers buy bananas, naïve recommenders will always recommend them because bananas are associated with everything. AI techniques can provide good results, but the resultant models can be too complex to understand, and the time complexity of AI is not well understood (Tettamanzi & Tomassini 2001).
A classifier-based approach might perform better than CF in some instances (Zhang & Ivengar 2002), but is often conceptually very complicated. Combining item-to-item approaches with CF may patch the sparsity problem, but these hybrid approaches still suffer from the other limitations of CF.
Natural Language. Some recommenders have been based on natural language parsing in which the user converses with the system. These systems represent an evolution of natural language search engines, which simply parse a phrase or sentence into a Boolean search query (for example, Poo et al. 2000). More sophisticated systems refine the search terms and/or filters by asking the user a series of questions in a discussion-like format (Chai et al. 2002). This could prove helpful to many users in an e-tailing situation; however, it suffers from the same conspicuousness as FindMe systems.
Viewing Time as an Indicator of Preference
In general, one would expect people to look at objects they like, or find interesting, for a longer time than objects they do not like, or do not find interesting. In an information-seeking context, this translates into an expectation that users will view relevant information for a longer time (and read more of it) than irrelevant information. In a shopping context, users should spend more time looking at items they like for a longer time than items they do not like. Thus, viewing times may provide a means of identifying consumer preferences, or propensity to consume a product or service.There is some indirect evidence in the psychology literature of a relationship between viewing time and preference. Past studies have not looked directly at preference, but at constructs that can be argued to be correlates of preference. In the context of geometric shapes and pictures of animals, Berlyne and Lawrence (1964) found “no clear positive correlation between [subjects’] statements of how much they like a particular figure and how much time they will choose to spend looking at the figure,” (p. 41). However, Faw & Nunnally (1967) found that “pleasant ratings” were shown to be positively correlated with viewing time and Day (1966) reported that 27 out of 30 participants looked longer at images rated “liked.” Oostendorp and Berlyne (1978) found that “looking time increased with the hedonic tone/arousal factor scores,” meaning that objects evoking pleasurable emotions were viewed for longer periods.
More recently, and in an online context, Konstan et al. (1997) found a positive relationship between reading time of Usenet news and explicit ratings. Morita and Shinoda (1994) concluded that time spent reading Usenet news was positively related with interest In addition, Mobasher et al. (2001) attempted to use viewing time to indicate the significance of page views with some success. Based on this indirect evidence, we posit a general positive relationship between viewing time of an item or item description and preference for (propensity to consume) that item. To examine this proposition directly, we conducted a small laboratory experiment, as described next.
Experimental Task, Material, and Procedure
Participants were asked to participate in a study of online shopping behavior. To ensure that chosen items reflected genuine preferences and to promote voluntary participation, participants were told that there would be a random draw of three names at the end of the study and the items selected for purchase by these three participants would be purchased for them.1 In this way, the choices
1 In fact, at the end of the experiment the three participants
selected were awarded an amount of money equal to the price of the item they selected. Participants did not know this until the study was completed.
constitute ‘revealed’ preferences, and are not subject to the biases that can occur in hypothetical choice tasks.
Participants viewed a small Web-based catalog constructed for this study. The catalog contained 26 similarly priced women’s sweaters, each on a separate page. Catalog items were obtained from the online catalog of a major retailer that has both online and brick-and-mortar stores. In order to minimize potential confounding effects on the viewing time / preference relationship, we selected items to ensure that the information associated with each sweater page was similar in length and style.
Participants viewed each page in the catalog in a fixed sequence. Each page had a button allowing the participant to move to the next item in the catalog. In order to simplify data collection and to avoid confounds created if participants went elsewhere on the Web, the ‘back’ button and other navigation options in the browser were disabled. The Web pages containing the items also had a button allowing a participant to add the item to a shopping basket for later review. After viewing the last item, participants were taken to the shopping basket page where they were asked to select the one item they would most like to purchase.
Weblog files were used to collect the data in this study. We extracted from the log files the following key data for each participant: time spent on each item, items added to the shopping basket, and item ultimately chosen for purchase.
Participants
Participants in this study were 34 female undergraduate students taking business courses at our university. This group was relatively homogeneous on several demographic variables (e.g., age and education), indicating that any differences in viewing time could not be attributed to demographic factors.
Results
First, since all participants viewed the catalog items in the same order, it is possible that any relationship between viewing time and choice is resulted from an underlying order effect: we expect participants to spend more time on items earlier in the catalog than items later in the catalog. While there was a negative correlation between position and viewing time (-.800, p<.001), there was no significant relationship between position and frequency of choice of an item by participants. Therefore, any relationship between viewing time and choice cannot be explained by position in the catalog.
was significantly greater than 0 (t33 = 3.540, p < .001).
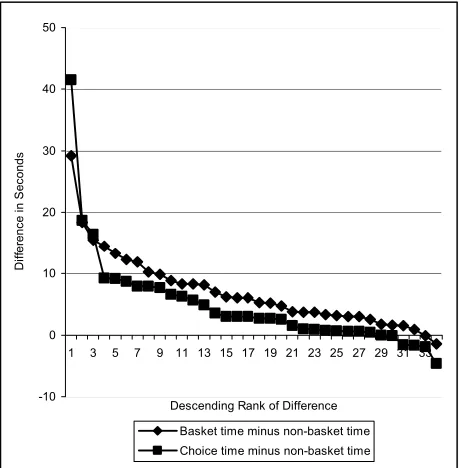
Since the mean viewing time spent on choice items was just under 12 seconds (s.d. 7.8s) and the mean time on non-basket items was just over 7 seconds (s.d. 2.7s), this difference is substantial.
Similarly, we expect items placed in the shopping basket to be preferred to items not included in the basket (since participants knew that the ultimate choice had to be made from items in the basket); thus, we expect a positive difference in mean viewing times between these sets. In this test, the mean difference in time spent on basket items vs. non-basket items was significant at 7.1 seconds (t33=6.709, p<.001). The mean basket size was 7.4 items
(standard deviation = 3). Since the mean viewing time spent on basket items was just over 14 seconds (s.d. 7.8s) and the mean time on non-basket items was just over 7 seconds (s.d. 6.5s), this difference is also substantial.
-10 0 10 20 30 40 50
1 3 5 7 9 11 13 15 17 19 21 23 25 27 29 31 33
Descending Rank of Difference
Di
ffe
re
n
ce
in
S
e
co
n
d
s
[image:5.612.58.289.261.495.2]Basket time minus non-basket time Choice time minus non-basket time
Figure 1: Viewing Time Differences
Figure 1 shows the difference between time spent on choice items and the mean time spent on non-basket items, as well as the difference between the mean time spent on basket items and the mean time spent on non-basket items. It plots differences instead of means (the vertical axis), and ranks differences by descending size. Of the 34 participants, 28 spent more time on choice items than on non-basket items and 32 spent more time on basket items than non-basket items. In addition, we tested whether the time spent on the choice item differed significantly from the mean time spent on other items in the shopping basket. In this test, the mean difference in time spent on choice versus basket items was –2.11 seconds, t33=-1.423; this
difference is not statistically significant.
Implications
This study shows a positive relationship between time spent viewing an item in an online catalog and revealed preference for that item as indicated by inclusion in a shopping basket (for further consideration) and ultimate selection of an item for purchase.
Clearly, other factors could affect viewing time, particularly in an uncontrolled setting (e.g., amount of visual detail, amount of text, distractions on images, other distractions from a browsing/purchase task). Nevertheless, this study indicates that time is potentially a useful indicator of preference for an item. In the next section, we present DESIRE, a content-based recommender system that uses viewing times to infer preferences.
DESIRE Recommender System
DESIRE (Desirability Estimator and Structured Information Recommendation Engine) is an item-to-user recommender system that combines a viewing time- and attribute-based preference inference algorithm with an attribute-based recommendation engine. The current implementation of DESIRE is illustrated in Figure 2. The algorithm is described in more detail in the Appendix. Here we provide an overview.
Formally, a recommendation engine solves the following problem: given an item set and a user, return a list of items (the recommendation set) sorted by the user’s propensity to buy, read or otherwise consume them. In addition, DESIRE satisfies two additional conditions: transparency and user independence. A recommender system is said to be transparent if the recommendation set can be generated without the user being aware of, or interacting with, the recommendation system. In contrast, any system that requires users to rate items explicitly is not transparent. A recommender system is said to be user independent if recommendations to user A are not contingent upon knowledge of any user other than A.
Item Preference
Matrix
Item Ranking
Item/ Attribute
Matrix
3 - Weight Values 2 - Calculate Ideal Quantities
Customer Profile
4 - Estimate Desirability Item Similarity
Matrix 5 - Sort by
Similarity User
Interface Navigation
Log
[image:6.612.60.285.52.276.2]1 - Calculate ratings
Figure 2: Implementation of DESIRE
The recommendation engine component of DESIRE decomposes each item into a collection of properties. For each numeric property, this user’s projected ideal quantity is calculated (process 2). For each value of each textual property, a preference weight is calculated (process 3). Then, for each item in the item set, the desirability is calculated by comparing the item’s property values to these ideal quantities and value weights (process 4). Finally, the item set is sorted by desirability (process 5) and a recommendation set is returned. DESIRE can return a standard top-n recommendation set or all items with desirabilities exceeding some threshold (a ‘better-than-t’ recommendation set).
DESIRE uses two different desirability measures corresponding to two kinds of properties. First, we group all nominal and ordinal properties together into a category ‘textual properties’ and all interval and ratio properties into a category ‘numeric properties.’ The desirability of textual properties, such as brand, is calculated based on the desirability of each value. The desirability of numeric properties, such as price, is calculated in two steps. First, the ideal quantity for the value is calculated based on a weighted average (see Appendix). Second, the desirability of a given value is calculated as the normalized difference between the z-score of the target value and the ideal value. DESIRE does not treat all properties equally. The desirability of an item, i, is calculated as a weighted average of i’s property desirabilities, where the weights correspond to the relative importance attributed to each property. The relative importance of attributes could be determined by asking users to rank or rate the importance of each attribute for their decision-making, or calculated from industry-based surveys of the importance of various attributes to consumers of specific products. Weights may vary based on the type of users (i.e., corporate vs. private),
type of item (i.e., clothing vs. electronics) the domain (i.e., information search vs. e-commerce), or other factors.
The DESIRE algorithm is linear in the number of items, so it should scale well. Simple content filters (e.g., excluding unrelated product categories) could be used to reduce extremely large item sets. This is one advantage of DESIRE over nearest neighbor collaborative filtering, which depends on both the number of items and the number of users.
Although many factors may moderate the relationship between viewing time and preference, the effects are unknown. The current implementation of DESIRE therefore estimates preference only as a function of time (see “Limitations” section below for more details).
Empirical Test of DESIRE
To explore the quality of recommendations produced by DESIRE, implemented as described above, we conducted a laboratory experiment. We hypothesize that recommendations based on rankings calculated using DESIRE are better than randomly generated recommendations.
Experimental Task and Procedure
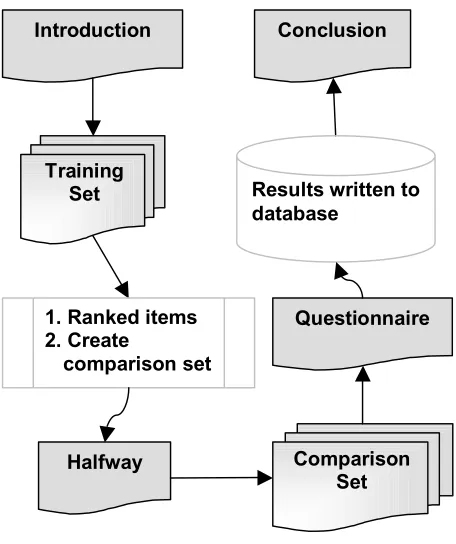
The activities and sequencing of the experimental task are depicted in Figure 3.
Figure 3: Task Sequence
To begin, an introduction page gave participants instructions and a description of the study. Next a training set of 12 pages was displayed. Viewing times associated
Comparison Set Training
Set
Questionnaire Conclusion
Halfway Introduction
1. Ranked items 2. Create
comparison set
[image:6.612.322.550.361.633.2]with these pages were used to infer preferences for the attributes/values of items in the training set. Each page contained a description of a catalog item and two buttons. All participants saw the same 12 pages (same item descriptions), but in random order. Additional information about an item could be view by pressing a MORE DETAILS button on the page for that item. After viewing all pages in the training set, all of the products were ranked and a comparison set was generated for use in the subsequent phase. This ranking was not updated based on the participants’ choices in the comparison phase. The halfway page, which gave instructions for the following section, was then displayed. When the user clicked NEXT, the first comparison set page was loaded.
The purpose of the comparison task was to display side-by-side items that were ranked high and low by DESIRE, and measure how frequently participants chose the higher ranked of the two items on each comparison page. If DESIRE produces good rankings based on preference, participants should pick the higher ranked item most of the time. Thus, this approach provides a relatively simple way of determining how well DESIRE works.
The comparison set consisted of 10 pages, each displaying a high-ranked item beside a low-ranked one, with a MORE DETAILS button for each item that worked as before. To prevent biases that might arise from position effects, the position of the high- vs. low-ranked item (left or right) was randomly chosen for each page. Under each description was an I PREFER THIS ONE button, which the user clicked to indicate which item (s)he preferred. At the bottom of the page was a checkbox labeled I CAN’T DECIDE. Participants were instructed to check this box if they were indifferent to the two choices. However, after checking the box, participants still had to select one of the two books to continue.
After viewing all the comparison pages, participants were routed to the questionnaire page. Clicking the SUBMIT button on the questionnaire page sent all of the information collected for each participant during the experiment to a database on the Web server. Participants were then routed to the conclusion page, which thanked them for their support and informed them of the effectiveness of the recommendation engine in predicting their preferences.
Experimental Items
The items used in this experiment were all printed works of fiction. Books were chosen for several reasons:
• they can be objectively described on many dimensions including title, author, ISBN, genre and number of pages;
• information about popular books, including the publishers’ advertisements, critical reviews, and synopses, is readily available online in a form conducive to the formation of a sample item database;
• it seemed unlikely that many of participants would have read (and thus already formed opinions about) a high percentage of the books in the database.
Recall that users could request more details about each book. Of the 2101 books in the database, 1621 had some form of extra information in the more details section. The largest more details section had 2000 words; the median was 189.
Each book was characterized by 11 properties: title, author, genre, subgenre, publisher, cover (hard or soft), ISBN, price, length, year of publication and average customer rating. Price, cover and average customer rating were randomly generated for each book using a uniform distribution. Title and ISBN were not used by the algorithm because our textual property similarity measure has no effect on properties unique to an item.
Most of the information was gathered from various public libraries’ online catalogs. Four genres (groupings of sub-genres) were derived, with the assistance of some experts in English literature, from the results of a pretest in which several people were asked to group the sub-genres into an unlimited number of groups. The prices were automatically generated in a uniform distribution ranging from $5.99 to $24.99 for soft cover books and $25.99 to $44.99 for hard cover books, at $1 intervals. The customer ratings were also automatically generated in a uniform distribution from 0 to 5 stars.
Participants
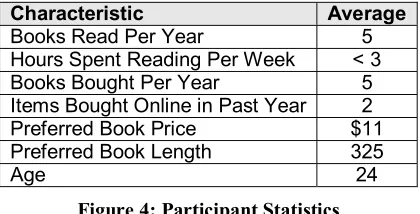
Sixty-seven university students participated in the eight sessions. Four of the records were unusable due to technical problems; our analysis is based on the 63 remaining records. Figure 6 provides a summary of the 32 male and 31 female participants.
Characteristic Average
Books Read Per Year 5
Hours Spent Reading Per Week < 3 Books Bought Per Year 5 Items Bought Online in Past Year 2 Preferred Book Price $11 Preferred Book Length 325
[image:7.612.335.545.409.516.2]Age 24
Figure 4: Participant Statistics
Results and Discussion
To test our hypothesis, we computed the percentage of time that participants chose the comparison item that was ranked higher by DESIRE. If item rankings were random, we would expect DESIRE to predict 50% of the participant choices correctly. However, the higher-ranked item was chosen by participants 60% of the time. This difference is statistically significant (t62=5.841, p < .001). Age and
than length). This result indicates that preference for an item is related to preference for properties of that item since DESIRE calculates the desirability of an item as a weighted sum of the desirabilities of its properties.
Several other interesting results were also found. The mean viewing time for comparison set pages on which the user indicated indifference was 37 seconds. This is significantly higher than the mean viewing time for all comparison set pages of 25 seconds (t38=3.873, p=.003). This supports the expectation that indifference indicates a more difficult, hence more time consuming, choice. However, it is also reasonable to assume that, if people are truly indifferent, they will pick a book at random2. In that
case, the users’ choices should agree with the system’s predictions 50% of the time. However, the mean accuracy of the system in cases where the user indicated indifference was about 72%, which is significantly higher than the expected value of 50% (t38=3.590).
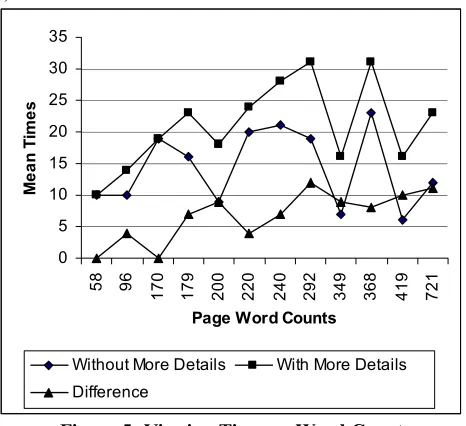
We also looked at the relationship between the time spent on a training set page, whether more details were requested, and the amount of detail available (see Figure 5).
0 5 10 15 20 25 30 35
58 96 170 179 200 220 240 292 349 368 419 721
Page Word Counts
Me
a
n
T
im
e
s
Without More Details With More Details
[image:8.612.57.290.295.508.2]Difference
Figure 5: Viewing Time vs. Word Count As expected, participants spent more time on pages when they requested more details. However, there was no significant correlation between viewing time on pages (when more details were requested) and word count. Nevertheless, there was a significant correlation between the difference in viewing time between pages where more details were, and were not, requested, and the word count of the page (r2=.704, p=.011).
Another interesting relationship concerns the time spent on comparison pages. A significant negative correlation was found between the comparison number (order) and the average amount of time spent on the page
2 Recall that users were forced to choose a product even if
they indicated indifference.
(-.710, p = .022 where the system was correct, -.711, p=.021 otherwise). In other words, participants spent more time on the items appearing earlier in the comparison exercise than at the end. No relationship was found between prediction success and the time spent on the pages.
A relationship may exist among requests for more details, viewing time and page length. Participants should spend proportionally more time on longer pages because it takes longer to read the (interesting) material, or possibly to decide whether the material is worth reading. Thus, we expect to find a positive correlation between viewing time and page length, in those cases where more details were requested. However, these variables were not significantly correlated.
In a real eCommerce setting we measure the time between page-loads (not actual viewing time), which may reduce prediction accuracy. However, it is possible to measure display time, which may provide a closer approximation of viewing time. Moreover, we do not expect the problem of anomalous viewing times caused by distractions to be large. Outlier analysis may be useful in identifying and accounting for such anomalies, allowing our system to function within the confines of the current internet architecture.
Limitations
The effectiveness of the system was constrained by several important issues. First, the item set data were incomplete. The recommender system worked on only eight attributes. A real online bookstore would have at least 20 attributes for each book. A second problem arises from the relative weights of the attributes – they were estimated from a survey and then modified based on participants’ comments in the pre-test. In future studies, these weights will be systematically estimated by a recommendation simulation on data mined from weblogs. Third, our conclusions are limited by the relatively small number and homogenous nature of participants. Since all of the participants were students, the results may not generalize to other groups. Fourth, many factors that might affect the strength of the relationship between viewing time and preference may be mild. For example, in the context of information about books, the relationship between viewing time and preference may be somewhat stronger for those who read a lot than for those who do not. With a small number of participants, it is not possible to tease out such effects.
Category Description Examples Stimulus characteristics of
the object being viewed
complexity, familiarity, novelty
Situational characteristics of the subject’s environment
Sequence position, instructions, motivation
Personality characteristics of
the subject age, cognitive structures, patience Interaction interactions
between personality and stimulus variables
[image:9.612.47.299.53.221.2]correlation of a personality trait and material, i.e., argumentative people and argumentative writing
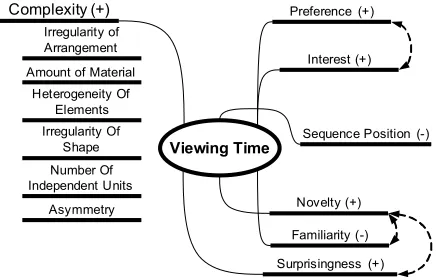
Figure 6: Categories of Viewing Time Determinants Prior research has shown that viewing time is positively correlated with complexity (including irregularity of shape and arrangement, amount of material and heterogeneity of elements), negatively correlated with familiarity, and positively correlated with novelty (see Heinrich, 1970, Berlyne, 1964, and Oostendorp & Berlyne 1978). The viewing time within a sequence of stimuli tends to decrease from beginning to end (Heinrich, 1970). In the e-commerce context, Wedel & Pieters (2000) found that people spend significantly more time looking at brand-related images than other images and text. This could have unexpected effects when comparing viewing times of heterogeneous pages. In addition, the positive relationship between interest and viewing time (Oostendorp & Berlyne 1978), which may be immediately applicable to news or other textual domains, is not equivalent to a relationship between preference and viewing time. A person may like something without being interested in it (i.e., apples), or be interested in something (s)he does not like (i.e., a political scandal). The factors influencing viewing time are summarized in Figure 7. The plus (minus) signs indicate a positive (negative) relationship and the arrows indicate potential interdependencies.
Viewing Time
Preference (+)
Familiarity (-) Novelty (+)
Sequence Position (-) Interest (+)
Surprisingness (+)
Complexity (+)
Irregularity of Arrangement Amount of Material
Heterogeneity Of Elements Irregularity Of
Shape Number Of Independent Units
Asymmetry
Figure 7: Factors Influencing Viewing Times
Conclusions and Future Research
The evidence presented above shows that time can be a useful indicator of preference, that preference for an item can be expressed as a function of preference for values of its attributes, and that these attribute preferences can be transferred across items. However, more work is needed to refine DESIRE’s recommendation quality.The factors that confound the preference/viewing time relationship are not well understood. We are currently attempting to quantify these factors in an experiment using a regression model and plan to incorporate them, along with appropriate parameter values, in a subsequent version of DESIRE.
The preference prediction and recommendation algorithms can also be tested in various combinations to determine which are most suitable for various situations. For example, the preference prediction algorithm could be tested with a CF-based recommendation engine and perhaps the recommendation engine in DESIRE might perform well given explicit ratings.
Appendix: DESIRE Algorithm
Notation
In the following, A denotes the set of all attributes of interest.
α
⊆
A
denotes the subset of attributes having text or category values, andβ
⊆
A
denotes the subset of attributes having numeric values.Note:
α
∩
β
≡
φ
∧
α
∪
β
≡
A
.V denote the set of possible values corresponding to the attributes in alpha. The set of values corresponding to the attributes in beta is a subset of real numbers.
P denotes the set of all items.
Rating Estimator
Input:
• a set of products, TS (for Training Set), of length T, and
• the user’s viewing time for each product. Output:
• preference set, TP (same length and order as TS) Steps:
1. Assume a normal distribution. Calculate the z-scores for each product in TS: z1, z2, …
2. Account for outliers
2.1. For each z-score with absolute value greater than 3, reduce it to 3 (-3 if original was negative)
3. Calculate the preference for each item, p, in TS as TPi =
3
i
z
[image:9.612.63.281.513.653.2]Stage 1 Input:
• Item-Attribute Matrix, IA (N items by M attributes)
• Positive Example threshold Output:
• None Steps:
1. For each numeric attribute in IA, calculate its z-score assuming a normal distribution.
Stage 2 Input
• Item-Preference Matrix (T items by 2 attributes, the item ID and the preference)
Output
• Top-n recommendations set or Better-than-n recommendation set for customer c, ȍc
• Desirability of each recommendation in ȍc
Steps:
1. Describe the customer’s preferences in terms of preferences for item characteristics.
1.1. Recall: V is the set of all the values that the textual attributes can hold. Construct the customer object, containing a set, Tv (for Target Values), as follows:
1.1.1. For every element in V, construct a corresponding element in Tv. This element is the
average weight for all the products in the training set that contained the value in question, or 0 if none of the training set items contained it.
1.2. Recall,
β
is the set of all numeric attributes. The customer object contains an ideal quantity for each numeric attribute.1.2.1. The ideal quantity is a weighted mean of the attribute’s value in all of the positive examples. We define a positive example as one whose weight is greater than some threshold between -1 and 1.
1.2.2. Construct the set of the current customer’s ideal quantities, Tm (for Target Means).
1.2.3. Each element in
β
has a correspondingelement in Tm defined as:
¦
¦
w
wq
, for each
positive example. In English, the element in Tm
corresponding to an attribute, a, is given by: the sum of the weight (w) of the each positive example times the quantity (q)assigned to a in
that example, divided by the sum of the weights of all the positive examples.
Repeat Steps 2, 3 and 4 for each item, p İ I
2. Find a representation of the similarity between the target and p in terms of textual attributes. This representation will be a set of individual similarity indices.
2.1. Recall that the customer object contains a weighting (from -1 to 1 inclusive) for each textual value.
2.2. For each value in p:
2.2.1. Calculate the similarity between the customer’s target item and p, in terms of the current element, as the weighting given to the current value in the Target (in Tv). If the value is not in
Tv, leave it out.
2.2.2. Normalize this weighting by adding 1 and dividing by 2.
2.3. Construct the set of all these individual similarity indices by Sv, (for Similarity of Values)
3. Find a representation of the similarity between the target and p in terms of numeric attributes. This representation will be a set of individual similarity indices.
3.1. For each numeric element:
3.1.1. Find z-scores for the “ideal quantity” in the target.
3.1.2. The absolute value of the difference between the z-score of the ideal quantity and the z-score of the actual quantity in a item is the dissimilarity, which has a maximum value of 6. To get the similarity between the item and the target divide the dissimilarity by six and subtract the answer from 1.
3.2. Construct the set of all these individual similarity indices, Sm, (for Similarity of Means).
4. Combine Sv and Sm, creating a single index that
represents the similarity between the item and the target. 4.1. Since some attributes are more important to the buying decision than others, the similarity is a weighted mean. R denotes the set of Relative attribute weightings.
4.1.1. Divide R into two subsets, Rv and Rm, which
correspond to Sv and Sm respectively.
¦
¦
¦
+
R
R
S
R
S
v v m mThat is, multiply each individual similarity index by its relative weighting, and then divide the sum of these products by the sum of the relative weightings. This gives a cumulative similarity index.
5. We now have a cumulative similarity index for each item. Let
Ω
denote the top-n recommendations, or all of the recommendations with desirability greater than some threshold. ReturnΩ
.References
Ackerman, M., Billsus, D., Graffney, S., Hettich, S., Khoo, G., Dong J., Klefstad, R., Lowe, C., Ludeman, A., Muramatsu, J., Omori, K., Pazzani, M., Semler, D., Yap P., & Starr, B. 1997. Learning probabilistic user profiles. AI magazine, 18 (2): 47-56.
Berlyne, D. 1960. Conflict arousal and curiosity. New York: McGraw-Hill.
Berlyne, D. & Lawrence, G. 1964. Effects of complexity and incongruity variables on GSR, investigatory behavior and verbally expressed preference. The Journal of General Psychology, 71: 21-45
Billsus, D., Brunk, C., Evans, C., Gladish, B., & Pazzani, M. 2002. Adaptive interfaces for ubiquitous web access. Communications of the ACM, 45 5: 34-38.
Boley D, Gini M, Hastings K, Mobasher B, Moore J. 1998. A client-side web agent for document categorization. Internet Research-Electronic Networking Applications and Policy, 8 5: 387-+.
Burke, R. 2000. Knowledge-based Recommender Systems. In A. Kent ed., Encyclopedia of Library and Information Systems, 69, Supplement 32. Marcel Dekker, New York. Burke, R. 1999. Integrating knowledge-based and collaborative-filtering recommender systems. Proceedings of the Workshop on AI and Electronic Commerce. AAAI 99. Orlando, Florida.
Chai, J., Horvath, V., Nicolov, N., Stys, M., Kambhatla, N., Zadrozny, W., & Melville, P. 2002. Natural language assistant – A dialog system for online product recommendation. AI Magazine, 23 2: 63-75.
Cho, Y., Kim, J., & Kim, S. 2002. A personalized recommender system based on web usage mining and decision tree induction. Expert Systems with Applications, 23: 329-342.
Cooley, R., Tan, P.N., & Srivistava, J. 1999. WebSIFT: The web site information filter system. Proceedings of the Web Usage Analysis and User Profiling Workshop WEBKDD'99, San Diego, CA, USA.
Day, H. 1966. Looking time as a function of stimulus variables and individual differences. Perceptual & Motor Skills, 22 (2): 423-428.
Deerwester, S., Dumais, S., Furnas, G., Landauer, T., Harshman, R. 1990 Indexing by Latent Semantic Analysis. Journal of the American Society of Information Science. Faw, T. & Nunnally, J. 1967. The Effects on Eye Movements of Complexity, Novelty, and Affective Tone. Perception & Psychophysics. 2 (7): 263-267.
Goldberg, D., Nichols, D., Oki, B.M. & Terry, D. 1992. Using Collaborative Filtering to Weave an Information Tapestry. Communications of the ACM, 35 12: 61-70. Hawking, D. 1999. Results and Challenges in Web Search Evaluation. Proceedings of the 8th International World Wide Web Conference, Toronto, Canada, May 1999. Heinrich, P. 1970. Free looking time: A method for determining preference. Psychologie und praxis, 14 2, 79-93.
Herlocker, J., Konstan, J., Borchers, A., Riedl, J. 1999 An algorithmic framework for performing collaborative filtering. SIGIR ’99: Proceedings of the 22nd Annual International ACM SIGIR conference on Research and Development in Information Retrieval: 230 – 237.
Jin, X., & Mobasher, B. 2003. Using semantic similarity to enhance item-based collaborative filtering. Proceedings of The 2nd IASTED International Conference on Information and Knowledge Sharing, Scottsdale, Arizona.
Joh, Y. H. 2002. Buyer’s customized directory management over sellers’ e-catalogs: logic programming approach. Decision Support Systems, 34: 197-212. Kim, E., Kim, W., Lee, Y. 2003. Combination of multiple classifiers for the customer’s purchase behavior prediction. Decision Support Systems, 34 2: 167-175.
Kohrs, A., & Merialdo, B. 2001. Creating user-adapted websites by the use of collaborative filtering. Interacting with Computers, 13 6: 695-716.
Konstan, J., Miller, B., Maltz, D., Herlocker, J., Gordon, L., Riedl, J. 1997. GroupLens: Applying collaborative filtering to Usenet news. Communications of the ACM, 40 3: 77-87.
Lakoff, G. 1987. Women, Fire, and Dangerous Things: What Categories Reveal about the Mind, Chicago: University of Chicago Press.
Mobasher B., Dai H., Luo T. & Nakagawa M. 2002 Discovery and evaluation of aggregate usage profiles for web personalization. Data Mining and Knowledge Discovery, 6 1, 61-82.
international workshop on Web information and data management: 9-15.
Mobasher, B., Dai, H., Luo, T., Sun, Y., Zhu, J. 2000. Integrating web usage and content mining for more effective personalization. Proceedings of the First International Conference on Electronic Commerce and Web Technologies, LNCS 1875: 165-176.
Morita, M., & Shinoda, Y. 1994. Information filtering based on user behavior analysis and best match text retrieval. In Proceedings of the 17th Annual International ACM SIGIR Conference on Research and Development in Information Retrieval (SIGIR ’94), Ireland, 272-281. Oostendorp, A., & Berlyne, D. E. 1978. Dimensions in the perception of architecture II: measures of exploratory behavior. Scandinavian Journal of Psychology, 19 1: 83 – 89.
Palmer, J. 2002. “Designing for Web Site Usability,” IEEE Computer, July, 102-103.
Parsons, J. and Wand, Y. 1997. “Choosing Classes in Conceptual Modeling,” Communications of the ACM, 406, 63-69.
Perkowitz, M., & Etzioni, O. 2000, “Towards adaptive web sites: conceptual framework and case study,” Proceedings of the Eighth World Wide Web Conference WWW8.
Pine II, B. & Gilmore, J. 1999. The Experience Economy. Harvard Business School Press, Boston, Massachusetts. Poo, D., Toh, T., & Khoo, C. 2000. Enhancing online catalog searches with an electronic referencer. Journal of Systems and Software, 55 2: 203-219.
Prasad, B. 2003. Intelligent techniques for e-commerce. Journal of Electronic Commerce Research, 5 2: 65-71. Raskutti, B., Beitz, A., & Ward, B. 1997. A feature-based approach to recommending selections based on past preferences. User Modeling & User-Adapted Interaction, 7 3: 179-218.
Resnick, P., Iacovou, N., Suchak, M., Bergstrom, P., Riedl, J. 1994. GroupLens: An open architecture for collaborative filtering of netnews. Proceedings of ACM 1994 Conference on Computer Supported Cooperative Work. Sarwar, B., Karypis, G., Konstan, J. Riedl, J. 2001. Item-based collaborative filtering recommendation algorithms. Proceedings of the tenth international conference on World Wide Web, Hong Kong: 285-295.
Sarwar, B., Karypis, G., Konstan, J. A., and Riedl, J. 2000. Application of dimensionality reduction in recommender system -- A case study". ACM WebKDD 2000 Web Mining for E-Commerce Workshop.
Sarwar, B., Konstan, J., Brochers, A., Herlocker, J., Miller, B., Riedl, J. 1998. Using filtering agents to improve prediction quality in the grouplens research collaborative
filtering system. Proceedings of the 1998 ACM Conference on Computer Supported Cooperative Work, Seattle, Washington, United States: 345-354.
Schafer, J., Konstand, J., Riedl, J. 2001. E-commerce recommendation applications. Data Mining and Knowledge Discovery, 5 1/2, 115-153.
Shahabi, C., Banaei-Kashani, F., Chen, Y., & McLeod, D. 2001a. Yoda: An accurate and scalable web-based recommendation system. Proceedings of the Sixth International Conference on Cooperative Information Systems, Trento, Italy.
Shahabi, C., Banaei-Kashani, F., Faruque, J., & Faisil, A. 2001b. Feature matrices: a model for efficient and anonymous web usage mining. Proceedings of WebKDD’01.
Shahabi, C., & Chen, Y-S. 2003. An Adaptive Recommendation System without Explicit Acquisition of User Relevance Feedback. Distributed and Parallel Databases, 14 2: 173-192.
Shahabi, C., Zarkesh, A., Adibi, J., & Shah, V. 1997. Knowledge discovery from users web-page navigation. Proceedings of Workshop on Research Issues in Data Engineering, Birmingham, England.
Spiliopoulou, M & Faulstich, L. 1999. WUM: A Web Utilization Miner. Proceedings of EDBT Workshop WebDB98, Valencia, Spain, LNCS 1590, Springer Verlag. Tettamanzi, A., Tomassini, M. 2001. Soft Computing: Integrating Evolutionary, Neural, and Fuzzy Systems, Springer-Verlag.
Toms, E. G. 2000. Understanding and facilitating the browsing of electronic text. International Journal of Human-Computer Studies, 52 3: 423 – 452.
Wedel, M. & Pieters, R. 2000. Eye fixations on advertisements and memory for brands: A model and findings. Marketing Science, 19 4: 297-312.
Zhang, T., & Ivengar, V. 2002. Recommender systems using linear classifiers. Journal of Machine Learning Research, 2 3: 313 – 334.
Zhao, R., & Grosky, W. 2002a. Bridging the semantic gap in image retrieval. Distributed multimedia databases: Techniques & applications, Idea Group Publishing, Hershey, PA, USA: 14-36.
Zhao, R., & Grosky, W. 2002b. Negotiating the semantic gap: From feature maps to semantic landscapes. Pattern Recognition, 35 3: 593-600.