0095-1137/04/$08.00⫹0 DOI: 10.1128/JCM.42.12.5472–5476.2004
Sequencing Needs for Viral Diagnostics
Shea N. Gardner,
1* Marisa W. Lam,
1Nisha J. Mulakken,
1Clinton L. Torres,
1Jason R. Smith,
2and Tom R. Slezak
1Computations1and Biology and Biotechnology Research Program,2Lawrence Livermore
National Laboratory, Livermore, California
Received 24 December 2003/Returned for modification 7 June 2004/Accepted 6 August 2004
We built a system to guide decisions regarding the amount of genomic sequencing required to develop diag-nostic DNA signatures, which are short sequences that are sufficient to uniquely identify a viral species. We used our existing DNA diagnostic signature prediction pipeline, which selects regions of a target species ge-nome that are conserved among strains of the target (for reliability, to prevent false negatives) and unique relative to other species (for specificity, to avoid false positives). We performed simulations, based on existing sequence data, to assess the number of genome sequences of a target species and of close phylogenetic relatives (near neighbors) that are required to predict diagnostic signature regions that are conserved among strains of the target species and unique relative to other bacterial and viral species. For DNA viruses such as variola (smallpox), three target genomes provide sufficient guidance for selecting species-wide signatures. Three near-neighbor genomes are critical for species specificity. In contrast, most RNA viruses require four target genomes and no near-neighbor genomes, since lack of conservation among strains is more limiting than uniqueness. Severe acute respiratory syndrome and Ebola Zaire are exceptional, as additional target genomes currently do not improve predictions, but near-neighbor sequences are urgently needed. Our results also indicate that double-stranded DNA viruses are more conserved among strains than are RNA viruses, since in most cases there was at least one conserved signature candidate for the DNA viruses and zero conserved signature candi-dates for the RNA viruses.
Sequencing pathogen genomes is costly, particularly when one considers the scope and number of organisms and strains that could be sequenced. We face challenging decisions as to how limited sequencing resources should be allocated. We have built a system to evaluate sequencing needs using simu-lations and random sampling of existing sequence data. When some sequence data are already available, the results indicate whether additional target species genome sequences or ge-nome sequences of close phylogenetic relatives (i.e., near neighbors [NNs]) are required to predict high-quality DNA signatures for target detection. In addition, patterns observed in existing sequence data for classes of viruses (single- or dou-ble-stranded, RNA or DNA, positive or negative sense) may guide initial investments for unsequenced pathogens. Since we have built a dynamic system, not only a one-time analysis, it is possible to do real-time, automated evaluation concerning whether additional target or NN sequencing may still be war-ranted or if diminishing returns may have been reached. This is the first such system, to our knowledge, designed to address these issues. The system applies Monte Carlo simulation, which is a general method using stochastic techniques, based on the use of random numbers and probability statistics.
By a DNA diagnostic signature, we mean two primers and a probe, suitable for a TaqMan assay, that are sufficient to iden-tify the given target species, uniquely distinguishing it from other species. Although we limit our discussion here to viral diagnostic signatures, other avenues of our system address similar questions for protein signatures, forensic DNA
signa-tures, single-gene versus whole-genome sequencing, and com-parisons of draft versus finished sequence data, for bacteria as well as for viruses. Future papers will discuss these results.
Currently, we have the only fully automated DNA diagnostic signature prediction pipeline, described in detail elsewhere (2–4, 9). This pipeline selects regions of a target genome that are both conserved among strains (to prevent false negatives and low reliability) and unique relative to other species (to preclude false positives and low specificity). We use multiple sequence alignment algorithms to generate a consensus se-quence of conserved bases among strains. We have assembled an approximately 1-Gb database of viral and bacterial full-genome sequences for assessing uniqueness. Suffix tree algo-rithms facilitate the creation of a “consensus plus uniqueness gestalt,” or simply the “gestalt,” of sequence fragments unique in the target consensus relative to everything in the database (5, 9). In this gestalt, all bases that are not conserved and/or not unique are represented by dots, and the remaining se-quence fragments may be mined for diagnostic signatures. The DNA signature pipeline then identifies regions suitable for a platform-specific assay; in most cases we predict TaqMan sig-natures composed of two primers and an internal probe. When these signature candidates are destined for laboratory screen-ing, they undergo rigorous in silico screening against the Gen-Bank nonredundant database (a huge sequence database [1]), and, when appropriate, human genomic data, to guard against cross-reaction with nontarget organisms. In addi-tion, signatures to be screened in the laboratory are anno-tated as to whether they are intergenic or land on genes, particularly genes of interest such as those associated with virulence. Our pipeline is limited by the amount of sequence data available.
* Corresponding author. Mailing address: Computations, Lawrence Livermore National Laboratory, P.O. Box 808, L-174, Livermore, CA 94551. Phone: (925) 422-4317. Fax: (925) 423-6437. E-mail: gardner26 @llnl.gov.
5472
on May 15, 2020 by guest
http://jcm.asm.org/
Signatures predicted using our DNA signature pipeline are in daily use by BioWatch and BASIS, the U.S. Centers for Disease Control and Prevention (CDC), a multistate task force testing for animal diseases, and other U.S. federal agencies (6–8). We are actively developing signatures for and in collab-oration with a number of organizations, including the CDC, U.S. Department of Agriculture, Food and Drug Administra-tion, U.S. Army Medical Research Institute for Infectious Dis-eases, and others. Our TaqMan-based assays for variola (small-pox) tested best in biosafety level 4 laboratory screening and are in daily use, and our severe acute respiratory syndrome (SARS) assays are performing well in screening at the U.S. Army Medical Research Institute for Infectious Diseases. These accomplishments uniquely qualify us to assess sequenc-ing needs for diagnostic signature development.
For assessing sequencing needs for diagnostic DNA signa-tures, we ran more than 30,000 Monte Carlo simulations with random samples of target and NN sequences, summarized in Table 1. The goal was to estimate the minimum number of sequences required to approximate the number of TaqMan signature candidates predicted when all sequence data avail-able are used. That is, how much do we overestimate the number of conserved, unique signature candidates when we only have a fraction of the data compared to when we use all of the available data? Which are more valuable, target or near-neighbor sequences, for pruning the list of signature can-didates to those most likely to be conserved and unique, and thus likely to succeed in screening?
MATERIALS AND METHODS
We began our analyses with a pool of target strain sequences and a pool of NN
sequences, and we randomly selectedssamples of sizettarget sequences andn
NN sequences from the target and NN pools, respectively. Each sample of organisms was run through our DNA signature pipeline, with signature
predic-tion based on conservapredic-tion among thettarget strains and uniqueness relative to
our 1-Gb database minus those NNs in the NN pool that were not chosen in that sample. Thus, for each sample, the number of signature candidates was predicted
as though we had onlytandnsequences, as well as the rest of the less-closely
related organisms in our database that are not considered NNs. We then assessed how much sequence data was required to approximate the number of signature
candidatescthat were predicted when the full data set (all target and NN
sequences) was analyzed. Using the full data set will yield the fewest signatures, because lack of conservation or uniqueness will winnow away all unsuitable candidates.
To complete the process outlined above, we developed a dynamic system, including a database for storing and querying results, a web-based system for displaying results, statistical programs to summarize results and create plots, and a process manager to oversee all of these features. The process manager auto-matically schedules parallel Monte Carlo runs, manages and maintains a stable load on the computer system, and performs input-output operations from the database. To date, more than 90,000 runs of the DNA signature pipeline have been run, requiring approximately 15 to 20 min each for most viruses, for the examination of 20 viruses. Even with a 24-CPU Sun server, we are limited by
processing time to running ansof 10 samples for each combination oftandn,
generating hundreds to thousands of DNA signature pipeline runs for each target organism.
[image:2.585.41.546.81.314.2]We analyzed species for which at least four sequenced complete genomes were available, primarily from the National Center for Biotechnology Information (NCBI) GenBank. In most cases, we performed our analyses at the species level. NN pools for our Monte Carlo analyses were selected based on the relationship between the target set and close taxonomic relatives, or neighbors, elucidated by the NCBI taxonomy structure. NNs were organisms that were in the same family
TABLE 1. Number of target and NN sequences required for development of high-quality diagnostic signaturesa
Genome structure Virus Target pool
size
NN pool size
Minimized target sequences
Minimized NN sequences
No. of TaqMan signatures from full data set
t n t n
Double-stranded DNA Variola 14 15 1 4 7 2 ⬍20
Vaccinia 6 29 1 4 4 1 0
Human Papillomavirus virus type 16 5 113 3 4 4 0 6
Human adenovirus B 6 29 4 1 5 0 3
JC virusb 187 32 5 5 8 0 0
Single-stranded DNA Maize streak virus 32 155 1 0 1 0 0
Retroid Hepatitis B 424 39 1 0 1 0 0
Human immunodeficiency virus 1 333 66 1 8 2 0 0
Human immunodeficiency virus 2 11 388 2 0 2 0 0
Single-stranded RNA (negative sense)
Vesicular stomatitis virus 4 21 3 0 3 0 2
Ebola Zaire virus 5 8 1 0 1 0 167
Marburg virus 6 7 3 1 4 0 0
Mumps virus 12 53 4 7 5 0 2
Single-stranded RNA (positive sense)
Venezuelan equine encephalitis 18 29 2 1 3 0 0
Plum pox virus 5 78 2 1 3 0 14
Human poliovirus 1 22 127 3 1 4 0 0
Human poliovirus 2 9 140 3 4 4 0 0
Human poliovirus 3 4 145 2 0 2 0 0
SARS 50 35 1 0 1 0 85
Foot-and-mouth disease virus type O 14 120 2 2 3 0 0
a
To objectively select a minimum number of target and NN sequences required for development of high-quality DNA diagnostic signatures, we selected the
following: (i) the (t,n) pair with the minimum number of target sequences for which the 75% quantile of results from random Monte Carlo simulations was less than
or equal toc⫹20, wherecis the number of signature candidates when the full data set is used; and (ii) the (t,n) pair with the minimum number of NN sequences
for which the 75% quantile was less than or equal toc⫹20. Thus, if onlyttarget strains andnNNs had been sequenced, one would have a 75% certainty of predicting
no more than 20 poor candidates out of the total candidates generated, which would have been eliminated computationally if all currently existing sequence data had been used in the predictions. TaqMan signature candidates are conserved among all sequenced strains and unique relative to all other bacterial and viral sequences in our 1-Gb database of complete genomes, with no degenerate bases present in the signatures.
b
For JC virus in whichcwas 0, usingc⫹20 requiredtof 10 andnof 8 for both minimizations. So in the table above we increased the threshold number of signature
candidates toc⫹30.
on May 15, 2020 by guest
http://jcm.asm.org/
as the target species. For analyses at the level of subspecies instead of species, anything in the same genus as the target subspecies was considered a NN. In other words, any organism in the same clade as the target species or subspecies, as given by going up two levels in the NCBI taxonomic structure, was considered a NN.
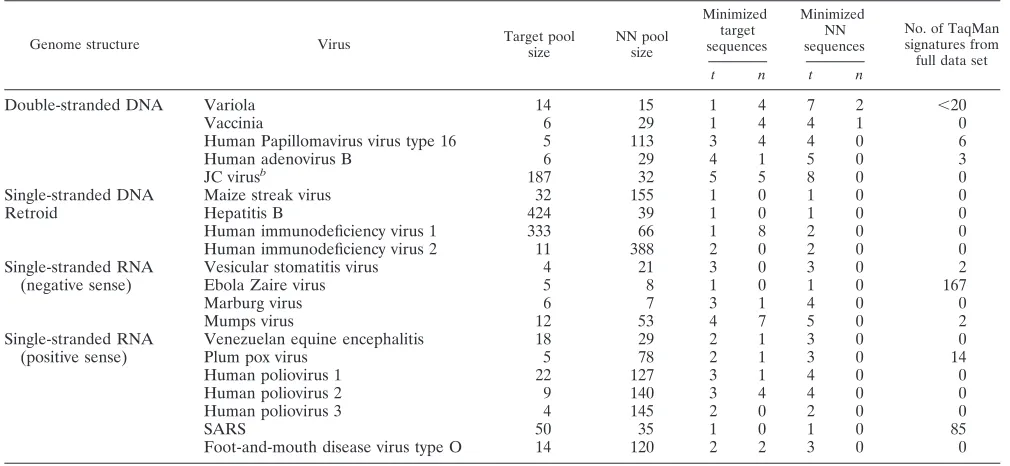
Range plots illustrate the span of predictions generated by different random
samples of genomes (Fig. 1 to 3). Along theyaxis, whole numbers represent the
numbertof target strains and the incremental values between the integers
represent the numbernof NN genomes. Outcomes indicating the ability to
generate signature candidates are plotted along thexaxis as a horizontal line
spanning the range of predicted values for thesrandom samples.
The 75% quantiles of the samples are plotted. If a random sample ofttarget
strains andnNN strains were sequenced, there would be a 75% chance that the
quality measure for that sample would be less than or equal to the 75% quantile mark. The quality measure shown here is the number of TaqMan signature candidates. The expected outcome is a reduction in the number of signature candidates that are generated as nonunique and nonconserved candidates are eliminated with increases in the number of target and NN sequences used to predict the signatures. One may also plot the fraction of the target genome that is conserved among strains and unique relative to other species as the quality measure (data not shown). This gives a more general estimate of the region that may be available for development of any DNA-sequence-based detection assay, regardless of the technology platform.
These range plots enable us to examine the entire span of outcomes on a relatively simple graph and to rapidly determine the value of target and NN
sequences. Contour or topographic plots, traditionally used for complex data with two independent variables, were uninformative in preliminary analyses,
since only one quantile point for each (t,n) pair, and not the entire range, could
be displayed at once.
RESULTS
Analyses indicate that lack of conservation, more than lack of uniqueness, limits our ability to find species-specific, spe-cies-wide TaqMan signatures for most viruses, and thus more target than NN sequence data are required (Table 1). The range of the number of TaqMan signatures for random sub-samples of plum pox virus and NN genomes remains the same for a given target set size, regardless of the number of NNs, illustrated by the rectangular, stair-stepped pattern of horizon-tal lines in Fig. 1. That is, additional NN genomes do not result in a reduction in the number of signature candidates, as shown by the range of the number of signature candidates that is the same whether there are 0 or 10 NNs; for example, the range of the number of signature candidates indicated by the horizontal range line aty of 2.0, using 0 NNs in the calculations, is the same as the range of the number of signature candidates atyof
[image:3.585.47.283.67.393.2]⬃2.8, including 10 NNs in the calculations, in Fig. 1. In con-trast, as the number of target sequences increases, the number
[image:3.585.301.542.346.673.2]FIG. 1. Range plot for plum pox virus, displaying results typical of many viruses. To discriminate samples in which zero NNs were used, the range is drawn as a horizontal grey line, and whennis⬎0, the range is drawn as a black line. The best estimate of the true value is the quality measure determined using the entire target and NN pools and is represented by a vertical black line. This best estimate plus a con-stantc of 20 is at the location of the vertical dashed line and was selected to indicate a reasonable distance from the true answer. The 75% quantile for each range is shown with a black, vertical tick mark.
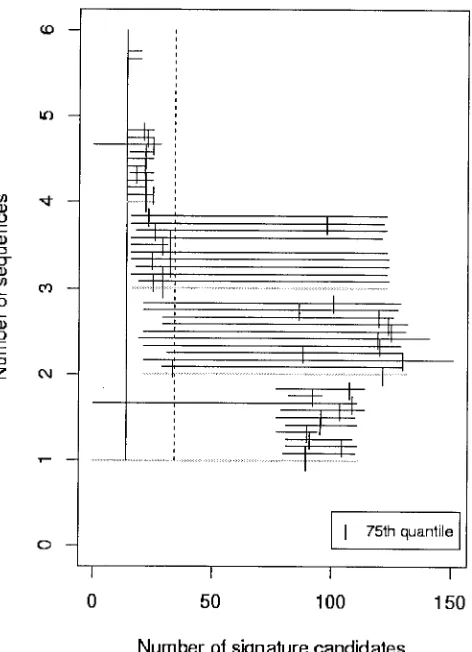
FIG. 2. Range plot for vaccinia, illustrating that NN sequence in-formation is critical to eliminate signature candidates that are not species specific. Three or four each of target and NN sequences appear to be adequate for prediction of a short list of signature candidates that are suitable for laboratory screening.
on May 15, 2020 by guest
http://jcm.asm.org/
of signature candidates decreases; most random samples of two target genomes give over 100 signature candidates (e.g., range line at y of 2.0), while most random samples of four target genomes give fewer than 25 signature candidates (e.g., range line at y of 4.0). This pattern indicates that multiple target sequences, but not NNs, assist in identifying the highest quality signatures. Most of the viruses had results qualitatively similar to those for plum pox virus. There are four notable exceptions discussed below.
The first two exceptions are variola virus and vaccinia virus. For variola and vaccinia, NN sequences are particularly essen-tial to identify unique signatures (Fig. 2). As the size of the NN set grows, regardless of the number of targets, the range of the number of signature candidates shrinks and moves toward fewer signatures. This triangular pattern suggests that NN se-quences factor prominently in identifying regions of the ge-nome that are unique to the target species. In fact, conserva-tion among strains of variola and among strains of vaccinia enabled us to generate a reasonable list of signature candidates with only a single target sequence, as long as four NN se-quences were available to eliminate nonunique regions (Table 1). NN sequences also facilitated signature generation for other double-stranded DNA viruses but not nearly to the ex-tent as for variola and vaccinia. Human adenovirus B was the
only double-stranded DNA virus for which NNs did not im-prove signature prediction. Thus, there is a general pattern that NN data aids in signature prediction for double-stranded DNA viruses, but this is not a rule.
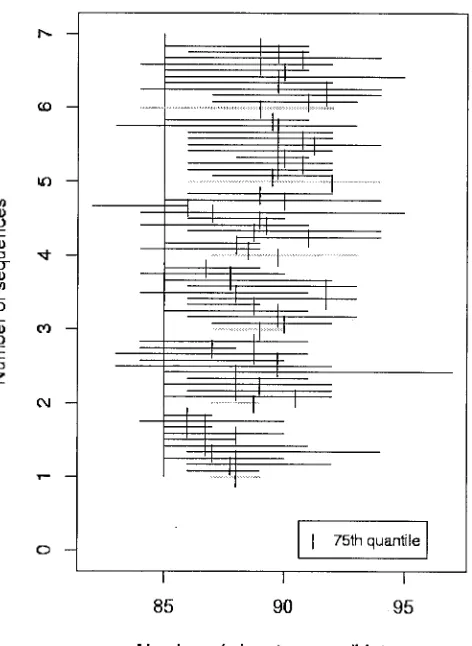
The two other exceptional cases are SARS and Ebola Zaire, for which we need close NN sequences but no more target se-quences (Fig. 3). For both these species, additional sese-quences after the first target provide no guidance as to signature pre-diction. Because sequenced isolates are so closely related, any single target provides virtually the same information for the purpose of generating detection signatures. The second point clearly illustrated in Fig. 3 is that there are no close NNs currently sequenced to reduce the pool of candidates. Cur-rently, we have a severe need for sequence from close NNs of SARS and Ebola Zaire to narrow the pool of signature candi-dates to those least likely to generate false positives in the field. For Ebola Zaire, neither Ebola Reston nor Marburg virus, currently the most closely related organisms for which we have sequence data, are sufficiently similar to rule out signature candidates that might cross-react in the field.
DISCUSSION
Although analyses presented here illustrate that it may not be possible to find a single, species-wide, species-specific sig-nature for many viruses, other analyses show that it is often possible to find a single TaqMan signature with a limited num-ber of degenerate bases, and it is always possible to find a set of TaqMan signatures that will, in combination, detect all strains (4). These analyses indicate that sequencing three or four strains of most RNA viruses will highlight the regions that are least conserved and thus are inappropriate regions for DNA-based detection signatures. The remaining, more-con-served sequence regions may then be mined for detection signatures, whether a single signature or several signatures are required to detect all strains. In some cases where strains cluster into types, the distinction between types and species may be subjective along a continuum. In these situations, type-specific signatures may be a more appropriate goal than spe-cies-specific signatures, particularly if types differ in virulence. NN sequences aid more in signature prediction if they are closely related to the target. This is the case for variola and vaccinia, due to the low mutation rate for orthopox viruses and the similarity of species in this genus. We are in the process of analyzing sequencing needs to develop diagnostic signatures for bacteria, and preliminary results indicate that variola and vaccinia may be more similar to bacteria, with their much larger genomes, than to other viruses in terms of the require-ment for NN sequence data. Indeed, the variola and vaccinia genome sequences are an order of magnitude longer than those of the other viruses with sufficient sequence data for our Monte Carlo methods. Conservation does not depend on se-quence length alone, however, as illustrated by JC virus, the shortest of the double-stranded DNA viruses we examined at approximately 5,000 bp, and with a huge number of sequenced genomes (Table 1). Although no single signature was present in all genomes, other analyses (data not shown) indicate that there are 23 TaqMan signature candidates that are shared among at least 75% of the 187 JC genomes. Thus, for this short virus, there is relatively high sequence conservation. In
sum-FIG. 3. Range plot for SARS, similar to that for Ebola Zaire (data not shown), illustrates that additional target sequence data do not narrow the list of signature candidates. No NN sequences available at the time of these analyses were similar enough to winnow the list of signature candidates.
on May 15, 2020 by guest
http://jcm.asm.org/
[image:4.585.48.284.65.388.2]mary, our results indicate that double-stranded DNA viruses are more conserved among strains than are RNA viruses, since in most cases there was at least one conserved signature didate for the DNA viruses and zero conserved signature can-didates for the RNA viruses.
Sequences for SARS and Ebola Zaire are unusually con-served compared to other RNA viruses because all the se-quenced isolates originate from a geographically limited area and have been sampled in a relatively short period of time, thus leaving short opportunity for strain divergence. With time and geographic isolation, strain diversity will become more impor-tant, but at this time no further sequencing of SARS and Ebola Zaire isolates are necessary for developing diagnostic signa-tures for these species. Instead, sequencing of close phyloge-netic relatives of these species is urgently needed.
ACKNOWLEDGMENTS
This work was performed under the auspices of the U.S. Depart-ment of Energy by the University of California, Lawrence Livermore National Laboratory, under contract no. W-7405-Eng-48. This work was supported by the Intelligence Technology Innovation Center. Se-quence data from the CDC and colleagues at Lawrence Livermore National Laboratory, which we have used in our analyses, are grate-fully acknowledged. S.N.G. formulated the approach and leads the project and was responsible for the data interpretation presented here. M.W.L. built the process manager and computational infrastructure for scheduling the Monte Carlo simulations. N.J.M. designed the da-tabase and developed the statistical programs for creating the graphs. C.L.T. assisted in building and maintaining the computational
infra-structure. J.R.S. is responsible for target selection and development of the tools for creating target and NN sequence pools. T.R.S. leads our bioinformatics team and oversees all aspects of the work. We thank Carol Zhou for providing comments on drafts of this paper.
REFERENCES
1.Benson, D. A., I. Karsch-Mizrachi, D. J. Lipman, J. Ostell, B. A. Rapp, and D. L. Wheeler.2000. GenBank. Nucleic Acids Res.28:15–18.
2.Fitch, J. P., B. A. Chromy, C. E. Forde, E. Garcia, S. N. Gardner, P. Gu, T. A. Kuczmarksi, C. Melius, S. L. McCutchen-Maloney, F. M. Milanovich, V. L. Motin, L. L. Ott, A. Quong, J. Quong, J. M. Rocco, T. R. Slezak, B. A. Sokhansanj, E. A. Vitalis, A. T. Zemla, and P. M. McCready.2002. Presented at the IEEE Workshop on Genomic Signal Processing and Statistics (GEN-SIPS), Oct. 12–13, 2002, Raleigh, N.C.
3.Fitch, J. P., S. N. Gardner, T. A. Kuczmarski, S. Kurtz, R. Myers, L. L. Ott, T. R. Slezak, E. A. Vitalis, A. T. Zemla, and P. M. McCready.2002. Rapid
development of nucleic acid diagnostics. Proc. IEEE90:1708–1721.
4.Gardner, S. N., T. A. Kuczmarski, E. A. Vitalis, and T. R. Slezak.2003. Limitations of TaqMan PCR for detecting divergent viral pathogens illus-trated by hepatitis A, B, C, and E viruses and human immunodeficiency virus.
J. Clin. Microbiol.41:2417–2427.
5.Giegerich, R., S. Kurtz, and J. Stoye.2003. Efficient implementation of lazy
suffix trees. Softw. Pract. Exp.33:1035–1049.
6.Heller, A.2003. BASIS counters airborne bioterrorism. Sci. Technol. Rev. [Online.] http://www.llnl.gov/str/October03/pdfs/10_03.2.pdf.
7.Morris, T.2003. LRN results messenger BioWatch deployment. [Online.] http: //www.cdc.gov/phin/conference_presentations/05-14-03/5E/2003%20PHIN %20Conference%20Session%205E%20-%20Tim%20Morris.pdf.
8.Roos, R.2003. Signs of tularemia agent detected in Houston air. [Online.] http: //www.cidrap.umn.edu/cidrap/content/bt/tularemia/news/oct1003biowatch .html.
9.Slezak, T., T. Kuczmarski, L. Ott, C. Torres, D. Medeiros, J. Smith, B. Truitt, N. Mulakken, M. Lam, E. Vitalis, A. Zemla, C. E. Zhou, and S. Gardner.2003. Comparative genomics tools applied to bioterrorism defence. Brief.
Bioinfor-matics4:133–149.