0095-1137/07/$08.00
⫹
0
doi:10.1128/JCM.01543-06
Copyright © 2007, American Society for Microbiology. All Rights Reserved.
Probe Hybridization Array Typing: a Binary Typing Method for
Escherichia coli
䌤
U. Srinivasan,
1L. Zhang,
1A. M. France,
1D. Ghosh,
2W. Shalaby,
1J. Xie,
1C. F. Marrs,
1and B. Foxman
1*
Department of Epidemiology
1and Department of Biostatistics,
2School of Public Health,
University of Michigan, Ann Arbor, Michigan 48109
Received 25 July 2006/Returned for modification 11 September 2006/Accepted 16 October 2006
The ability to distinguish between
Escherichia coli
strains is critical for outbreak investigations. Binary
typing, based on the presence or absence of genetic material, provides a high-throughput alternative to
gel-and PCR-based typing techniques that generate complex bgel-anding patterns gel-and lack uniform
interpreta-tion criteria. We developed, validated, and determined the discriminatory power of an
E. coli
binary typing
method, probe hybridization array typing (PHAT). In PHAT, the absence or presence of genetic material
is identified by using DNA hybridization to produce a reproducible and portable fingerprint for each
genome. PHAT probes were generated from genome subtractive hybridization experiments. We PHAT
typed the ECOR collection of strains from a variety of geographical locations, and 33 rectal
E. coli
strains
selected from college-aged women with urinary tract infection. In the set of 33 human rectal strains, the
discriminatory power of PHAT (98%) equaled that of multilocus sequence typing (MLST) and pulsed-field
gel electrophoresis. However, for ECOR strains, which include nonhuman strains, the current set of PHAT
probes was less discriminating than MLST, ribotyping, and enterobacterial repetitive intergenic
consen-sus sequence PCR (80% verconsen-sus 97, 92, and 97%, respectively). When we limited the analysis to ECOR
strains of B2 and D lineage, which are associated with human infection, current PHAT probes were highly
discriminatory (94%). PHAT can be applied in a high-throughput format (i.e., “library on a slide”), the
discriminatory ability can be varied based on the probe set, and PHAT is readily adapted to other bacterial
species with high variation in genetic content.
The ability to distinguish between
Escherichia coli
strains is
critical for outbreak investigations; thus, the availability of
rapid, reliable, valid, and high-throughput typing methods is
desirable. Traditional serogroup- and phage-based typing
methods have been increasingly replaced by more-rapid DNA
fragment-based typing methods, including (i) repetitive
se-quence methods based on PCR such as enterobacterial
repet-itive intergenic consensus (ERIC) sequencing and randomly
amplified polymorphic DNA (RAPD) detection (11, 16, 27),
(ii) restriction digest and gel-based methods such as ribotyping
and pulsed field gel electrophoresis (PFGE) (24), (iii)
se-quence-based methods such as multilocus sequence typing
(MLST) (14, 24), (iv) whole-genome sequencing, and (v)
sin-gle-nucleotide polymorphism (SNP) typing (10).
Most gel- and PCR-based techniques generate complex
banding patterns that lack uniform interpretation criteria (17).
Although PFGE can be highly reproducible when a standard
protocol and equipment is used, problems remain (17). The
interpretation of gel-based methods is most straightforward
when additional information regarding the relationships
be-tween strains is available, such as when they are
epidemio-logically linked and when assays are conducted in a single
laboratory (24).
DNA-based typing methods have the advantage of portability
and reproducibility. MLST is based on direct sequencing of
400-to 500-bp regions of five 400-to seven housekeeping genes (1, 14).
Each strain is scored based on nucleotide substitutions observed
and assigned to unique allelic profile sequence types. This method
has a high discriminatory power but is labor-intensive,
time-con-suming, and still is impractical for high-throughput applications.
SNP typing based on high-throughput sequencing of 13 SNPs
from 11 genes used for MLST has been demonstrated for
E. coli
(10). Although SNP typing is less discriminatory than MLST (for
the SNPs analyzed), when used for phylogeny the resulting
group-ings are similar to those found by using MLST.
Binary typing is an alternative DNA-based typing method to
MLST and is suitable for organisms with a large variation in
genetic content. In binary typing, each strain is assigned a
signature based on the presence or absence of a set of defined
DNA sequences rather than allelic profiles. Binary typing using
comparative genomic hybridization, containing all of the open
reading frames (ORFs) of a sequenced genome
(genomotyp-ing), has been demonstrated for typing clinical bacterial
Campylobacter
and
Salmonella
strains (13, 18). In this method,
strains can be typed for the presence or absence of all the
coding regions on the bacterial genome. Although
genomotyp-ing has high discriminatory power, it is time-consumgenomotyp-ing for
typing large collections since it uses a large number of ORFs to
type a few bacterial strains. Oligonucleotide-based arrays have
also been used to type bacterial strains (10).
A binary typing method using probes generated from RAPD
sequences has been validated for
Staphylococcus aureus
(25, 26,
29). We describe here the development and validation of a
hybridization-based binary typing method for
E. coli
, probe
* Corresponding author. Mailing address: Department of
Epidemi-ology, University of Michigan, School of Public Health, 109
Observa-tory, Ann Arbor, MI 48109. Phone: (734) 764-5487. Fax: (734)
936-6732. E-mail: [email protected].
䌤
Published ahead of print on 1 November 2006.
206
on May 16, 2020 by guest
http://jcm.asm.org/
hybridization array typing (PHAT), and compare it to other
typing methods. By selecting probes with the most
discriminat-ing power, we demonstrate that a relatively small probe set can
be used to type large numbers of diverse bacterial strains.
Consecutive additions to the PHAT probe set can be used to
adjust the discriminatory power of PHAT.
PHAT uses the genetic diversity of the genome for
identifi-cation rather than the conserved sequences favored by MLST.
The more diverse regions that are shared among a group of
strains, the more likely the strains are closely related. By
fo-cusing on the presence or absence of genetic content rather
than allelic variation in conserved genes, PHAT detects
changes on a relatively short time scale. The presence or
ab-sence of genetic regions is identified by using DNA
hybridiza-tion. The resulting string of zeros and ones, corresponding to
the absence and presence of the chosen genetic regions,
cre-ates a reproducible and portable PHAT “type” that is easily
compared across laboratories. PHAT has the advantage of an
adjustable level of discrimination: increasing the number of
probes in the probe set will increase the level of discrimination
between strains. Further, collapsing to a smaller probe set has
a clearer biological meaning than similarity based on gel band
pattern, since the genetic content of specific bands is usually
unknown. PHAT can be applied in a high-throughput
“library-on-a-slide” (LOS) format (33) and is readily adapted to other
bacterial species with high variation in genetic content.
MATERIALS AND METHODS
We selected potential genomic regions for inclusion in PHAT from a set of PCR probes generated from genome subtraction experiments (described below) using probes with a prevalence of 40 to 60% among rectalE. colistrains. Probe choice and optimal probe number was determined by probing a set of rectalE. colistrains and determining the statistical entropy (described below) of each probe, in all possible permutations of probe orders. We compared the discriminatory power of PHAT to those of other methods by use of Simpson’s diversity index (12).
E. colicollections.Subtraction PCR (sPCR) probes generated from genome
subtraction experiments were used to probe three differentE. colicollections: (i) theE. coli reference collection (ECOR), which is a collection of 72 strains isolated from a variety of hosts and geographical locations (http://foodsafe.msu .edu/Whittam/ecor/); (ii) a set of 33E. colistrains for which PFGE was available, also selected from college women aged 18 to 39 years with urinary tract infections (UTI) (8); and (iii) a set of 106 rectal strains randomly selected fromE. coli isolates collected from college women aged 18 to 39 years with their first diag-nosed UTI (9). The UTI collections have previously been characterized for the presence or absence of genes encoding adhesin P-pili (pff) further divided by adhesin subgroup (papGAD,papGJ96, andprsGJ96), S fimbrial adhesin (sfa),
aerobactin (aer), group II capsule (kpsMT), cytotoxic necrotizing factor (cnf1), Dr family of adhesins (drb), hemolysin (hly), outer membrane protease T (ompT), Irg homolog adhesin (iha), uropathogenic specific protein (usp), cat-echole siderophore receptor gene (iroNE. coli), and heat-resistant agglutinin (hra)
as described previously (4, 15, 23).
sPCR fragment selection.We generated a library of genomic sequences that are present on one bacterial strain (tester) but absent on another (driver) using sPCR. sPCR fragments from four different subtractions were used. These genomic subtraction experiments yielded sPCR fragments that were either uniquely present in a greater number of pathogenic UTI strains or more likely to be involved in shared strains between heterosexual partners or shared between bladder, vaginal, and rectal sites. The details of these subtractions are described elsewhere (3, 23, 28, 30, 32). sPCR fragments were cloned into commercial vectors (TOPO; Invitrogen, Inc.) and probed for presence or absence in UTI and non-UTIE. colicollections. Probes that were present in 40 to 60% of the screened study populations were selected as possible PHAT candidates. The magnitudes of the association between the different sPCR fragments were esti-mated by using the odds ratios and 95% confidence intervals, and the significance was tested by using the chi-square test. All analyses were done by using SAS v8.0.
Preparation of DNA probes.sPCR fragments were prepared by PCR from the strains from which they were originally cloned by using M13R and T7 primers. PCR amplification was performed using the model PTC-100 programmable thermal cycler (MJ Research), and the conditions used were at 94°C for 1 min, followed by 30 cycles of denaturation at 94°C for 30 s, annealing at 68°C for 30 s, and extension at 74°C for 1 min. The PCR products were purified by using a commercial PCR purification kit (QIAGEN, Inc.) and stored at⫺20°C for long-term use.
Dot blot hybridizations for PHAT.E. colistrains were probed by using dot blot hybridization with fluorescence-labeled PHAT probes. Briefly, bacterial DNA was prepared by growing strains overnight in LB medium in a 96-well deep-well plate (1 ml per well; Corning, Inc.). Bacterial cells were pelleted by centrifuga-tion at 3,000 rpm in a Beckman desktop centrifuge and lysed with 800l of 0.4 N NaOH–10 mM EDTA at 70°C for 30 min. The bacterial lysate was arrayed on nylon membrane (Hybond H⫹; Amersham Pharmacia) using a BIO-dot micro-filtration apparatus (Bio-Rad Laboratories). Nylon membranes were washed with 2⫻SSC (1⫻SSC is 0.15 M NaCl plus 0.015 M sodium citrate), dried, and fixed by using UV light. Fluorescently labeled gene fragments were hybridized to nylon membranes and detected by using the ALKPHOS fluorescein-based de-tection kit (Amersham) according to the manufacturer’s instructions. Mem-branes were prehybridized with 20 ml of hybridization buffer for 30 min, followed by the addition of probe (200 ng). Hybridizations were carried out at 55°C overnight, and membranes were washed with primary and secondary wash buffers according to the manufacturer’s protocol. Fluorescent signal was generated by using the ECF substrate provided in the kit. Hybridization intensities were detected by using Storm 860 PhosphorImager (Molecular Dynamics) and ana-lyzed by using Image-QuaNT 5.0. The signal intensity of each spot was normal-ized to the intensity of each probe’s positive control according to a previously published protocol (32). All strains were tested for the presence or absence of probe with a minimum of two independent membranes. Ambiguous results were retested on duplicate membranes and confirmed by Southern hybridization using previously described protocols (32). Sequencing of sPCR fragment DNA was performed at the University of Michigan Molecular Biology Core Facility using an Applied Biosystems model 373A automated sequencer.
[image:2.585.302.541.89.311.2]MLST. MLST was performed using the protocols listed on the EcMLST database (www.shigatox.net). Briefly, PCRs were performed to obtain⬃500-bp fragments for seven housekeeping genes, purified and sequenced at the Univer-sity of Michigan Molecular Biology Core Facility in both the 3⬘ and the 5⬘ directions. A consensus sequence was obtained for each of the seven gene
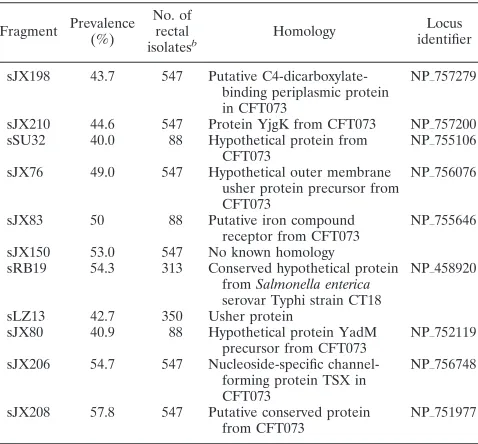
TABLE 1. PHAT probe candidates used for the calculation of
Simpson’s diversity index and entropy calculations
aFragment Prevalence (%)
No. of rectal
isolatesb Homology
Locus identifier
sJX198 43.7 547 Putative C4-dicarboxylate-binding periplasmic protein in CFT073
NP㛬757279
sJX210 44.6 547 Protein YjgK from CFT073 NP㛬757200 sSU32 40.0 88 Hypothetical protein from
CFT073
NP㛬755106
sJX76 49.0 547 Hypothetical outer membrane usher protein precursor from CFT073
NP㛬756076
sJX83 50 88 Putative iron compound receptor from CFT073
NP㛬755646
sJX150 53.0 547 No known homology sRB19 54.3 313 Conserved hypothetical protein
fromSalmonella enterica serovar Typhi strain CT18
NP㛬458920
sLZ13 42.7 350 Usher protein
sJX80 40.9 88 Hypothetical protein YadM precursor from CFT073
NP㛬752119
sJX206 54.7 547 Nucleoside-specific channel-forming protein TSX in CFT073
NP㛬756748
sJX208 57.8 547 Putative conserved protein from CFT073
NP㛬751977
aProbes are listed in the order used for the entropy calculation.
bThe number of rectal isolates in which the prevalence of different gene
fragments was determined. sLZ-, sJX-, sRB-, and sSU-prefixed gene fragments were derived from different genomic subtraction experiments that are published elsewhere (4, 23, 28, 30).
V
OL. 45, 2007
PROBE HYBRIDIZATION ARRAY TYPING
207
on May 16, 2020 by guest
http://jcm.asm.org/
fragments in 33 strains of E. coli. Allele types were assigned to the PCR-amplified sequences after comparison with the EcMLST database for nucleotide substitutions. The combination of allele types for the seven housekeeping genes gave the sequence type (ST) for each strain.
PFGE.PFGE was performed according to our previously published protocol (8). Briefly, NotI-digested DNA was electrophoresed in a Bio-Rad pulsed-field appara-tus (Hercules, CA) in 1.3% SeaKem HGT agarose at 14°C with pause ramping from 10 to 22 s for 14 h and from 55 to 60 s for 8 h at field strength of 6 V/cm. Gels were stained with Vistra green (Amersham Biosciences) and scanned by using a Storm phosphorimager. The data was analyzed by using commercially available software (BioNumerics). The sequencedE. colistrain CFT-073 was used as the internal control for creating a dendrogram based on PFGE types.
ERIC-PCR and automated ribotyping (AR).Ribotyping was performed by using the RiboPrinter microbial characterization system from Qualicon (Wil-mington, DE). This automated typing system produces a RiboPrint pattern using anE. colirRNA probe hybridized to restriction enzyme-digested chromosomal DNA.E. colistrains were digested using EcoRI enzyme based on the manufac-turer’s instructions. Ribotype groups were defined by the RiboPrinter system, which assigns ribogroups by comparing differences in band number, position, and signal intensity (19).
PCR amplifications of ERIC sequences were performed onE. colistrains using a modification of a protocol described previously (31). ERIC patterns were evaluated by using BioNumerics software from Applied Maths (Kortrijk, Belgium) (16, 31). Briefly, similarity matrices were constructed on the basis of Pearson correlation coefficient analysis of pairwise comparisons of ERIC patterns. We performed clus-tering analysis and constructed a dendrogram with the unweighted pair group method using arithmetic averages based on the similarity matrices. Strains with more than 90% similarity were placed in the same ERIC group.
Microarray LOS arraying and hybridizations.Genomic DNA (target) was purified from bacterial strains by using a QIAGEN genomic DNA purification kit according to the manufacturer’s recommendations, sonicated, and centrifuged, and supernatants were arrayed and hybridized according to previously pub-lished protocols (33). Cy3 and Cy5 fluorescence- and biotin-labeled probes were generated from SJX206 and the 16S RNA housekeeping genes by using the BioPrime DNA labeling system (Invitrogen) and appropriate deoxy-nucleoside triphosphate mixtures. The probes were hybridized to glass slides that were previously arrayed with purified genomic DNA from 106 bacterial isolates in triplicate on Superamine glass slides (Telechem), and the hybrid-ization signals were detected by using a Versarray Chipreader (Bio-Rad). The signal intensity of each spot was normalized to the signal intensity of the 16S RNA probe (housekeeping gene) to account for differences in genomic DNA concentrations at different spots and compared to the intensity of the positive control (sequence strain known to contain the gene probe) to determine the presence or absence of the sPCR fragment in different bacterial strains (see Fig. 6). Since LOS is a high-throughput microarray-based dot blot hybridiza-tion platform, we use the criteria established previously to determine probe positive cutoffs in dot blot hybridization to determine the positive cutoff points for LOS (32).
Simpson’s index of diversity.We calculated an index of discrimination based on the probability that two unrelated strains sampled from the test population will be placed into distinct typing groups (12). This value can be calculated as Simpson’s diversity index (D) by the following equation:
D⫽1⫺N共N1⫺1兲
冘
j⫽1 s
[image:3.585.96.486.72.429.2]nj共nj⫺1兲
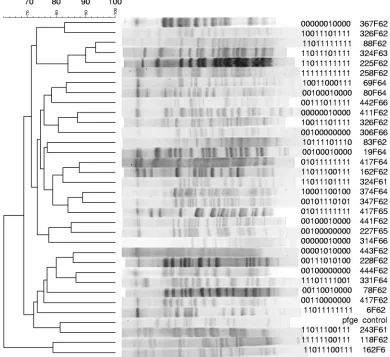
FIG. 1. PFGE and PHAT analysis of 33 rectal
E. coli
strains. Clustering was constructed using PFGE data.
on May 16, 2020 by guest
http://jcm.asm.org/
whereNis the total number of strains in the sample population,sis the total number of types described, andnjis the number of strains belonging to thejth
type.
Statistical entropy.To determine the optimal number of probes required for PHAT typing, we calculated the entropy for the first probe and then calculated the entropy iteratively as more probes were added to the PHAT probe set. Entropy (E) is calculated as follows: E⫽p1⫻log(p1)⫹p2⫻log(p2)⫹. . . pk⫻
log(pk), where pkis the contribution of thekth PHAT signature to the total
entropy (22). A binary PHAT signature was generated by collating the presence or absence of different sPCR fragments (Table 1). The occurrence of each unique PHAT signature in the collection was determined as a percentage of the total frequency of all PHAT signatures. This established the contribution of entropy of each unique PHAT signature to the total entropy for a given probe set. The total entropy calculation was repeated iteratively as additional PHAT probes were added to maximize the discrimination with a minimal number of probes for isolates in this collection.
Data analysis.All analyses were done using SAS v8.0. Access (Microsoft, Redmond, WA) was used for data entry. Software packages from DNAStar (Madison, WI) were used for primer design, DNA sequence comparison, and analysis.
RESULTS
[image:4.585.123.482.69.532.2]Selection of sPCR probes for PHAT analysis.
We identified
11 candidate probes from sPCR fragments generated from
four genomic subtraction experiments with a uropathogenic
E.
coli
strain as the tester and a nonuropathogenic
E. coli
strain as
the driver. Genomic subtraction generates a library of
candi-date gene sequences that are present in one bacterial strain
(tester) and absent in another (driver). Probes present in 40 to
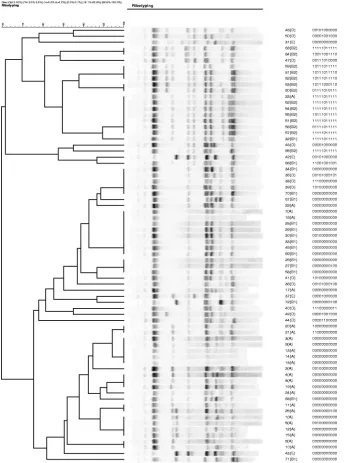
FIG. 2. AR analysis of 72 strains from the
E. coli
reference collection (ECOR). The clustering dendrogram was constructed using AR data.
PHAT signatures are shown adjacent to the ECOR strain names and phylogenetic groups.
V
OL. 45, 2007
PROBE HYBRIDIZATION ARRAY TYPING
209
on May 16, 2020 by guest
http://jcm.asm.org/
60% of a preliminary sample of rectal
E. coli
strains from
different study populations were considered candidates for
PHAT typing, since these provide maximum discriminatory
information between strains.
We did a pairwise comparison of the association between
the prevalences of each probe in the rectal
E. coli
sample and
all possible combinations of probes. If the association (as
es-timated by the odds ratio) between two probes exceeded 1.8
and was statistically significant by the chi-square test, the one
with the higher prevalence was selected for inclusion in order
to reduce redundancy among the probes selected for PHAT
typing (data not shown). The final list of candidate probes is
shown in Table 1.
[image:5.585.135.463.67.568.2]Comparison of phylogenetic groupings based on PHAT,
PFGE typing, ERIC-PCR typing, and AR.
Thirty-three rectal
strains from otherwise healthy women with UTI were typed by
using PFGE (Fig. 1). We identified 25 pulsotypes (groups by
PFGE) using 85% similarity as the cut-point. Note that some
strains that are
⬎
90% similar by PFGE; for example, 88F62
and 324F63, the third and fourth strains from the top, have a
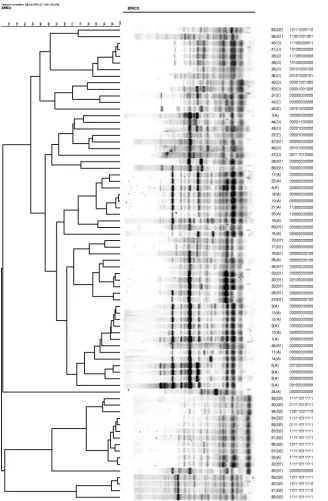
FIG. 3. ERIC-PCR analysis of 72 strains from the
E. coli
reference collection (ECOR). The clustering dendrogram was constructed using
ERIC-PCR data. PHAT signatures are shown adjacent to the ECOR strain names and phylogenetic groups.
on May 16, 2020 by guest
http://jcm.asm.org/
single probe difference in PHAT signature. In contrast, 6F62
(fifth from the bottom of the dendrogram) has a PHAT type
identical to that of 88F62, although it is considered quite
dis-tant from 88F62 by PFGE. The 72 ECOR strains were also
typed by AR and ERIC-PCR (Fig. 2 and 3) and clustered
based on their AR and ERIC-PCR types, respectively. A
num-ber of strains that were grouped similarly by PHAT and AR
had the least resolved PHAT signature (00000000000). ERIC
typing gave similar results; for example, ECOR strains 30 and
5, which are only one probe different by PHAT (00100000000),
were determined to be more distant by ERIC (
⬍
70%
similar-ity), whereas, in contrast, ECOR strains 20 and 21 are only one
probe different by PHAT (11000000000 and 10000000000) and
⬎
90% similar by ERIC.
Discriminatory power of PHAT compared to those of MLST,
AR, ERIC-PCR typing, and PFGE typing.
We compared the
discriminatory power of PHAT to those of MLST, automatic
ribotyping, ERIC-PCR, and PFGE, as expressed by the
Simp-son diversity index (Table 2). In the set of 33 human rectal
strains that we examined, the discriminatory power of PHAT
equaled that of MLST and PFGE (98%). PHAT typed the 33
rectal strains into 26 groups, while MLST and PFGE typed
them into 25 and 26 groups, respectively (shown in Fig. 1). In
the ECOR collection, which is a diverse set of
E. coli
strains
from humans and nonhuman sources, PHAT was less
discrim-inating than MLST, AR, and ERIC-PCR (80% versus 97, 92,
and 97%, respectively). Since the PHAT probe set was
iden-tified from human
E. coli
, we reasoned that the lower
discrim-ination resulted from the nonhuman strains found in ECOR.
To test this hypothesis, we calculated Simpson’s diversity index
[image:6.585.303.542.68.368.2] [image:6.585.42.284.109.258.2]for ECOR strains belonging to B2 and D phylogenic groups, a
lineage found frequently in human pathogenic
E. coli
(31). For
this subset, PHAT had a discriminatory power similar to that
of MLST (94% versus 95%). Figure 4 shows the PHAT typing
of ECOR strains belonging to the B2 and D phylogenetic
FIG. 4. PHAT analysis of 26 strains from the
E. coli
reference
collection (ECOR) belonging to B2/D phylogenetic groups. The
clus-tering dendrogram was constructed using PHAT signatures. MLST
types are shown adjacent to the PHAT signatures.
[image:6.585.310.529.513.705.2]FIG. 5. Statistical entropy by number of probes used in PHAT in a
collection of 106 rectal strains.
TABLE 2. Discriminatory power of PHAT, a binary typing method,
compared to other genotyping techniques among the
E. coli
reference
collection (ECOR) and a collection of human rectal isolates
as determined by using Simpson’s diversity index
Collection (n)a Typing
method
Simpson diversity index (D)b
No. of groups
Avg no. of strains/group
ECOR
c(72)
PHAT
80
25
3.1
MLST
97
42
1.5
AR
92
36
2.0
ERIC-PCR
97
43
1.6
ECOR isolates
PHAT
94
17
1.4
of B2 and D
MLST
95
18
1.4
lineage (26)
Rectal
d(33)
MLST
98
25
1.3
PFGE
98
26
1.2
PHAT
98
26
1.2
a
n, number of strains in the study.
b
The Simpson’s diversity index (D) was calculated as
D⫽1⫺N共N1⫺1兲
冘
j⫽1 s
nj共nj⫺1兲
whereNis the total number of strains in the sample population,sis the total number of types described, andnjis the number of strains belonging to thejth
type (6).
cECOR is a collection of 72 strains isolated from a variety of hosts and
geographical locations (http://foodsafe.msu.edu/Whittam/ecor/). MLST data for ECOR isolates were obtained from www.mlst.net.
dThe rectal strains were randomly selected fromE. colicollected from women
aged 18 to 39 years with a first UTI, collected from the student health services of the University of Michigan.
V
OL. 45, 2007
PROBE HYBRIDIZATION ARRAY TYPING
211
on May 16, 2020 by guest
http://jcm.asm.org/
groups, along with their MLST sequence types. PHAT was
able to subtype strains of the B2/D group with a similar or the
same ST in some cases, as seen in clusters A, B and C. In
contrast, PHAT grouped strains with the same or similar STs
into one group, as seen in clusters C and D in Fig. 4.
Statistical entropy calculations.
We determined the
rela-tionship between statistical entropy and the number of probes
added for PHAT for the set of 106 rectal strains (Fig. 5). In
Fig. 5, the probes were added in the order shown in Table 1. As
the number of probes is increased, there is an initial linear gain
in statistical entropy, followed by a gradual plateau. The
change in entropy parallels the change in the Simpson’s
diver-sity index. Changing the order of probes resulted in a change in
the calculated statistical entropy for each probe added but did
not change the maximum entropy (data not shown). We
ob-served a similar pattern when we repeated this calculation for
PHAT of ECOR strains. For both the B2/D subset of ECOR
strains and the rectal test set, entropy starts to level off around
the fourth probe (diversity index values of 85 and 72% for the
ECOR and rectal strains, respectively), indicating that the
ad-dition of further probes from this set will not substantially
increase the discriminatory power.
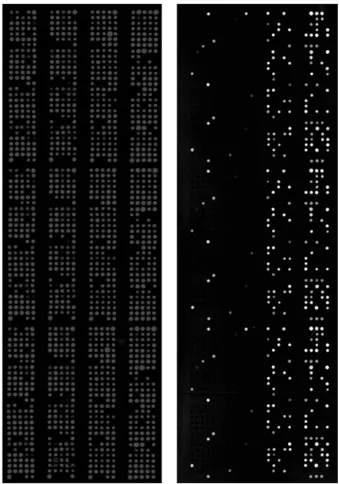
[image:7.585.122.461.67.551.2]LOS microarray hybridizations.
To demonstrate the potential
of using PHAT in a high-throughput format, we used PHAT
FIG. 6. PHAT in an LOS microarray format.
on May 16, 2020 by guest
http://jcm.asm.org/
probe sJX206 and housekeeping gene probe 16S RNA on
repli-cate spots of ECOR (
n
⫽
72) and rectal (
n
⫽
106) strains using
the LOS microarray format for DNA-DNA hybridizations (Fig. 6).
The right side of the slide is arrayed with ECOR and rectal
strains in randomized order. The spot intensities for the
sJX206 probe were normalized to the 16S RNA probe to
account for differences in DNA concentrations. These
inten-sities were further normalized to the positive control (CFT073)
to determine sJX206-positive and -negative strains. The
nor-malized signal intensities for all strains are plotted between
slides to determine probe-positive and probe-negative strains
according to a previously published protocol (32).
DISCUSSION
PHAT, a binary typing method, offers a high-throughput
alternative for bacterial strain typing. PHAT is based on using
multiple genes as genetic markers, making it particularly
suit-able for determining relatedness between strains. On a set of
33 human
E. coli
strains, PHAT and MLST demonstrated
similar discriminatory powers (Simpson’s diversity index of
98%). By carefully selecting for probes, a high degree of
dis-criminatory power can be obtained using a relatively small set
of probes.
Sequence-based methods such as MLST use the variation
within housekeeping loci to determine evolutionary
related-ness within strains. Sequence variation in housekeeping genes
is more likely to reflect phylogenetic descent than genes whose
products are under selection. Thus, MLST is suitable for
es-tablishing evolutionary patterns in long-term global studies but
less so for discriminating closely related strains (6) or strains
involved in pathogenesis and antibiotic resistance. As for
Strep-tococcus pneumoniae
, invasive disease is rare for
E. coli
com-pared to the frequency of asymptomatic colonization, and
MLST genotypes do not always correlate with virulence
poten-tial (5). Furthermore, even for MLST, the level of
discrimina-tion depends on the number of loci and the degree of allelic
variation present in the population (6). For example, MLST
lacks the discriminatory power required to distinguish between
pathogenic strains of
Listeria monocytogenes
; in a recent study,
more rapidly evolving virulence-associated genes were used to
increase discriminatory power (34). Supplementing MLST by
including sequence variation in multiple hypervariable loci also
increases the discriminatory power of MLST (7, 20). In PHAT,
many strains are screened for a few genes, and all strains are
scored as 0/1 for each of the genes tested. By expanding the
number of probes in the PHAT probe set, the discriminatory
power of PHAT can be optimized to differentiate closely
re-lated strains.
PHAT resolution was at least as good as PFGE when we
compared human rectal strains typed by both methods.
How-ever, the classifications of strains were different by the two
systems. Strains that were determined to be similar by PFGE
were not always classified in the same PHAT group and vice
versa. Thus, the underlying genetic differences in the
E. coli
strains revealed by PHAT and PFGE are different. This is of
critical importance in deciding which typing method to use. For
example, integration of horizontally acquired genes will result
in a change in the banding pattern obtained from PFGE but
will be less likely to change the PHAT type, unless one or more
of the newly integrated genes are included in the PHAT probe
set. Analyzing the differences between closely related PHAT
types provides more information about the genetic basis of
differences between two strains than does PFGE; for example,
we can determine whether strains are related by the loss or
gain of mobile genetic element such as one conferring
antimi-crobial resistance.
A challenge of binary typing is determining the best
candi-date probe set to get maximum discriminatory power using the
least number of probes. The minimum probe set is a function
of the study population. For example, the PHAT probes in the
present study were developed for human strains of
E. coli
. In
that population discrimination was excellent (D
⫽
94%);
how-ever, in the ECOR collection, which consists of
E. coli
strains
from different organisms, serotypes, geographic regions, and
phylogeny, discrimination was less (D
⫽
80%). Adding
addi-tional probes specific to the diverse species found in ECOR
would undoubtedly increase the discriminatory power for
PHAT in ECOR.
The discriminatory power observed with PHAT is also
in-fluenced by the number of strains to be typed. In theory, an
array consisting of ‘
n
’ probes can result in 2
nsignatures, but the
number of strains and the nature of probes will dictate the
actual number of observed signatures. As the number of strains
increases, more “unique” PHAT signatures get populated,
re-sulting in a bigger increase in discriminatory power. To
maxi-mize the discriminatory power attainable for a larger set of
strains, additional probes may be added. The choice of probes
is critical to increasing the discriminatory power of PHAT.
Probes that appear frequently across strains in a small study
and contribute minimally to the discriminatory power of
PHAT may still prove to be useful in a more global
epidemi-ologic setting. An analogy can be found in the
coa
and
spa
typing of methicillin-resistant
S. aureus
strains, where the less
discriminating
coa
typing reveals the relatedness of clonal
groups of methicillin-resistant
S. aureus
strains from
tempo-rally and geographically diverse locations (21).
Optimal PHAT probes provide unambiguous results (32).
Some probes have a high degree of nonspecific binding and
background signal, probably due to the degree of sequence
homology with other ORFs. In such cases, probe-positive and
probe-negative strains are hard to determine accurately; we
excluded such probes from our PHAT set. One of the sPCR
fragments initially included, sRB33, was later replaced due to
high levels of cross-hybridization with other strains.
In conclusion, binary typing for bacterial strain classification,
such as PHAT, provides a high-resolution, direct method that
measures the presence or absence of genetic content, and the
binary output can be easily formatted in large databases,
allowing for data storage and portability. PHAT is a
reproduc-ible, cost-effective, and time-effective means for fine
discrimi-nation and for identifying short-term outbreaks and
person-to-person transmission. Since PHAT relies on the presence or
absence of genes determined by dot blot hybridization, it can
be easily adapted to a high-throughput LOS microarray format
wherein thousands of strains can be typed simultaneously (33).
The efficiency gained through the implementation of the
mi-croarray dramatically increases the efficiency of the typing
pro-cess, reducing the cost and time required to type large numbers
of strains. When hypervariable loci are used as probes, PHAT
V
OL. 45, 2007
PROBE HYBRIDIZATION ARRAY TYPING
213
on May 16, 2020 by guest
http://jcm.asm.org/
complements the basic clonal assignments at a population level
from MLST (1, 2). In the long term, PHAT in conjunction with
MLST may lead to a more complete picture of strain variations
within the context of a slowly evolving core genome.
ACKNOWLEDGMENTS
We thank Patricia Tallman and Joan DeBusscher for the isolation
and purification of
E. coli
strains and Richard Bauer for sRB19. We
also thank Brian DeHaven for assisting with dot blot hybridizations,
Sarah Jaden for providing the distribution data for probe sSU32, and
Maneesh Dave for help with the MLST analysis.
This study was supported by an award from the National Institutes
of Health (grant RO1 DK55496 to C.F.M.).
REFERENCES
1.Achtman, M.2002. A phylogenetic perspective on molecular epidemiology, vol. 1. Academic Press, London, England.
2.Achtman, M., and G. Pluschke.1986. Clonal analysis of descent and viru-lence among selectedEscherichia coli. Annu. Rev. Microbiol.40:185–210. 3.Bauer, R. J. 2003. Molecular epidemiologic discovery of uropathogenic
Escherichia colivirulence and transmission factors. Ph.D. thesis. University of Michigan, Ann Arbor.
4.Bauer, R. J., L. Zhang, B. Foxman, A. Siitonen, M. E. Jantunen, H. Saxen, and C. F. Marrs.1521. Molecular epidemiology of three putative virulence genes forEscherichia coliurinary tract infection—usp,iha, andiroN(E. coli). J. Infect. Dis.185:1521–1524.
5.Brueggemann, A. B., D. T. Griffiths, E. Meats, T. Peto, D. W. Crook, and B. G. Spratt.2003. Clonal relationships between invasive and carriage Strep-tococcus pneumoniaeand serotype- and clone-specific differences in invasive disease potential. J. Infect. Dis.187:1424–1432.
6.Cooper, J. E., and E. J. Feil.2004. Multilocus sequence typing—what is resolved? Trends Microbiol.12:373–377.
7.Feavers, I. M., S. J. Gray, R. Urwin, J. E. Russell, J. A. Bygraves, E. B. Kaczmarski, and M. C. Maiden.1999. Multilocus sequence typing and an-tigen gene sequencing in the investigation of a meningococcal disease out-break. J. Clin. Microbiol.37:3883–3887.
8.Foxman, B., S. D. Manning, P. Tallman, R. Bauer, L. Zhang, J. S. Koopman, B. Gillespie, J. D. Sobel, and C. F. Marrs.2002. UropathogenicEscherichia coliare more likely than commensalE. colito be shared between hetero-sexual sex partners. Am. J. Epidemiol.156:1133–1140.
9.Foxman, B., L. Zhang, K. Palin, P. Tallman, and C. F. Marrs.1995. Bacterial virulence characteristics ofEscherichia coliisolates from first-time urinary tract infection. J. Infect. Dis.171:1514–1521.
10.Hommais, F., S. Pereira, C. Acquaviva, P. Escobar-Paramo, and E. Denamur.
2005. Single nucleotide polymorphism phylotyping ofEscherichia coli. Appl. Environ. Microbiol.71:4784–4792.
11.Hulton, C. S., C. F. Higgins, and P. M. Sharp.1991. ERIC sequences: a novel family of repetitive elements in the genomes ofEscherichia coli, Sal-monella typhimuriumand other enterobacteria. Mol. Microbiol.5:825–834. 12.Hunter, P. R., and M. A. Gaston.1988. Numerical index of the
discrimina-tory ability of typing systems: an application of Simpson’s index of diversity. J. Clin. Microbiol.26:2465–2466.
13.Leonard, E. E., T. Takata, M. J. Blaser, S. Falkow, L. S. Tompkins, and E. C. Gaynor.2003. Use of an open-reading frame-specificCampylobacter jejuni DNA microarray as a new genotyping tool for studying epidemiologically related isolates. J. Infect. Dis.187:691–694.
14.Maiden, M. C., J. A. Bygraves, E. Feil, G. Morelli, J. E. Russell, R. Urwin, Q. Zhang, J. Zhou, K. Zurth, D. A. Caugant, I. M. Feavers, M. Achtman, and B. G. Spratt.1998. Multilocus sequence typing: a portable approach to the identification of clones within populations of pathogenic microorganisms. Proc. Natl. Acad. Sci. USA95:3140–3145.
15.Marrs, C. F., L. Zhang, P. Tallman, S. D. Manning, P. Somsel, P. Raz, R. Colodner, M. E. Jantunen, A. Siitonen, H. Saxen, and B. Foxman.2002. Variations in 10 putative uropathogen virulence genes among urinary, faecal, and peri-urethralEscherichia coli. J. Med. Microbiol.51:138–142.
16.Meacham, K. J., L. Zhang, B. Foxman, R. J. Bauer, and C. F. Marrs.2003. Evaluation of genotyping large numbers ofEscherichia coliisolates by en-terobacterial repetitive intergenic consensus-PCR. J. Clin. Microbiol. 41:
5224–5226.
17.Olive, D. M., and P. Bean.1999. Principles and applications of methods for DNA-based typing of microbial organisms. J. Clin. Microbiol.37:1661–1669. 18.Pelludat, C., R. Prager, H. Tschape, W. Rabsch, J. Schuchhardt, and W. D. Hardt.2005. Pilot study to evaluate microarray hybridization as a tool for Salmonella entericaserovar Typhimurium strain differentiation. J. Clin. Mi-crobiol.43:4092–4106.
19.Pettigrew, M. M., B. Foxman, Z. Ecevit, C. F. Marrs, and J. Gilsdorf.2002. Use of pulsed-field gel electrophoresis, enterobacterial repetitive intergenic consensus typing, and automated ribotyping to assess genomic variability among strains of nontypeableHaemophilus influenzae. J. Clin. Microbiol.
40:660–662.
20.Robinson, D. A., and M. C. Enright.2003. Evolutionary models of the emergence of methicillin-resistantStaphylococcus aureus. Antimicrob. Agents Chemother.47:3926–3934.
21.Shopsin, B., M. Gomez, M. Waddington, M. Riehman, and B. N. Kreiswirth.
2000. Use of coagulase gene (coa) repeat region nucleotide sequences for typing of methicillin-resistantStaphylococcus aureusstrains. J. Clin. Micro-biol.38:3453–3456.
22.Shumei, J., C. Tang, L. Zhang, A. Zhang, and M. Ramanathan.2000. First SIAM International conference on data mining. http://www.cs.buffalo.edu /pub/WWW/DBGROUP/bioinformatics/papers/MaxEnt.pdf.
23.Srinivasan, U., B. Foxman, and C. F. Marrs.2003. Identification of a gene encoding heat-resistant agglutinin inEscherichia colias a putative virulence factor in urinary tract infection. J. Clin. Microbiol.41:285–289.
24.Tenover, F. C., R. D. Arbeit, R. V. Goering, P. A. Mickelsen, B. E. Murray, D. H. Persing, and B. Swaminathan.1995. Interpreting chromosomal DNA restriction patterns produced by pulsed-field gel electrophoresis: criteria for bacterial strain typing. J. Clin. Microbiol.33:2233–2239.
25.van Leeuwen, W., A. van Belkum, B. Kreiswirth, and H. Verbrugh.1998. Genetic diversification of methicillin-resistantStaphylococcus aureusas a function of prolonged geographic dissemination and as measured by binary typing and other genotyping methods. Res. Microbiol. 149:497–507. (Erratum,149:775.)
26.van Leeuwen, W., H. Verbrugh, J. van der Velden, N. van Leeuwen, M. Heck, and A. van Belkum.1999. Validation of binary typing forStaphylococcus aureusstrains. J. Clin. Microbiol.37:664–674.
27.Vogel, L., E. van Oorschot, H. M. Maas, M. B., and L. Dijkshoorn.2000. Epidemiologic typing ofEscherichia coliusing RAPD analysis, ribotyping and serotyping. Clin. Microbiol. Infect.6:82–87.
28.Xie, J., B. Foxman, L. Zhang, and C. F. Marrs.2006. Molecular epidemio-logic identification ofEscherichia coligenes that are potentially involved in movement of the organism from the intestinal tract to the vagina and blad-der. J. Clin. Microbiol.44:2434–2441.
29.Zadoks, R., W. van Leeuwen, H. Barkema, O. Sampimon, H. Verbrugh, Y. H. Schukken, and A. van Belkum.2000. Application of pulsed-field gel electro-phoresis and binary typing as tools in veterinary clinical microbiology and molecular epidemiologic analysis of bovine and human Staphylococcus aureusisolates. J. Clin. Microbiol.38:1931–1939.
30.Zhang, L., B. Foxman, S. D. Manning, P. Tallman, and C. F. Marrs.2000. Molecular epidemiologic approaches to urinary tract infection gene discov-ery in uropathogenicEscherichia coli. Infect. Immun.68:2009–2015. 31.Zhang, L., B. Foxman, and C. Marrs.2002. Both urinary and rectal
Esche-richia coliisolates are dominated by strains of phylogenetic group B2. J. Clin. Microbiol.40:3951–3955.
32.Zhang, L., B. W. Gillespie, C. F. Marrs, and B. Foxman.2001. Optimization of a fluorescent-based phosphor imaging dot blot DNA hybridization assay to assessEscherichia coli virulence gene profiles. J. Microbiol. Methods
44:225–233.
33.Zhang, L., U. Srinivasan, C. F. Marrs, D. Ghosh, J. R. Gilsdorf, and B. Foxman.2004. Library on a slide for bacterial comparative genomics. BMC Microbiol.4:22.
34.Zhang, W., B. M. Jayarao, and S. J. Knabel.2004. Multi-virulence-locus sequence typing ofListeria monocytogenes. Appl. Environ. Microbiol.70:
913–920.