M E T H O D
Open Access
Cancer progression modeling using static
sample data
Yijun Sun
1,2* †, Jin Yao
3†, Norma J Nowak
4and Steve Goodison
5* †Abstract
As molecular profiling data continue to accumulate, the design of integrative computational analyses that can provide insights into the dynamic aspects of cancer progression becomes feasible. Here, we present a novel computational method for the construction of cancer progression models based on the analysis of static tumor samples. We demonstrate the reliability of the method with simulated data, and describe the application to breast cancer data. Our findings support a linear, branching model for breast cancer progression. An interactive model facilitates the identification of key molecular events in the advance of disease to malignancy.
Background
Human cancer is a dynamic disease that develops over an extended time period through the accumulation of a series of genetic alterations. Once initiated, the advance to malignancy can to some extent be considered a Darwinian process (a multistep evolutionary process) that responds to selective pressure [1-5]. While the major-ity of genetic alterations confer no growth advantage, tumor cells that acquire mutations in genes that con-trol key cellular processes can overwhelm less vigorous cell populations within the tumor mass, and this pro-cess continues through a series of clonal expansions that result in tumor persistence and growth, and ultimately the ability to invade surrounding tissues and metastasize to distant organs. The delineation of this dynamic pro-cess and the identification of pivotal molecular events that drive stepwise progression to malignancy would provide a critical foundation and guide for the devel-opment of cancer diagnostics, prognostics and targeted therapeutics.
The assembly of time-series data collected through repeated sampling across an entire disease process would provide essential information for the elucidation of system
*Correspondence: [email protected]; [email protected] †Equal contributors
1Department of Microbiology and Immunology, Department of Computer Science and Engineering, Department of Biostatistics, University at Buffalo, The State University of New York, Buffalo, NY 14201, USA
5Department of Health Sciences Research, Mayo Clinic, Jacksonville, FL 32224, USA
Full list of author information is available at the end of the article
dynamics and disease-associated genetic regulation [6], and recent advances in genomic technologies has made it possible to study cancer genomes at a scale and cost that allow the design of such studies [7,8]. However, due to the need for immediate treatment upon diagnosis, it is ethically infeasible to collect time-series data to study dis-ease progression. An alternative is animal studies where time-series data could be obtained, but the extrapolation of animal data to human disease is not always appropriate. Moreover, the development of spontaneous human can-cer is a process that takes several years, and to overcome the heterogeneous nature of the disease and to mini-mize random effects, a very large number of samples is required, so animal studies are not economically or logis-tically viable in this context. Conversely, due to the high incident rate of cancer, and the clinical care protocols in place in developed countries, a huge number of archived tumor specimens is available. For example, it is estimated that about 250,000 new cases of breast cancer will be diag-nosed in 2014 in the US [9]. Assuming that cancer cells are derived from normal cells, and that a static sample can be regarded as a snapshot of the dynamic cancer process, then we can pose the following question:Is it possible to construct a cancer progression model using data acquired from static samples?
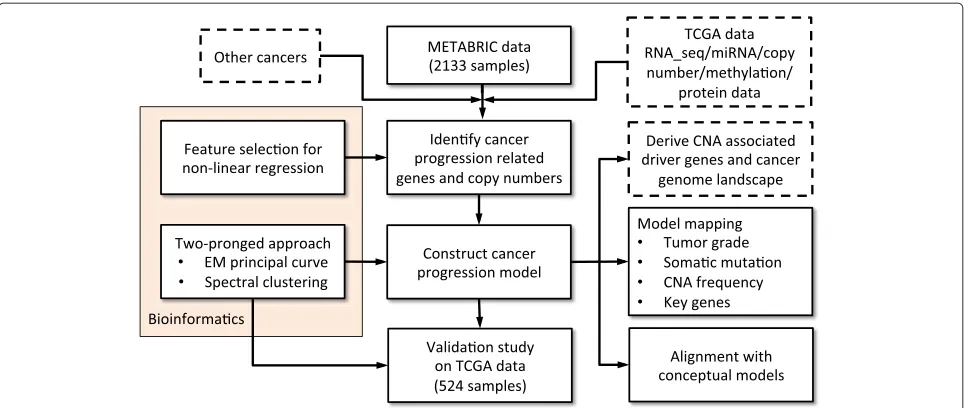
In this paper, we present a proof-of-principle popula-tion study to address the above quespopula-tion. Figure 1 depicts a flowchart of the presented stepwise study. It involves extensive work on algorithm development, computational simulation, disease model construction and validation.
Figure 1Workflow of the stepwise study.The tasks listed in the dashed-line rectangles are possible extensions and applications of the study and are discussed in the text. CNA, copy number alteration; EM, expectation-maximization; miRNA, microRNA; RNA_seq, RNA sequencing; TCGA, The Cancer Genome Atlas.
By analysis of publicly available data, we demonstrated that through the application of advanced computational techniques it is indeed possible to construct a can-cer progression path using massive data obtained from static sampling. Analysis of molecular data from 2,133 breast samples [7] enabled the visualization of high-dimensional data structures that provided a framework for the extrapolation of progressive disease associations and trends across tumor samples. A very similar data structure was revealed through the analysis of an inde-pendent dataset of 524 samples [8], and mapping of copy number alteration (CNA) frequencies, somatic muta-tion rates, tumor grade informamuta-tion, and the expression levels of specific key genes supported the validity of the model. Our analysis, for the first time, showed that while breast cancer is a genetically and clinically het-erogeneous disease, tumor samples are distributed on a low-dimensional data structure manifold, suggesting that genotypes are not hard-wired and can shift over time.
The study provides a framework for the construction of high-resolution cancer progression models that can com-bine all currently available genetic information. Through the visualization of key events in tumor progression, such models can facilitate the identification of pivotal driver genes, improved prognostic stratification systems and potential points of susceptibility for therapeutic interven-tion. Although in this paper we focus on breast cancer, the developed data analysis strategy is equally applicable to model other cancers and other human diseases where the lack of time-series data to study system dynamics is a ubiquitousproblem.
Results and discussion
Bioinformatics pipeline for cancer progression modeling A cancer progression path can be mathematically viewed as a complex manifold with multiple branches embed-ded in a high-dimensional genomic space. Our work-ing hypothesis is as follows: as tumors progress toward advanced stages driven by genetic mutations, each static sample leaves a genetic footprint on the path. If the number of samples is sufficiently large, the footprint infor-mation collectively would enable us to recover the pro-gression path and thereby to reveal key genetic events that drive the dynamic evolution of cancer to malignancy. To verify the hypothesis, we developed a novel data anal-ysis strategy to analyze and integrate molecular profile data into a model of cancer progression, which is detailed below.
Supervised learning approach to identifying cancer progression related genes
into a bad or good prognostic group at a predefined end point (usually 5-year survival or time to metastasis) and then perform feature selection for classification analy-sis [10-12,15,16]. A major drawback to that approach is that patients with survival times slightly longer or shorter than the end point are put into two different groups. To explore the magnitude information of response variables, we proposed to select relevant genes within a regression framework. The idea has been widely used in the statistics and oncology communities. There are a number of excel-lent algorithms exemplified by Lasso [17] and its variants, which operate under a linear-model assumption; however, the dependency between gene expression changes and disease progression is complex and is unlikely to be lin-ear [18]. It is thus more appropriate to formulate it as a feature-selection problem for nonlinear regression. How-ever, due to the difficulties of mathematically describing complex data structures, feature selection for nonlinear regression remains a challenging problem.
We developed a new method to address the aforemen-tioned challenge. It is a natural extension of our previous work on feature selection for high-dimensional classifi-cation problems [19,20]. The basic idea is to decompose a nonlinear regression problem into a set of linear clas-sification problems and learn feature relevance within a large-margin framework. The development of the algo-rithm is based on a key observation that a classification problem can be viewed as a degenerated regression prob-lem. To see this, letD = {(xn,yn)}Nn=1 ∈ RJ ×Rbe a set of training data, wherexnis then-th sample,ynis the corresponding survival time, andJ N. Without loss of generality, we assume thatyn ≥ymifn>m. If we divide the dataset into two subsets at a predefined end point (e.g., 5 years), we end up with a molecular classification problem. As noted above, a major issue with molecular classification is that it ignores the magnitude information of survival times. Then, a natural idea is to partition the data into two parts at multiple end pointsS = {sk}Kk=1. A possible choice issn = (yn−1+yn)/2 for 2 ≤ n ≤ N. We seek to select a feature subset so that the overall clas-sification error of unseen test data computed at all end points is minimized. We give below a detailed mathemat-ical description of the proposed method. For the ease of presentation, at the moment, we only consider samplexn and divide the data into two partsD1 = {xj|yj < sk, 1 ≤ j ≤ N}andD2 = {xj|yj > sk, 1 ≤ j ≤ N} at end point sk. We further assume thatyn > sk. We start by defin-ing a margin forxn. Given a distance function, we find two nearest neighbors forxnfromD1andD2, denoted as NN(D1) and NN(D2), respectively. The margin ofxn is then defined asρn(sk)=d(xn, NN(D1))−d(xn, NN(D2)), whered(·) is a distance function. In this study, we used the block distance to measure the similarity between two samples, which was also used in [19,21]. The above margin
is called the hypothesis margin, and can be interpreted as a measure of how muchxncan be corrupted by noise before being misclassified by a one-nearest-neighbor clas-sifier [22]. By the large margin theory [23,24], a learning algorithm that minimizes a margin-based error function usually generalizes well on unseen test data. Then, a natu-ral idea is to scale each feature, and thus obtain a weighted feature space, parameterized by a nonnegative vectorw, so that a margin-based error function in the induced fea-ture space is minimized. The magnitude of each element ofwreflects the importance of the corresponding feature. The margin ofxn, computed with respect tow, is given byρn(sk|w) = wT(|xn−NN(D1)| − |xn−NN(D2)|)
wTzn(s), where | · | is an element-wise absolute opera-tor. Note thatρn(sk|w)is a linear function ofw, and the margin thus defined requires only information about the neighborhood of xn, while no assumption is made on the underlying data distribution. The above analysis can be repeated for each sample at each end point, leading to the following optimization problem:
min w≥0
N
n=1 K
k=1
I(ρn(sk|w) <0), (1)
where I(·) is the indicator function. Since in the inner summationxnis held out as a test sample, the above for-mulation can be interpreted as finding a feature subspace where the overall leave-one-out cross-validation error is minimized.
The main problem with the above margin definition is that the nearest neighbors of a given sample are unknown before learning. With tens of thousands of irrelevant fea-tures, which is the case in this study, the nearest neighbors defined in the original space can be completely differ-ent from those in the induced space. A possible way to address this issue, proposed by [19], is to use a probabilis-tic model where the nearest neighbor of a given sample is treated as hidden variables. Following the principles of the expectation-maximization (EM) algorithm [25], we estimated the margin by computing the expectation of ρn(sk|w)via averaging out the hidden variables:
¯
ρn(sk|w)=E[ρn(sk|w)]
=wT ⎛
⎝
j∈M1
Q(j|n,w)|xn−xj|
−
j∈M2
P(j|n,w)|xn−xj| ⎞
⎠wTzn(k),
(2)
inD1andD2with respect tow, respectively. The proba-bilitiesQ(j|n,w)andP(j|n,w)can be estimated using the standard kernel method.
After the margins are defined, the problem of learn-ing feature weights can be solved within the large margin framework [23,24]. Note that the indicator function is non-differentiable and non-convex. A commonly used practice to address this issue is to minimize the upper bound of the cost function. We used the hinge loss, which leads to a support vector machine formulation of feature selection for nonlinear regression:
min w
N
n=1
K
k=1
max0, 1−wTzn(k)
, subject tow1≤λ,w≥0, (3)
where we imposed an1penalty onwto obtain a sparse solution, and λ is a regularization parameter control-ling the sparseness of a solution, which can be estimated through cross-validation.
Note thatznimplicitly depends onwthroughQ(j|n,w) andP(j|n,w). We used a fixed-point recursion method to solve w. First, we made a guess for w, which was used to calculate pairwise distancesd(xi,xj)and probabilities Q(j|n,w)andP(j|n,w). Then, the feature weight vectorw was updated by solving the 1 regularized optimization problem. The two steps were iterated until convergence. We used our recently developed gradient-descent-based algorithm to solve the above optimization problem effi-ciently [26]. By using the fixed-point theory [27], it can be proved that the algorithm converges to a unique solution regardless of the initial weights if the kernel width is prop-erly selected. The detailed mathematical derivations are given in the supplementary data, where we also present a simulation study that demonstrates the effectiveness of the new approach.
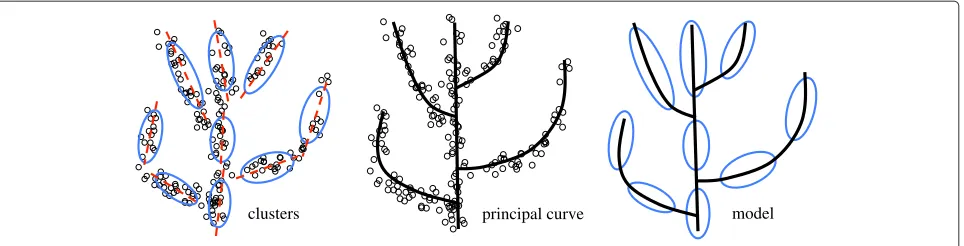
Two-pronged approach to cancer progression modeling After cancer progression related genes are selected, the next step is to build a progression model. Both cancer evo-lution theory and our data visualization analyses (shown below) suggest that a progression path and clonal struc-tures are two sides of the same coin (see Figure two in [1], Figure 2 and Additional file 1: Figure S13). This motivated us to develop a novel two-pronged method for model-ing the cancer progression process. The basic idea is to perform a clustering analysis to detect genetically homo-geneous tumor groups, construct a principal curve to summarize the general trend of data, and finally combine the two results using the principal curve as a backbone to build a model of cancer progression. A toy exam-ple is given in Figure 3, which illustrates the proposed method.
Clustering analysis
Clustering analysis has been intensively studied in the machine learning community. For the purpose of this study, we used spectral clustering. Compared to model-based methods (e.g., K-means), spectral clustering does not explicitly impose a model assumption on data dis-tribution, and thus is able to detect clusters of unknown shapes [28]. Moreover, by making use of the spectrum of the similarity matrix of the data, spectral clustering pro-vides an embedded mechanism of dimensionality reduc-tion, making it particularly suitable for this study to cluster high-dimensional data.
Spectral clustering starts with the generation of a sim-ilarity matrix measuring the relative simsim-ilarity of each pair of samples in the dataset. To this end, we first con-structed a mutualK-nearest-neighbor (KNN) graph based on the profiles of selected genes and copy numbers [28]. On the resulting graph, each vertex represents a sam-ple, and two vertices are connected if the corresponding samples are among the KNNs of each other. Throughout the paper, K was set to 30. We tried different values of K, and they yielded similar results as determined by the normalized mutual information scores [29]. Based on the constructed KNN graph, a similarity matrixSwas gener-ated, where theij-th elementSij=exp(−xi−xj2/(σiσj)) ifxi andxjwere connected and 0 otherwise. Here,σi = xi −x(K)i andx(K)i is theK-th nearest neighbor of xi [30]. Then, a normalized Laplacian matrix was computed asL = D−1/2SD−1/2, whereDis a diagonal matrix with Dii = nj=1Sij, and the eigenvectors of the matrixLwere computed. The number of clusters was determined using the method proposed in [30]. Briefly, for each possible number of clusters C, a rotation matrix that best aligns the columns of the topCeigenvectors with the canonical coordinate system was calculated, and the optimal num-ber of clusters was determined as the one that resulted in the highest alignment quality score. LetU ∈ RN×C be a matrix containing the topCeigenvectors as columns. We formed a new matrixY∈ RN×C fromUby normalizing the rows to norm one [31]. Finally, theK-means analysis was performed to group the samples now represented as the rows of the matrixYintoCclusters.
clusters principal curve model
Figure 3A toy example illustrating the proposed two-pronged approach.
in different clusters. A cluster with an average silhouette width>0 is considered stable.
Principal curve
We used a principal curve to describe the general trend of the data. Mathematically, a principal curve is a smooth curve going through the center of a data cloud [33,34]. A toy example is presented in Figure 3. This concept was first proposed by [33] as a generalization of the first prin-cipal component line and required a curve not to intersect itself, which is too restrictive for our application. Pre-sumably, a cancer progression path is a high-dimensional manifold with multiple branches. Although a dozen algo-rithms have been developed in the past two decades, there is currently no method that can be used effectively to extract a self-intersected curve embedded in a high-dimensional space (see [35] for an excellent review). For the purpose of this study, we developed a new method that addressed some limitations of existing approaches.
We start by describing a probabilistic model respon-sible for generating a set of random observations D = {xn}Nn=1 ∈ RM. We assume that each sample is gener-ated from an unknown curve in a two-step process. First, a pointμsis randomly selected from the curve according to a probability density function p(s), and then a sam-ple xis generated from μs corrupted by Gaussian noise N(x|μs,s), wheresis a covariance matrix andstakes a value from a set. We herein do not specify any form for to reflect the fact that the curve may contain branching structures. Due to the extremely high data dimensional-ity (M = 1, 140), it is numerically unstable to estimate full covariance matrices. We thus used a simple heuris-tic by assumings = σ2I, whereIis an identity matrix. Although we may lose some resolution, the simplification can lead to a numerically stable estimation and worked well for our study. Note that the data generalization mech-anism is similar to that assumed in Gaussian mixture modeling [36], with the latter using a set of discrete data points placed at the centers of clusters, instead of a curve, to represent the data. Therefore, principal curve fitting
can be viewed as a natural extension of Gaussian mixture modeling.
Let θ be the parameters {μs,p(s)}s∈ and σ that we aim to estimate. The log-likelihood function of the data is given by
L(D|θ)= N
n=1 log
s∈
N(xn|μs,σ2I)p(s)ds. (4)
The parameters can be estimated by maximizing the log-likelihood function using the EM algorithm [25]. A major issue with the maximum likelihood (ML) estima-tion is that it is an ill-posed problem and can lead to severe over-fitting [34,36]. Specifically, when σ goes to zero, the log-likelihood achieves the maximum value of infinity, resulting in a trivial solution where the obtained curve goes through every data point. One possible remedy for the problem is to add a regularization term to the log-likelihood function to encourage curve smoothness [34]. This strategy, however, works only for simple cases where a curve is not self-intersected. Moreover, it is difficult to determine the regularization parameter used to control the trade-off between data fitting and curve smoothness. It has been shown that cross-validation is not a viable method for controlling the complexity of principal curve estimates [37].
problem now becomes how to estimate the optimal num-ber of segments, which is similar to that of estimating the number of clusters in Gaussian mixture modeling. There is a large body of work on this topic in the clus-tering literature [36,38,39]. In this study, we used the elbow method [39] for parameter estimation. Additional file 2: Figure S9 shows the curve fitting error measured as the sum of squared distances between data points and their corresponding closest points on a curve versus the curve length. The fitting error decreases monotoni-cally as the curve length increases, but at a certain point the decrease flattens markedly. To perform the estima-tion automatically, we fitted a regression model consisting of two lines to the two arms of the elbow curve and estimated the data variance as the one that generated a curve with a length equal to that at the intersection of the two lines (Additional file 2: Figures S9, S10 and S11). A detailed mathematical derivation is given in the sup-plementary data, where we also present a discussion of some implementation issues and a simulation study that demonstrated the effectiveness of the proposed method.
The developed bioinformatics pipeline also contains some standard statistical techniques, including principal component analysis (PCA), survival data analysis, poly-nomial curving fitting and hypothesis testing. We refer the reader to [40,41] for detailed descriptions. The core algorithms of the proposed bioinformatics pipeline are available upon request.
Breast cancer progression modeling
Identification of breast cancer related genes and data visualization
We demonstrated the utility of the developed bioinfor-matics pipeline by applying it to a large-scale breast cancer dataset generated by the METABRIC project [7]. The dataset contains the expression levels of 25,160 genes and copy number data of 30,566 genes from 1,989 tumor samples, and has clinical follow-up data ranging from 0 to 25 yearsa. Molecular profiles were obtained from surgically excised primary breast tumors. The major-ity of estrogen receptor (ER)-positive/lymph node (LN)-negative patients did not receive chemotherapy, whereas ER−/LN+ patients did. Additionally, none of the HER2+ patients received trastuzumab. As such, the treatments were homogeneous with respect to clinically relevant groups. The dataset also contains the gene expression data of 144 normal breast tissue samples. To minimize the confounding factor of censoring in selecting rele-vant features, we removed 845 samples from the tumor-bearing cohort that had clinical follow-up data of less than 10 years in the feature-selection analysis. Gene expres-sion and copy number data of each sample were then stacked together to form a high-dimensional vector, and robust linear scaling [42] was performed on each feature
so that the 2% and 98% quantiles were set to 0 and 1, respectively. As such, all features were comparable and outlier data were removed. We then applied our new feature-selection method (described above) to identify genes associated with cancer progression. Due to the use of an 1 regulation on feature weights (see Equation 3), the method offers an embedded mechanism to remove irrelevant and redundant features by assigning them zero weights. In this study, features with weights larger than 10−3 were selected for the downstream analysis. Using the regularization parameter estimated through tenfold cross-validation, the analysis identified a total of 1,140 features including 989 genes selected from differ-ential mRNA expression data and 151 genes from copy number data.
the theory is valid, a cancer progression tree would consist of a series of connected, bifurcating clusters, and this is what the PCA and KNN graphs illustrate.
Construction of a breast cancer progression model
The data visualization analysis provided an overview of data distribution, and informed the design of the novel two-pronged method used to model the cancer progres-sion process formally. Application of the spectral clus-tering method [28] to the METABRIC data revealed 13 distinct clusters (Figure 4A). To promote a robust cluster-ing assignment, a resamplcluster-ing-based consensus clustercluster-ing analysis [32] was performed. From the generated consen-sus matrix shown in Figure 4B, we can clearly identify 13 diagonal blocks, which suggests that the clustering assign-ment is very stable. This result was further confirmed by silhouette width analysis. The clustering analysis clas-sified 1,900 out of 1,989 (96%) samples with a positive silhouette width and yielded an average silhouette width of 0.47 (Figure 4C). Cluster 11 contains only three samples and thus was omitted in downstream analyses. The second step was to extract a principal curve to define mathe-matically the general trend of the data. To overcome the difficulty of extracting a self-intersected curve embedded in a high-dimensional space, we applied our new princi-pal curve method (described above). The parameter was estimated using the elbow method [39] (Additional file 2: Figure S11). Finally, we combined the clustering and prin-cipal curve results using the prinprin-cipal curve as a backbone
to build a breast cancer progression trajectory (Figure 5). Each node on the figure represents an identified cluster and the node size is proportional to the number of sam-ples in the corresponding cluster. Two connected nodes indicate a possible inter-relationship, and the length of an edge connecting two nodes is proportional to the dis-tance between the centers of the two nodes. We note that the overall structure of the model is consistent with the results of our data visualization analysis, suggesting that the constructed model faithfully reflects the data distribution.
Our analytical approach revealed a linear, bifurcating structure within the METABRIC dataset. There appear to be two major paths from tumor initiation to malig-nancy. Intuitively, both paths transition through normal and normal-like tumor phenotypes towards the luminal subtypes. The linear path continues through luminal A and luminal B phenotypes but then bifurcating paths lead from luminal B to either the basal or HER2+ pheno-types (Figure 5A). No evidence for a significant inter-relationship between basal and HER2+ phenotypes was revealed. Beyond the links denoting the major two path-ways, we also observe a number of minor side branches. In one case, cluster 9 (normal-like enriched) has a path going directly to cluster 10 (basal enriched) (Figure 5A). Although a small cluster, this suggests that short-cuts to the most malignant phenotypes are possible. Other minor branches emanate from the luminal A node. These rep-resent subdivisions of the major cluster 6 and are in line
silhouette width
2 4 6 8 10 12 14 16 18 20 0.93
0.95 0.97 0.99
Number of clusters
Allignment score
A
C
B
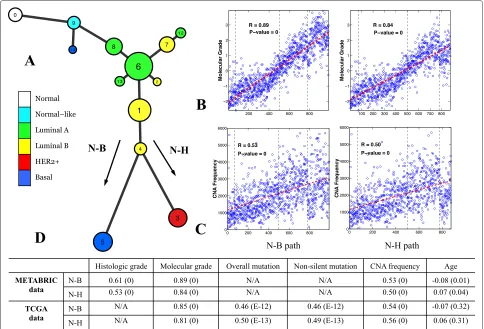
[image:8.595.57.539.461.691.2]Figure 5Model constructed using the METABRIC dataset and its association with clinical and genetic variables.(A)Breast cancer progression tree. Each node represents a cluster and the node size is proportional to the number of samples in the corresponding cluster. Nodes are color-coded based on the PAM50 labels of the majority of the samples in the node.(B,C)Molecular grade and CNA frequency were highly correlated with the N-B (first column) and N-H (second column) progression branches.(D)Spearman’s rank correlation analysis of histological grade, molecular grade, mutation rate and patient age with the two main progression paths. The numbers in parenthesis arePvalues. CNA, copy number alteration; N-B, normal through luminal to basal phenotype; N-H, normal through luminal to HER2+ phenotype; TCGA, The Cancer Genome Atlas.
with the finding that the luminal subtypes are genetically heterogeneous and may have multiple subtypes within them [46,47]. It is tempting to speculate what these minor clusters represent biologically given that the paths appear to be dead ends in an evolutionary context. Perhaps, they represent tumor subtypes that remain dormant or are very slow growing, but this requires further investigation experimentally.
Survival data analysis
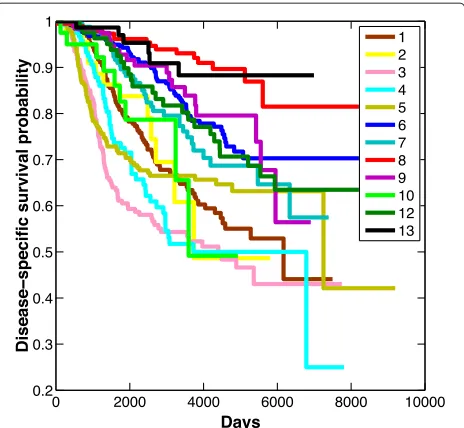
To examine the relationship between clinical outcome and the groups on the two major paths to malignancy, we used the Kaplan–Meier method [48] to plot overall sur-vival (OS). Figure 6 illustrates a clear trend of worsening survival function associated with progression along the major trajectory through luminal types to basal or HER2+ tumors (cluster 8 through cluster 6, and cluster 1 to either cluster 3 or 5). As would be expected, each cluster, or node, on this linear path generally had a worse OS index
Figure 6Overall survival of 12 breast cancer subgroups detected in the METABRIC data.Cluster 11 contained only three samples and so was omitted.
at the bifurcation point on the linear model. The OS func-tion for cluster 4 is similar to that for the basal and HER2+ tumors early on, and continues to mimic HER2+ through-out the survival analysis. This implies that pivotal gene activities associated with outcome are acquired at this stage prior to final commitment to a basal or a HER2+ phenotype.
It is worth remembering here that the PAM50 labels were only added to the model after construction to aid in visualization and to help to put the model into context by referral to previous breast cancer classification systems [43]. The analytical approach used in this study identi-fied 13 clusters and revealed associations between them based on statistical significance without any pre-labeling process. Thus, the labels are somewhat misleading and, as shown by the continued subdivision of PAM50 subtypes [46,47,51], do not represent the full complexity of the data structures within tumor tissue molecular profiles. PAM50 labeling works well for the HER2+ and the basal types (clusters 3 and 5 respectively) where the majority of sam-ples in the cluster fit that classification system, but even in these clusters there are admixtures of what would be labeled as basal or HER2+ samples. For the side-branch clusters, the PAM50 admixtures are more pronounced (Additional file 1: Figure S14), nonetheless, the color-coding to some extent aids the visualization of the two major pathways to malignancy in the progression model. If confirmed in independent cohorts, identification of the genetic changes associated with the interconnected clusters revealed in this study may facilitate the refine-ment of disease classification systems.
As there is currently no established breast cancer pro-gression model for direct comparison, it is important to consider ways to demonstrate the validity of the con-structed model. The following sections describe a series of interrogations that provide support for the proposed model and show the utility of such a model for testing and generating hypotheses and providing novel insights. The model revealed two major progression paths; these will be referred to as N-B (normal through luminal to basal phenotype), and N-H (normal through luminal to HER2+ phenotype) in downstream analyses.
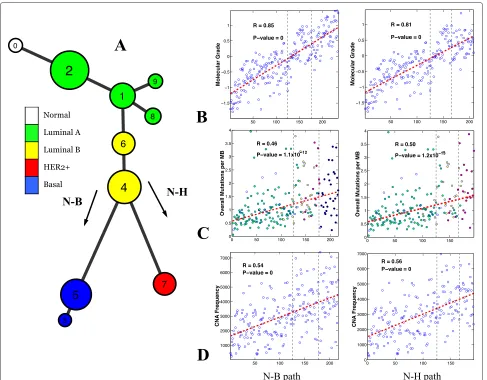
Figure 7Model constructed using the TCGA dataset and its association with clinical and genetic variables.(A)Breast cancer progression tree. There were only eight normal-like samples and no distinct cluster was identified. The bifurcation structure and the order of the molecular subtypes are almost identical to those observed in the METABRIC model.(B-D)The molecular grade, overall mutation rate and CNA frequency were highly correlated with the N-B (first column) and N-H (second column) progression branches. CNA, copy number alteration; N-B, normal through luminal to basal phenotype; N-H, normal through luminal to HER2+ phenotype; TCGA, The Cancer Genome Atlas.
Mapping of tumor grades onto the progression model We next investigated how grades would be mapped to the two major branches of the constructed progression model. Histological tumor grade is a measure of the extent of abnormal tumor cell morphology relative to normal cells [53]. Since the determination of histolog-ical intermediate-grade tumors is somewhat subjective, a method to derive a molecular grade index has been developed [54], and the information required to derive this index was available in the METABRIC dataset. We found that both the molecular and histological grades were highly correlated with both of the major progression paths. Figure 5B plots molecular grade against the sam-ples on the model’s N-B progression path and reveals that there is a clear increase in grade along the path to the most malignant basal phenotype samples. Likewise, for the N-H
path (Figure 5B) a clear trend in molecular grade towards the malignant HER2+ samples was observed. Statistical significance was determined by Spearman’s test. Briefly, each sample was projected onto the specific progression path (the projection of a sample is defined as a point on the path that is the closest to the sample; see Additional file 2: Figures S8 and S10), and then a Spearman cor-relation analysis of histologic/molecular grade was per-formed against the N-B/N-H paths. Strong correlation was observed for both molecular grade (N-B: r = 0.89, P=0; N-H:r=0.84,P=0) and histological grade (N-B: r=0.61,P=0; N-H:r=0.53,P=0; see Figure 5D).
phenotypes are aggressive grade-3 cancers and the major-ity of luminal A tumors are low grade-1 cancers [55]. In itself, this is difficult to explain within a discrete dis-ease evolution model as it implies that basal and HER2+ tumors are high-grade cancers from the outset. The cor-relation aligns well with a linear evolution model. Inter-estingly, the mapping of the grades onto the model also supports a malignancy-associated transition from luminal A to luminal B phenotypes. Luminal B tumors are rou-tinely graded higher histologically than luminal A tumors, and grade-3 rates (and outcomes) approach those seen in the more aggressive HER2+ and basal phenotypes [47,55]. It has been proposed that this phenomenon reflects a yet more complex inventory of subtypes within the lumi-nal B phenotype [47], but it could also be explained by a progressive transition from luminal A to luminal B and then on to the aggressive HER2+ or basal tumor phenotypes.
Model validation using an independent breast cancer dataset
To investigate whether a similar model would be derived from an independent dataset, we performed a computa-tional analysis on data obtained from The Cancer Genome Atlas (TCGA) breast cancer project [8]. As such, we have used data from the two most comprehensive breast can-cer projects conducted to date. In the TCGA project, a total of 507 tumor tissues and 17 normal tissues were sub-jected to gene expression and copy number profiling. It is often difficult to perform direct comparisons between large projects because the data sources are not entirely compatible. In this case, the TCGA study employed dif-ferent microarray platforms, and the clinical follow-up was markedly shorter (median overall follow-up was 17 months vs 98 months for the METABRIC data, and there were only 90 overall survival events), so feature selection on this dataset would be underpowered. Instead, we mapped the genes selected from the METABRIC data analysis back to the TCGA data to perform the clus-tering and principal curve analyses and model construc-tion. A total of 775 of the 989 genes selected from the METABRIC dataset were also found in the TCGA data. On application of the same two-pronged analytical proto-col, nine stable clusters were identified (Additional file 1: Figures S15 and S16). The difference in the numbers of clusters found in the two studies can be attributed to various factors including the different sample sizes, the different microarray platforms used, and the partially overlapped gene sets. Despite those differences, the major structures of the progression model constructed using the TCGA data (i.e., the bifurcation structure and the order that the clusters are connected) were almost identical to those constructed using the METABRIC data (Figure 7). As with the METABRIC data model, luminal A clusters
represented the largest group in the cohort, there were four luminal A type and two luminal B type clusters in series, and there were some dead-end side branches emanating from the luminal phenotypes. Because only 8 out of 507 tumor samples were classified as normal-like, no distinct cluster was identified on the TCGA progres-sion tree. Survival curves for the clusters in the TCGA model could not be constructed due to the lack of follow-up data. Consistent with the results obtained from the METABRIC progression model, the progression model constructed using the TCGA data was also significantly correlated with the molecular grade index (Spearman’s test, N-B:r = 0.85,P = 0; N-H:r = 0.81,P = 0). Of note, the magnitudes of the correlation obtained for both METABRIC and TCGA models were comparable (see Figure 5D). No histological grade data was available for the TCGA data.
the CNA frequency (Spearman’s test, N-B: r = 0.53, P=0; N-H:r=0.50,P=0; see Figure 5C,D). No somatic mutation data were available for the METABRIC data.
Genome instability is generally referred to as an enabling characteristic of cancer progression [5]. The sig-nificant correlation of both somatic mutation rate and CNA frequency in the progression models built from two independent datasets provides strong evidence support-ing the validity of the proposed model.
Mapping of key genes onto breast cancer progression paths
[image:13.595.60.542.507.683.2]Next, we investigated the change in gene expression of some key genes during breast cancer progression by mapping them onto the model derived from the more comprehensive METABRIC dataset. Our initial interroga-tion mapped the expression of seven key genes (AURKA, PLAU, STAT1, VEGF, CASP3, ESR1 and ERBB2), which represent described hallmarks of cancer, namely prolifer-ation, tumor invasion and metastasis, immune response, angiogenesis, apoptosis, and estrogen (ER) and HER2 signaling, respectively [59]. The resulting plots revealed the change of expression of these genes along both lin-ear paths, normal to HER2+ (N-H, Additional file 1: Figure S17) and normal to basal (N-B, Additional file 1: Figure S18). By normalizing the expression levels, we were able to visualize the changes on a single overlay plot (Figure 8). The curves were generated using the poly-nomial curve fitting method and the degree parameter was estimated through tenfold cross-validation [40]. Once again, we label the axis with PAM50 subtype labels to indicate an approximation of tumor subtypes for ease of discussion.
As would be expected, the ERBB2 gene is only highly expressed in the HER2+ cluster on the N-H path (Figure 8, left), suggesting ERBB2 amplification is a late onset event in tumor progression. As also expected, the estrogen receptor ESR1 is low in normal phenotypes, increased in luminal phenotypes that are primarily classified as ER+, and lost in the most malignant basal and HER2+ phenotypes. On the N-B path plot (Figure 8, right), we see that basal phenotypes are ER−/HER2−. Most triple-negative tumors (ER−/HER2−/PR−), which carry a par-ticularly poor prognosis, have a basal phenotype [60]. VEGF expression increases from the normal to luminal phenotypes, but then plateaus across luminal phenotypes until the transition to malignant HER2+ or basal phases. This may suggest that angiogenesis is a limiting factor for progression from luminal phenotypes, perhaps indicating a potential point of efficacy for anti-angiogenic therapy. As an indicator of tumor invasion, higher PLAU expres-sion is expected at the malignant disease stages, and this is observed for both progression paths, but the correlation is less pronounced than for other indicators. The plots reveal that increasing AURKA expression is very strongly correlated with progression to malignancy. Intuitively, we might expect that proliferation will increase in an over-all sense as cancer develops, but even malignant tumors are relatively slow-growing from a cellular mass point of view, and so tumors have to overcome opposing events to achieve a net growth. This is supported by the fact that the expression of CASP3, an indicator of apoptosis [61], also increases in parallel with AURKA as tumors progress. AURKA has been reported to be associated with outcome as the key gene in a proliferation mod-ule [59] and as part of a three-gene molecular signature
for subtype classification of tumors [62]. Those studies provided support for AURKA gene expression as a classi-fier or a biomarker for prognosis using associations with particular subtypes, but the positive correlation across N-H and N-B paths revealed by plotting the progression model provides further support for AURKA monitoring as a powerful biomarker of tumor status and prognosis. Likewise, the strong correlation of expression of STAT1 suggests that this factor could also act as a marker of progression status and outcome. The transcription factor STAT1 has been thought of as an onco-suppressive factor, acting through the stimulation of anti-proliferative and pro-apoptotic genes in tumor cells, but recent evidence supports a multivalent role for this factor in advancing cancer. STAT1 expression is up-regulated in a number of late-stage cancers, including breast cancer [63-65], and high STAT1 levels have been correlated with poor survival, presence of metastases and with chemo- and radiotherapy resistance in breast cancer patients [66,67]. Potential functions of STAT1 in aggressive cancers include the maintenance of pro-survival genes [68] and the regula-tion of the local immune response [65]. There are conflict-ing reports of STAT1 expression levels in breast cancer subtypes [59], but in the large METABRIC dataset, STAT1 expression was significantly increased in the malignant phenotypes.
We also explored the potential association of reported cancer driver genes with breast cancer progression using the same model interrogation approach. The 125 driver genes selected have been defined through large-scale mutational analyses [69], but changes in their expression level may also enhance or inhibit some aspect of tumor progression. A total of 31 genes were found to have sig-nificant changes in expression across either path of the progression model (Additional file 1: Figures S19 and S20 and Additional file 4: Table S1). From the individual plots, we see that a few genes have a distinctive associ-ation with progression. Of note are the opposing curves of EGFR and NOTCH1 versus GATA3 and RET. The for-mer pair have U-shaped curves depicting higher expres-sion in normal and malignant phenotypes, whereas the latter pair have pronounced bell-shaped curves that mir-ror the EGFR/NOTCH1 expression profile. These genes may have a co-ordinate expression relationship, being regulated by each other, or perhaps through the estro-gen receptor, which has a similar profile to GATA3/RET across the progression model, and such networks are beginning to be elucidated [70]. Other notable plots include EZH2, which is expressed at progressively higher levels on both paths to malignancy, and SMAD4 and KIT, which similarly decrease during transition from nor-mal to nor-malignant states. The only driver gene to have a distinct spike in expression in the malignant pheno-types was CDKN2A. This gene encodes the p16INK4a
tumor suppressor protein, which regulates the cell cycle, and so the marked increase in expression in both basal and HER2+ phenotypes is intriguing. Interestingly, recent studies have shown that in breast cancer, high expression is indicative of a more undifferentiated phenotype [71], and elevated CDKN2A has been proposed as a marker of poor prognosis [72]. Our progression model supports these recent reports. While the driver gene analyses do not address the mutational status of the specific genes, the level of their expression is of interest because it will impact the potential effect that the driver mutations may have on tumor phenotype.
Discussion
Overall, our findings support the idea that cancers acquire the properties required for progression towards malig-nancy from an accumulation of genetic aberrations, a phenomenon that is consistent with clonal evolution the-ory. This process occurs over extended time periods, measured in years, and so accurate mapping is logisti-cally very challenging. From cancer patients, we typilogisti-cally only have data from a single time point through sampling at the time of surgery, and this restriction is unlikely to be overcome for the majority of solid tumors. While it may subsequently be possible to reconstruct the develop-ment of malignancy through a longitudinal study of a few select patients, to overcome issues of heterogeneity, a large number of tissue samples is possibly needed first to con-struct a theoretical model of progression. This can only be achieved through the analysis of available static sam-ples. A computational approach that can overcome the sampling limitation and thereby enable the leveraging of accumulating data and the vast tissue archive represents a major advance with respect to the application of bioin-formatics methodology to the study of progressive human diseases.
provide a foundation for the visualization of key pro-gressive molecular events and facilitate the identification of pivotal driver genes and pathways, the most relevant and robust biomarker signatures, and potential points of susceptibility for therapeutic intervention. Moreover, interrogation of the model will allow researchers to test novel hypotheses in silico and thus help to prioritize resources for more focused and detailed investigations experimentally.
The presented study has demonstrated the possibility of using static sample data to study disease dynamics, which lays a foundation for future studies to incorporate all cur-rently available molecular data (e.g., mRNA, microRNA, copy number, methylation and protein expression data) to construct high-resolution cancer progression trees. Our ongoing work will thus focus on addressing the challenges associated with processing massive, high-dimensional data of different types to build models of increasing reso-lution. This in turn will further facilitate the elucidation of clinically and biologically pertinent issues. The described computational methods can also be further improved accordingly. For example, in the proposed EM-based prin-cipal curve-fitting algorithm, we assumed that the data was corrupted by noise with an equal variance through-out the genomic space. This heuristic approach worked well, but to build higher resolution models, we are work-ing to develop an algorithm uswork-ing data-driven variance estimation. In this study, we used a two-pronged approach consisting of spectral clustering and principal curve to model a cancer progression path. Incorporation of other data dimensionality techniques (e.g., self-organizing map [77] and Isomap [78]) may also aid the production of a low-dimensional representation of the input space of can-cer samples. We expect that the results would be similar, but an intensive computation study is needed to assess the utility of other techniques for cancer progression modeling.
Conclusions
We describe the derivation of a novel computational approach for mapping the development of cancer towards malignancy. Through application to two independent, large-scale breast cancer datasets, we have shown that the proposed method can reconstruct tumor progres-sion through the analysis of static samples and thereby identify genetic events associated with pivotal shifts in phenotype. This new set of tools will enable the con-struction of high-resolution progression trees for cancers and other diseases for which longitudinal data sampling is ethically or logistically not possible. Refinement of pro-gression trees will facilitate the identification of molec-ular drivers of disease progression and the derivation of robust biomarker signatures for patient evaluation and management.
Endnotes
aThe data is available in the European
Genome-Phenome Archive with the accession number [EGAS00000000083].
bBased on a rule of thumb used in the statistical
community, two variables with a correlation larger than−0.2 and smaller than 0.2 are considered as having no or negligible relationship.
Additional files
Additional file 1: Supplementary figures.
Additional file 2: Supplementary data.Detailed mathematical derivations of the proposed methods and simulation studies. It also contains Figures S1 to S11.
Additional file 3: Movie S1.An overview of the data distribution. Additional file 4: Table S1.Shown are 31 putative cancer driver genes.
Abbreviations
EM: expectation maximization; ER: estrogen receptor; KNN:Knearest neighbor; LN: lymph node; miRNA, microRNA; ML: maximum likelihood; N-B: normal through luminal to basal phenotype; N-H: normal through luminal to HER2+ phenotype; OS: overall survival; PCA: principal component analysis; TCGA: The Cancer Genome Atlas.
Competing interests
The authors declare that they have no competing interests.
Authors’ contributions
YS and SG designed the study. YS and JY performed the data analysis. YS, JY, NJN and SG wrote the manuscript. All authors read and approved the final manuscript.
Acknowledgements
Thanks to the collective efforts of the TCGA initiative of the National Institutes of Health (NIH) and equivalent European consortia, multi-format data from large numbers of tumor tissue samples are publicly available. Without these efforts, it would not be feasible to develop computational approaches that describe the dynamic aspects of disease progression. This work was supported in part by the National Science Foundation under grant number 1322212 (YS), the SUNY Research Foundation (YS), the JR Oishei Foundation (NJN) and NIH RO1 CA108597 (SG).
Author details
1Department of Microbiology and Immunology, Department of Computer Science and Engineering, Department of Biostatistics, University at Buffalo, The State University of New York, Buffalo, NY 14201, USA.2Department of Bioinformatics and Biostatistics, Roswell Park Cancer Institute, Buffalo, NY 14201, USA.3Department of Electrical and Computer Engineering, University of Florida, Gainesville, FL 32610, USA.4Department of Biochemistry, University at Buffalo, The State University of New York, Buffalo, NY 14201, USA.5Department of Health Sciences Research, Mayo Clinic, Jacksonville, FL 32224, USA.
Received: 30 April 2014 Accepted: 14 August 2014
References
1. Greaves M, Maley CC:Clonal evolution in cancer.Nature2012, 481:306–313.
2. Yates LR, Campbell PJ:Evolution of the cancer genome.Nat Rev Genet 2012,13:795–806.
3. Podlaha O, Riester M, De S, Michor F:Evolution of the cancer genome. Trends Genet2012,28:155–163.
5. Hanahan D, Weinberg RA:Hallmarks of cancer: the next generation. Cell2011,144:646–674.
6. Bar-Joseph Z, Gitter A, Simon I:Studying and modelling dynamic biological processes using time-series gene expression data.Nat Rev Genet2012,13:552–564.
7. Curtis C, Shah SP, Chin S-F, Turashvili G, Rueda OM, Dunning MJ, Speed D, Lynch AG, Samarajiwa S, Yuan Y, Graf S, Ha G, Haffari G, Bashashati A, Russell R, McKinney S, Langerod A, Green A, Provenzano E, Wishart G, Pinder S, Watson P, Markowetz F, Murphy L, Ellis I, Purushotham A, Borresen-Dale A-L, Brenton JD, Tavare S, Caldas C, et al.:The genomic and transcriptomic architecture of 2,000 breast tumours reveals novel subgroups.Nature2012,486:346–352.
8. The Cancer Genome Atlas Network:Comprehensive molecular portraits of human breast tumours.Nature2012,490:61–70. 9. Siegel R, Ma J, Zou Z, Jemal A:Cancer statistics, 2014.CA: A Cancer J Clin
2014,64:9–29.
10. van’t Veer LJ, Dai H, van de Vijver, MJ, He YD, Hart AAM, Mao M, Peterse HL, van der Kooy, K, Marton MJ, Witteveen AT, Schreiber GJ, Kerkhoven RM, Roberts C, Linsley PS, Bernards R, Friend SH:Gene expression profiling predicts clinical outcome of breast cancer.Nature2002, 415:530–536.
11. Sun Y, Goodison S, Li J, Liu L, Farmerie W:Improved breast cancer prognosis through the combination of clinical and genetic markers. Bioinformatics2007,23:30–37.
12. Wang Y, Klijn JG, Zhang Y, Sieuwerts AM, Look MP, Yang F, Talantov D, Timmermans M, Meijer-van Gelder ME, Yu J, Jatkoe T, Berns EM, Atkins D, Foekens JA:Gene-expression profiles to predict distant metastasis of lymph-node-negative primary breast cancer.Lancet2005,
365:671–679.
13. Porter PL, Malone KE, Heagerty PJ, Alexander GM, Gatti LA, Firpo EJ, Daling JR, Roberts JM:Expression of cell-cycle regulators p27kip1and cyclin
E, alone and in combination, correlate with survival in young breast cancer patients.Nat Med1997,3:222–225.
14. Slamon DJ, Clark GM, Wong SG, Levin WJ, Ullrich A, McGuire WL:Human breast cancer: correlation of relapse and survival with amplification of the HER-2/neu oncogene.Science1987,235:177–182.
15. Sun Y, Goodison S:Optimizing molecular signatures for predicting prostate cancer recurrence.Prostate2009,69:1119–1127. 16. Goodison S, Sun Y, Urquidi V:Derivation of cancer diagnostic and
prognostic signatures from gene expression data.Bioanalysis2010, 2:855–862.
17. Tibshirani R:Regression shrinkage and selection via the lasso.J R Stat Soc Ser B (Methodological)1996,58:267–288.
18. Qiu P, Gentles AJ, Plevritis SK:Discovering biological progression underlying microarray samples.PLoS Comput Biol2011,7:1001123. 19. Sun Y, Todorovic S, Goodison S:Local-learning-based feature selection
for high-dimensional data analysis.IEEE Trans Pattern Anal Mach Intell 2010,32:1610–1626.
20. Sun Y:Iterative RELIEF for feature weighting: algorithms, theories, and applications.IEEE Trans Pattern Anal Mach Intell2007,29:1035–1051. 21. Kira K, Rendell LA:A practical approach to feature selection.In
Proceedings of the Ninth International Workshop on Machine Learning. San Francisco, CA; 1992:249–256.
22. Crammer K, Gilad-Bachrach R, Navot A, Tishby N:Margin analysis of the LVQ algorithm.InProceedings of Advances in Neural Information Processing Systems. Volume 2; 2002:462–469.
23. Vapnik V:The Nature of Statistical Learning Theory. New York: Springer; 2000. 24. Schapire RE, Freund Y, Bartlett P, Lee WS:Boosting the margin: a new
explanation for the effectiveness of voting methods.Ann Stat1998, 26:1651–1686.
25. Dempster AP, Laird NM, Rubin DB:Maximum likelihood from incomplete data via the EM algorithm.J R Stat Soc Ser B (Methodological)1977,39:1–38.
26. Cai Y, Sun Y, Cheng Y, Li J, Goodison S:Fast implementation of1 regularized learning algorithms using gradient descent methods. In10th SIAM International Conference on Data Mining; 2010:862–871. 27. Kress R:Numerical Analysis. New York: Springer; 1998.
28. Luxburg U:A tutorial on spectral clustering.Stat Comput2007, 17:395–416.
29. Manning CD, Raghavan P, Schütze H:Introduction to Information Retrieval. Cambridge: Cambridge University Press; 2008.
30. Zelnik-Manor L, Perona P:Self-tuning spectral clustering.InProceedings of Advances in Neural Information Processing Systems. Volume 17; 2004:1601–1608.
31. Ng AY, Jordan MI, Weiss Y:On spectral clustering: analysis and an algorithm.InProceedings of Advances in Neural Information Processing Systems. Volume 14; 2001:849–856.
32. Monti S, Tamayo P, Mesirov J, Golub T:Consensus clustering: a resampling-based method for class discovery and visualization of gene expression microarray data.Mach Learn2003,52:91–118. 33. Hastie T, Stuetzle W:Principal curves.J Am Stat Assoc1989,
84:502–516.
34. Tibshirani R:Principal curves revisited.Stat Comput1992,2:183–190. 35. Ozertem U, Erdogmus D:Locally defined principal curves and
surfaces.J Mach Learn Res2011,12:1249–1286.
36. Bishop CM:Pattern Recognition and Machine Learning. New York: Springer; 2006.
37. Duchamp T, Stuetzle W:Extremal properties of principal curves in the plane.Ann Stat1996,24:1511–1520.
38. Tibshirani R, Walther G, Hastie T:Estimating the number of clusters in a data set via the gap statistic.J R Stat Soc Ser B (Stat Methodol)2001, 63:411–423.
39. Sugar CA:Techniques for clustering and classification with applications to medical problems.PhD thesis. Stanford University, 1998. 40. Hastie T, Tibshirani R, Friedman J:The Elements of Statistical Learning.
New York: Springer; 2009.
41. Kirkwood BR, Sterne JA:Medical Statistics. Massachusetts: Blackwell Science; 2003.
42. Perou CM, Parker JS, Prat A, Ellis MJ, Bernard PS:Clinical implementation of the intrinsic subtypes of breast cancer.Lancet Oncol2010, 11:718–719.
43. Parker JS, Mullins M, Cheang MC, Leung S, Voduc D, Vickery T, Davies S, Fauron C, He X, Hu Z, Quackenbush JF, Stijleman IJ, Palazzo J, Marron JS, Nobel AB, Mardis E, Nielsen TO, Ellis MJ, Perou CM, Bernard PS: Supervised risk predictor of breast cancer based on intrinsic subtypes.J Clin Oncol2009,27:1160–1167.
44. Sorlie T, Perou CM, Tibshirani R, Aas T, Geisler S, Johnsen H, Hastie T, Eisen MB, Van De Rijn M, Jeffrey SS, Thorsen T, Quist H, Matese JC, Brown PO, Botstein D, Lønning PE, Børresen-Dale A-L:Gene expression patterns of breast carcinomas distinguish tumor subclasses with clinical implications.Proc Nat Acad Sci2001,98:10869–10874.
45. Sorlie T, Tibshirani R, Parker J, Hastie T, Marron J, Nobel A, Deng S, Johnsen H, Pesich R, Geisler S, Demeter J, Perou CM, Lønning PE, Brown PO, Børresen-Dale A-L, Botstein D:Repeated observation of breast tumor subtypes in independent gene expression data sets.Proc Nat Acad Sci 2003,100:8418–8423.
46. Ciriello G, Sinha R, Hoadley KA, Jacobsen AS, Reva B, Perou CM, Sander C, Schultz N:The molecular diversity of luminal A breast tumors.Breast Cancer Res Treat2013,141:409–420.
47. Creighton CJ:The molecular profile of luminal B breast cancer. Biologics: Targets Therapy2012,6:289.
48. Kaplan EL, Meier P:Nonparametric estimation from incomplete observations.J Am Stat Assoc1958,53:457–481.
49. Nofech-Mozes S, Trudeau M, Kahn HK, Dent R, Rawlinson E, Sun P, Narod SA, Hanna WM:Patterns of recurrence in the basal and non-basal subtypes of triple-negative breast cancers.Breast Cancer Res Treat 2009,118:131–137.
50. Xu H, Eirew P, Mullaly SC, Aparicio S:The omics of triple-negative breast cancers.Clin Chem2014,60:122–133.
51. Guiu S, Michiels S, Andre F, Cortes J, Denkert C, Di Leo A, Hennessy B, Sorlie T, Sotiriou C, Turner N, Van de Vijver, M, Viale G, Loi S, Reis-Filho JS: Molecular subclasses of breast cancer: how do we define them? The IMPAKT 2012 working group statement.Ann Oncol2012,
23:2997–3006.
52. Molyneux G, Geyer FC, Magnay F-A, McCarthy A, Kendrick H, Natrajan R, MacKay A, Grigoriadis A, Tutt A, Ashworth A, Reis-Filho JS, Smalley MJ: BRCA1 basal-like breast cancers originate from luminal epithelial progenitors and not from basal stem cells.Cell Stem Cell2010, 7:403–417.
54. Sotiriou C, Wirapati P, Loi S, Harris A, Fox S, Smeds J, Nordgren H, Farmer P, Praz V, Haibe-Kains B, Desmedt C, Larsimont D, Cardoso F, Peterse H, Nuyten D, Buyse M, Van de Vijver, MJ, Bergh J, Piccart M, Delorenzi M: Gene expression profiling in breast cancer: understanding the molecular basis of histologic grade to improve prognosis.J Nat Cancer Inst2006,98:262–272.
55. Calza S, Hall P, Auer G, Bjöhle J, Klaar S, Kronenwett U, Liu ET, Miller L, Ploner A, Smeds J, Bergh J, Pawitan Y:Intrinsic molecular signature of breast cancer in a population-based cohort of 412 patients.Breast Cancer Res2006,8:34.
56. Santarius T, Shipley J, Brewer D, Stratton MR, Cooper CS:A census of amplified and overexpressed human cancer genes.Nat Rev Cancer 2010,10:59–64.
57. Watson IR, Takahashi K, Futreal PA, Chin L:Emerging patterns of somatic mutations in cancer.Nat Rev Genet2013,14:703–718. 58. Tomasetti C, Vogelstein B, Parmigiani G:Half or more of the somatic
mutations in cancers of self-renewing tissues originate prior to tumor initiation.Proc Nat Acad Sci2013,110:1999–2004.
59. Desmedt C, Haibe-Kains B, Wirapati P, Buyse M, Larsimont D, Bontempi G, Delorenzi M, Piccart M, Sotiriou C:Biological processes associated with breast cancer clinical outcome depend on the molecular subtypes. Clin Cancer Res2008,14:5158–5165.
60. Peddi PF, Ellis MJ, Ma C:Molecular basis of triple negative breast cancer and implications for therapy.Int J Breast Cancer2012, 2012:217185.
61. Simpson KL, Cawthorne C, Zhou C, Hodgkinson CL, Walker MJ, Trapani F, Kadirvel M, Brown G, Dawson M, MacFarlane M, Williams KJ, Whetton AD, Dive C:A caspase-3 ‘death-switch’ in colorectal cancer cells for induced and synchronous tumor apoptosis in vitro and in vivo facilitates the development of minimally invasive cell death biomarkers.Cell Death Dis2013,4:613.
62. Haibe-Kains B, Desmedt C, Loi S, Culhane AC, Bontempi G, Quackenbush J, Sotiriou C:A three-gene model to robustly identify breast cancer molecular subtypes.J Nat Cancer Inst2012,104:311–325.
63. Manavi M, Hudelist G, Fink-Retter A, Gschwandtler-Kaulich D, Pischinger K, Czerwenka K:Gene profiling in pap-cell smears of high-risk human papillomavirus-positive squamous cervical carcinoma.Gynecol Oncol 2007,105:418–426.
64. Schultz J, Koczan D, Schmitz U, Ibrahim SM, Pilch D, Landsberg J, Kunz M: Tumor-promoting role of signal transducer and activator of transcription (Stat) 1 in late-stage melanoma growth.Clin Exp Metastasis2010,27:133–140.
65. Hix LM, Karavitis J, Khan MW, Shi YH, Khazaie K, Zhang M:Tumor STAT1 transcription factor activity enhances breast tumor growth and immune suppression mediated by myeloid-derived suppressor cells.J Biol Chem2013,288:11676–11688.
66. Weichselbaum RR, Ishwaran H, Yoon T, Nuyten DS, Baker SW, Khodarev N, Su AW, Shaikh AY, Roach P, Kreike B, Roizman B, Bergh J, Pawitan Y, van de Vijver MJ, Minn AJ:An interferon-related gene signature for DNA damage resistance is a predictive marker for chemotherapy and radiation for breast cancer.Proc Nat Acad Sci2008,105:18490–18495. 67. Greenwood C, Metodieva G, Al-Janabi K, Lausen B, Alldridge L, Leng L,
Bucala R, Fernandez N, Metodiev MV:Stat1 and CD74 overexpression is co-dependent and linked to increased invasion and lymph node metastasis in triple-negative breast cancer.J Proteomics2012, 75:3031–3040.
68. Adach-Kilon A, Swiatek-Machado K, Kaminska B, Dabrowski M:Signal transducer and activator of transcription 1 (Stat1) maintains basal mRNA expression of pro-survival stat3-target genes in glioma C6 cells.J Cell Biochem2011,112:3685–3694.
69. Vogelstein B, Papadopoulos N, Velculescu VE, Zhou S, Diaz LA, Kinzler KW: Cancer genome landscapes.Science2013,339:1546–1558.
70. Kittler R, Zhou J, Hua S, Ma L, Liu Y, Pendleton E, Cheng C, Gerstein M, White KP:A comprehensive nuclear receptor network for breast cancer cells.Cell Reports2013,3:538–551.
71. Milde-Langosch K, Bamberger A-M, Rieck G, Kelp B, Löning T: Overexpression of the p16 cell cycle inhibitor in breast cancer is associated with a more malignant phenotype.Breast Cancer Res Treat 2001,67:61–70.
72. Hui R, Macmillan RD, Kenny FS, Musgrove EA, Blamey RW, Nicholson RI, Robertson JF, Sutherland RL:INK4a gene expression and methylation
in primary breast cancer: overexpression of p16INK4a messenger RNA is a marker of poor prognosis.Clin Cancer Res2000,6:2777–2787. 73. Beroukhim R, Mermel CH, Porter D, Wei G, Raychaudhuri S, Donovan J,
Barretina J, Boehm JS, Dobson J, Urashima M, McHenry KT, Pinchback RM, Ligon AH, Cho Y-J, Haery L, Greulich H, Reich M, Winckler W, Lawrence MS, Weir BA, Tanaka KE, Chiang DY, Bass AJ, Loo A, Hoffman C, Prensner J, Liefeld T, Gao Q, Yecies D, Signoretti S, et al.:The landscape of somatic copy-number alteration across human cancers.Nature2010, 463:899–905.
74. Stratton MR:Exploring the genomes of cancer cells: progress and promise.Science2011,331:1553–1558.
75. Wood LD, Parsons DW, Jones S, Lin J, Sjöblom T, Leary RJ, Shen D, Boca SM, Barber T, Ptak J, Silliman N, Szabo S, Dezso Z, Ustyanksky V, Nikolskaya T, Nikolsky Y, Karchin R, Wilson PA, Kaminker JS, Zhang Z, Croshaw R, Willis J, Dawson D, Shipitsin M, Willson JKV, Sukumar S, Polyak K, Park BH, Pethiyagoda CL, Pant PVK, et al.:The genomic landscapes of human breast and colorectal cancers.Science2007,318:1108–1113. 76. Raphael BJ, Dobson JR, Oesper L, Vandin F:Identifying driver mutations
in sequenced cancer genomes: computational approaches to enable precision medicine.Genome Med2014,6:5.
77. Kohonen T, Honkela T:Kohonen network.Scholarpedia2007,2:1568. 78. Tenenbaum JB, De Silva V, Langford JC:A global geometric framework
for nonlinear dimensionality reduction.Science2000,290:2319–2323.
doi:10.1186/s13059-014-0440-0
Cite this article as:Sunet al.:Cancer progression modeling using static sample data.Genome Biology201415:440.
Submit your next manuscript to BioMed Central and take full advantage of:
• Convenient online submission
• Thorough peer review
• No space constraints or color figure charges
• Immediate publication on acceptance
• Inclusion in PubMed, CAS, Scopus and Google Scholar
• Research which is freely available for redistribution