Technology (IJRASET)
Customer Satisfaction in Construction Industry
P.Meenakshi#1
Asst .Prof (S-II) #Civil and Structural Engineering, SCSVMV University
Abstract -The questions for the questionnaire survey were framed by considering the points given by both customers as well
as the flat promoters.The questionnaire survey was conducted among two types of customers. The first type was the customers who bought their flats for the cost ranging between 4-10 lakhs.and the second type was the customers who bought their flats for 10-20 lakhs.From the flat promoter’s opinion, it is clear that the middle class people usually buy flats in the range of 4-10 lakhs and the upper middle class people buy flats in the range of 10-20 lakhs. So, a questionnaire survey was carried out among 25 customers in the first type and 25 customers in the second type.The survey results were analyzed by the software SPSS From the results of the analysis, the important factors were identified. Based on the results of the analysis some recommendations were made which would be useful for both flat promoters and flat buyers.
Keywords - customer satisfaction, response, survey, factor analysis, group statistics
I. INTRODUCTION
The increasing population growth demands a very larger area for the housing needs of people. This leads to large number of vertical risings in our country. Now a day the multistoried residential complexes with very good aesthetics and the so called flat systems is the fast growing area in construction. People also prefer residing in residential complexes rather than going for individual houses. Flat buyers are already getting more demanding. They are more informed, more aware, and more knowledgeable about what goes into the building process. Customer satisfaction is one of the key elements in Total Quality Management (TQM), an approach that emphasizes overall satisfaction through the continuous improvement of products.
II. OBJECTIVES AND SCOPE
The objectives are The study attempts to find answers to the following questions. What are the variables impact flat-buyer satisfactions What are their relative weights? What areas of improvement will have the greatest impact on flat-buyer satisfaction? Analyses of various results from the questions . The scope are Personal liking and disliking, Location of the flat, Price of the flat or Economical considerations, Quality of the flat, Design of the flat, Service of the promoters these study areas finding a solution for the satisfaction of flat buyers.
III. RESEARCH METHODOLOGY
Technology (IJRASET)
B. Personal Liking and Disliking
R e s p o ns e s o f p e r s o na l l i k i ng s a nd d i s l i k i ng s
46%
34% 20%
YES NO
DON’ T MIND
Fig 1 : Response of Personal Liking and Disliking
1) Do you prefer your flats to be built according to vaasthu?
2) Do you prefer the upper floors in your flat?
3) Do you prefer your flats to be equipped with swimming pool, play ground etc?
4) Do you prefer your flats to be built in proper orientation with respect to nearby flats?
5) Do you prefer your flats to be a fully furnished one?
6) Do you prefer your flats to be located near market?
7) Do you prefer your flats to be beautified with the landscaping?
8) Do you prefer your flats to be provided with separate facilities for solid waste disposal?
C. Location of the flat
RESPONSES OF LOCATION OF FLAT
47%
22% 31%
YES NO
DON’ T MIND
Fig 2 : Response of Location of the flat
1) Do you prefer flats located near bus stops, Railway stations?
2) Do you prefer flats located nearby schools and colleges?
3) Do you prefer flats located nearby commercial areas?
4) Would you prefer your flats to be located nearer to your working area?
5) Would you like your flats to be located in the decongested or city outskirts?
6) Would you prefer your flats to be located away from the industrial area?
D. Price of the Flat
Re s po ns e s o f p r ice o f f lat s
58% 18%
24% Y ES
NO
Technology (IJRASET)
1) Would you prefer to pay extra for Car/Two wheeler Parking?
2) Would you prefer to pay for Good security system?
3) Would you prefer to pay extra for common maintenance?
4) Would you prefer to pay extra for Landscape and Lighting?
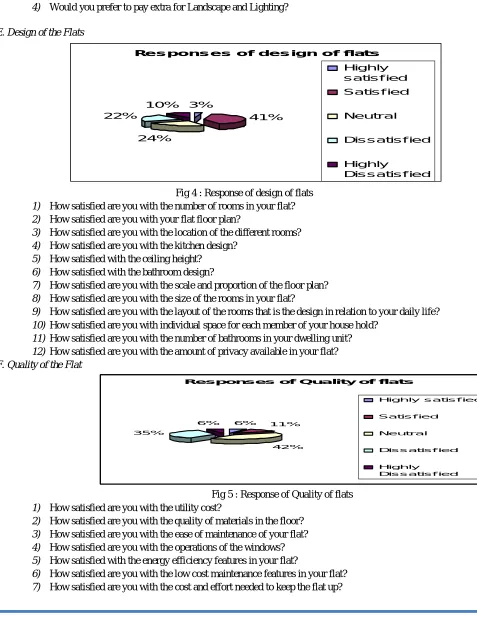
E. Design of the Flats
Re s pons e s of de s ign of flats
3% 41% 24% 22% 10% Highly s atis f ied
Satis f ied
Neutral
Dis s atis f ied
Highly
[image:4.612.45.522.128.747.2]Dis s atis f ied
Fig 4 : Response of design of flats
1) How satisfied are you with the number of rooms in your flat?
2) How satisfied are you with your flat floor plan?
3) How satisfied are you with the location of the different rooms?
4) How satisfied are you with the kitchen design?
5) How satisfied with the ceiling height?
6) How satisfied with the bathroom design?
7) How satisfied are you with the scale and proportion of the floor plan?
8) How satisfied are you with the size of the rooms in your flat?
9) How satisfied are you with the layout of the rooms that is the design in relation to your daily life?
10) How satisfied are you with individual space for each member of your house hold?
11) How satisfied are you with the number of bathrooms in your dwelling unit?
12) How satisfied are you with the amount of privacy available in your flat?
F. Quality of the Flat
Re spons es of Qua lity of flats
6% 11%
42% 35%
6%
Highly s atis f ied
Satis f ied
Neutral
Dis s atis f ied
Highly
[image:4.612.145.543.504.613.2]Dis s atis f ied
Fig 5 : Response of Quality of flats
1) How satisfied are you with the utility cost?
2) How satisfied are you with the quality of materials in the floor?
3) How satisfied are you with the ease of maintenance of your flat?
4) How satisfied are you with the operations of the windows?
5) How satisfied with the energy efficiency features in your flat?
6) How satisfied are you with the low cost maintenance features in your flat?
Technology (IJRASET)
8) How satisfied are you with the operation of the heating or air conditioning?
9) How satisfied are you with the quality of materials in your walls/
10) How satisfied are you with the operation of your doors?
11) How satisfied are you with the quality of the finished workmanship?
12) How satisfied are you with the performance of foundation?
IV. ANALYSIS OF THE RESULTS
Statistical methods are used for the analysis. SPSS is the software used for analyze the data. The response has to be entered, coded, and analyzed by use of SPSS version 16. (Statistical Packages for Social Sciences).In SPSS software, if the number of sample is less than 50 it can be classified as a small sample.
The following tests have to be done using the software SPSS Descriptive Statistics, Factor Analysis,
A. Descriptive Statistics
S.no Factors Mean Std.Deviation 1 Near to bus stops and railway stations 1.40 0.699 2 Near to Commercial areas 1.92 0.751 3 Near to Schools and colleges 1.96 0.968 4 Near to working areas 2.00 0.989 5 Away from the Industrial areas 2.02 0.714 6 In decongested or city outskirts 2.12 0.824 7 Built according to Vaasthu 1.78 0.789 8 Upper floors in flats 1.96 0.781 9 Equipped with gymnasium 1.74 0.852 10 Proper orientation with respect to nearby flats 1.89 0.918 11 Fully furnished flats 1.88 0.520 12 Flats located near market 1.38 0.725 13 Beautified with landscaping 1.66 0.626 14 Facility for solid waste management 1.64 0.802 15 Additional pay for Car parking /two wheeler parking 1.04 0.282 16 Common Maintenance 1.46 0.578 17 Good security system 1.86 0.969 18 Landscape and Lighting 2.22 0.815
B. Factor Analysis
Technology (IJRASET)
12 Individual space 0.960 13 Brightness of light 0.959 14 Responsiveness of the flat builder personnel 0.959 15 Kitchen design 0.959 16 Performance of the foundation 0.958 17 Layout of rooms 0.956 18 Number of rooms 0.955 19 Cost and effort needed to keep the house up 0.953 20 Number and Placement of electrical outlets 0.952 21 Equipped with gymnasium 0.952 22 Ease of maintenance 0.951 23 Good security system 0.943 24 Near to Commercial areas 0.940
Principal component analysis was used since it was an exploratory factor analysis. The important parameter were listed is shown in the table and each respondent was asked to rate them according to the importance in the satisfaction level in a scale. Factor analysis was used here to understand the interdependence among the attributes. The hypothesis which was designed for the factor analysis is as follows:
Null Hypothesis(Ho): Attributes are uncorrelated with the satisfaction of customers
Alternate Hypothesis(Ha): Attributes are not uncorrelated with the satisfaction of customers
FACTORS KMO'S VALUE df Quality of flats 0.841 105 Design of flats 0.932 91 service of promoters 0.924 91 Location of flats 0.810 15 Price of flats 0.666 15 Personal likings and disliking 0.887 28
C. Results
The KMO and Bartlett’s test value (0.841, 0.932, 0.924, 0.810, 0.666, and 0.887) which is greater than 0.5 is considered adequate to conduct factor analysis.
[image:6.612.105.516.527.699.2]D. Group Statistics
Technology (IJRASET)
1) For the parameter design of flat, the mean value for the Group A is 4.32 which is the highest among the six parameters and the mean value for Group B is 3.61. The standard deviation for the Group A is 0.617 and for Group B is 0.503.
2) The mean value for the quality of flat for Group A is 4.12 and for Group B is 3.73. The Standard deviation for Group is 0.391 and for Group B is 0.402.
3) For the parameter Service of Builders, the mean value for the Group A is 3.98 and the mean value for Group B is 2.86. The standard deviation for the Group A is 0.423 and for Group B is 0.351.
4) The mean value for the Parameter Personal likings for Group A is 4.12 and for Group B is 2.98. The Standard deviation for Group is 0.368 and for Group B is 0.467.
5) For the parameter location of flat, the mean value for the Group A is 3.62 which having the lowest value among the six parameters and the mean value for Group B is 2.64. The standard deviation for the Group A is 0.418 and for Group B is 0.512.
6) The mean value for the parameter Prices of flat for Group A is 4.11 and for Group B is 3.29. The Standard deviation for Group is 0.329 and for Group B is 0.431.
7) For the Satisfaction analysis, if the mean value is low among the parameters, then the expectations for the one will be high. Here for the parameter design of flat, Group A is having the highest mean value and hence, the expectation for this parameter is less. For the parameter location of flat, Group B is having the lowest mean value and hence, the expectation for this parameter is very high. From the overall analysis the Group A customer who bought their flats for 10-20 lakhs are not satisfied with all the parameters
V. CONCLUSIONS
Based on the Questionnaire Survey and Statistical analysis results, the following conclusions are drawn.
A. It is found that all the parameters of flat buyers’ satisfaction are significant predictors of overall satisfaction for the flat buyers. In particular, quality has emerged as the most determinant of flat buyers’ satisfaction.
B. Based on the test statistics Quality of flats is the first priority for flat buyers then design of flat and service of promoters is the last rank.
C. When comparing the two independent variables with that of the dependent variable the Income is 54 % and 80 % of variance with that of other factors. This result clearly shows that quality point of view the customers are not fully satisfied.
D. From the result of the group statistics it is clear that the customer who were bought their flats for 25-40 lakhs are not satisfied with all the parameters
REFERENCES
[1] S.M. Ahmed and R. Kangari (1995). Analysis of Client-Satisfaction Factors in Construction Industry. Journal of Management in Engineering, Vol. 11, No. 2, pp. 36-42.
[2] A.H. Al-Momani, (2000). Examining service quality within construction processes. Technovation 20, pp. 643-651.
[3] E.W Anderson and M.W. Sullivan (1993). “The Antecedents and Consequences of Customer Satisfaction for Firms”. Journal of Marketing Science, Vol. 12, No. 2, pp. 125-143.
[4] D Arditi and D.A. Gunaydin (1997). Total Quality Management in the construction Process. International Journal of Project Management, Vol. 15, No. 4, pp. 235-243.
[5] P. Barrett (2000). Systems and relationships for construction quality. International Journal of Quality & Reliability Management, Vol. 17, Nos. 4/5, pp. 377-392.
[6] C Brockmann,. (2002). Modeling Customer Satisfaction for the AEC Industry. AACE International Transactions. pp 152-184.
[7] J.L., Burati, M.F Matthews and S.N. Kalidindi, (1992). "Quality management organizations and techniques," Journal of Construction Engineering and Management, ASCE 118(1), pp. 112-128.
[8] C Gronroos,. (1984). A Service Quality Model and its Marketing Implications. European Journal of Marketing, Vol. 18, No. 4, pp. 36-44. [9] C.Gronroos, (2000). Service Management and Marketing – a customer relationship Management approach, 2nd ed. John Wiley & Sons.