5
XI
November 2017
Reverse Engineering on Process Cycle Time in a
Medium Scale Industry – Data Anthology
Pramod Yadav1, Ajay Kumar Agarwal2, Pradeep Kumar Mouria3, Gianender4, Dr. Rakesh Kumar5
1
M.Tech. Scholar, 2, 3, 4 Assistant Prof., Faculty of Mechanical Engg. Deptt., MRU Faridabad (Haryana, India)
5
Associate Prof., Faculty of Mechanical Engg. Deptt., SBSSTC Ferozepur (Punjab, India)
Abstract: Quantitative and qualitative techniques [1] provide a tradeoff between breadth and depth and between generalizability and targeting to specific (sometimes very limited) populations. However, beyond the debate over the relative virtues of these approaches and discuss some of the advantages and disadvantages of different types of instruments, the qualitative data collection is the most suitable approach. Observation, particularly participant observation, has been used in a variety of disciplines as a tool for collecting data about people, processes, and cultures in qualitative research. In view of for our research, reverse engineering approach [2], [3] and its practicability of minimizing process cycle time [4], [5] in the existing industries, the benefits of the qualitative approach are more appropriate for collecting the richer information and for deeper insight into the phenomenon under study.
Keywords: Quantitative and Qualitative Techniques, Reverse Engineering, Process Cycle Time, Medium Scale Industry, Observation Methods, Observed Data
I. INTRODUCTION
Qualitative data collection methods [1] play a major role in impact evaluation by providing information useful to understand the processes and its schedule behind observed results and assess changes in people’s perceptions of their well‐being. Furthermore, qualitative methods can be used to improve the quality of survey‐based quantitative evaluations by helping generate evaluation hypothesis; strengthening the design of survey questionnaires and expanding or clarifying quantitative assessment findings. These methods are characterized by the following attributes:
A. They tend to be open‐ended and have less structured protocols (i.e., researchers may change the data collection strategy by adding, refining, or dropping techniques or informants).
B. They rely more heavily on interactive interviews; respondents may be interviewed several times to follow up on a particular issue, clarify concepts or check the reliability of data.
C. They use triangulation to increase the credibility of their findings (i.e., researchers rely on multiple data collection methods to check the validity of their results).
D. Their findings are not generalizable to any specific population/data; rather each case study produces a single piece of proof that can be used to seek general patterns among different studies of the same issue.
Regardless of the kinds of data involved, the data collection in a qualitative study takes lots of time and money. The researcher needs to observe and record any potentially useful data accurately and systematically, using field notes, sketches, photographs and other suitable means. The data collection methods must observe the ethical principles of research.
For this research work, observation methods were used. It is one of the most common methods for qualitative data collection as the participant observation is also one of the most demanding. It requires that the researcher become a regular participant in the existing culture or context being observed. Participant observation often requires weeks, months or years of intensive work because the researcher needs to become accepted and adopted as a natural part of the culture to assure that the observations are of the natural phenomenon.
For collecting the data by observation methods, we have selected “ARC Machine Tools Pvt. Ltd” as a source of data for experimental work of our Dissertation. So firstly we are going to let know about the company.
II. COMPANY PROFILE
A. Introduction
1) Under his leadership, the company was involved in various components development such as rear axle shaft, spider, front wheel hubs, spindles, engine plates, rear axle assembly and front axle.
2) Before India Forge and Sudtrac Linkages, Mr. Bhalla was working with Jagatjit Engg. Works Pvt. Ltd as General Manager from 1970 to 1984.
3) Last year we closed our books at 25.36 crores (INR).
4) The company was established in 1997 by Mr. R C Bhalla, who was working with India Forge and Sudtrac linkages as a technical advisor in a machine shop before starting his unit to cater various sectors such as automobile, railways, agriculture, etc.
B. Company Strengths
1) Specialized in making Steel and Alloy Forged Machined Components 2) Machined Components made from ferrous & Non-ferrous
3) Shock Absorbers Piston Rods, Outer shell, Pistons, Tubes for all applications 4) Three-Point Linkages for Tractor Industries
5) Highly precision machined components from the bright bar. 6) Forged Machined components
7) Brass, Aluminum and Stainless Steel components 8) Sheet metal components
C. Our Esteemed Clients
1) Uniparts India Limited. (Noida & Vishakapatnam )
2) Gabriel India Limited (Gurgaon, Parwanoo, Dewas, Pune & Hosur) 3) Simplest India Pvt. Ltd. ( Noida & Itlay )
4) Escorts Group (ASP & RED) 5) Rico Auto Ind. Ltd.
6) New Holland Tractors India Pvt. Ltd.(CNH) 7) Knorr Bremse
8) Shriram Piston & Rings Ltd. 9) Saboo Hema India Ltd.
10)M/S Chang Yun India Pvt. Ltd. (Anand Group Japenese Technical Collaboration)
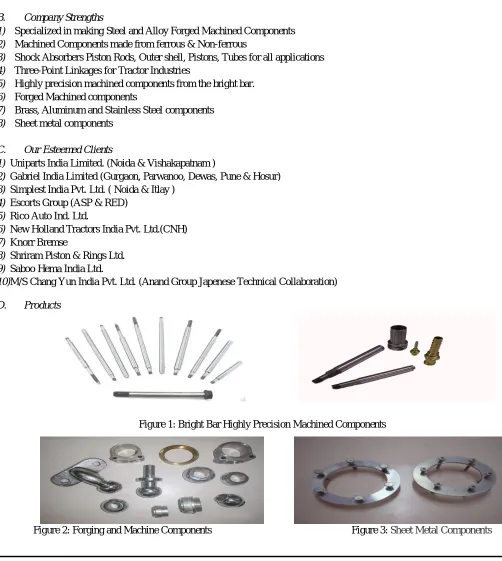
D. Products
Figure 1: Bright Bar Highly Precision Machined Components
[image:3.612.44.546.193.754.2]
E. Machines Used 1) CNC Machines
2) Induction Hardening Machines 3) Vertical Induction Hardening Machine 4) Horizontal Induction Hardening Machine 5) Milling Machine
6) Grinding Machines 7) Thread Rolling 8) Polishing Machine
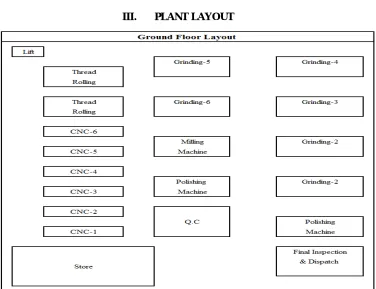
[image:4.612.121.497.193.482.2]III. PLANT LAYOUT
Figure 4: Ground Floor Layout
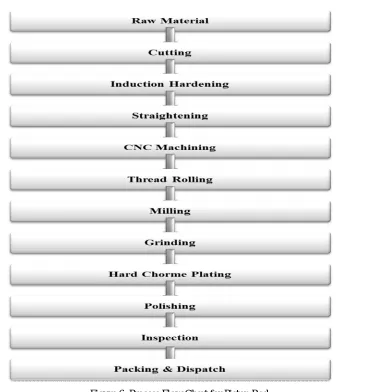
IV. PROCESS FLOW CHART FOR PISTON ROD
Figure 6: Process Flow Chart for Piston Rod
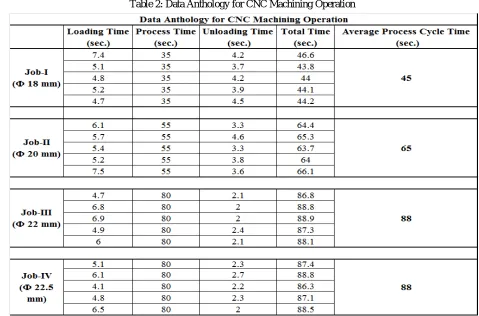
V. DATA ANTHOLOGY
For data anthology, we have selected below mentioned four main machining processes out of a number of process (as described above in Figure 6) for four different diameters of jobs (pistons).
[image:5.612.157.447.561.720.2]On behalf of the above-selected process chart (Figure 7) the anthologized data is as below mentioned
Table 1: Data Anthology for Straightening Operation
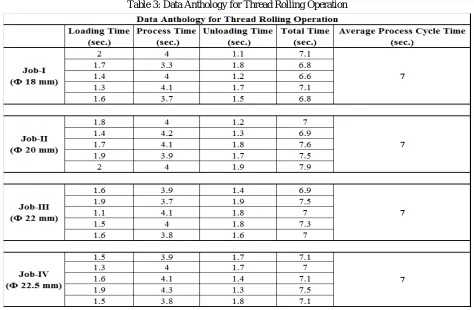
[image:6.612.64.543.428.744.2]Table 3: Data Anthology for Thread Rolling Operation
The below-mentioned table showed the final compiled data and converted in flow shop scheduling problem for further analysis purpose:
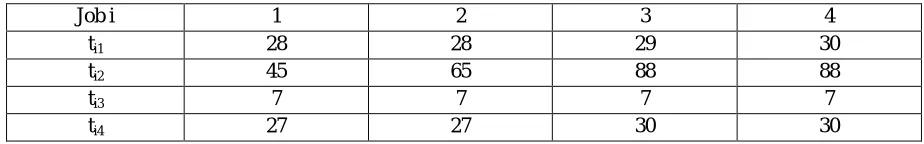
Table 5: Final Compiled Anthologized Data
Job i 1 2 3 4
ti1 28 28 29 30
ti2 45 65 88 88
ti3 7 7 7 7
ti4 27 27 30 30
Here,
Job i = Job list from Piston Rod 1 to Piston Rod 4 = J1 (ϕ18 mm), J2 (ϕ20 mm), J3 (ϕ22 mm), J4 (ϕ22.5 mm) ti1 = process time on machine 1 (Straightening)
ti2 = process time on machine 2 (CNC Machining)
ti3 = process time on machine 3 (Thread Rolling)
ti4 = process time on machine 4 (Milling)
VI. METHODOLOGY ADOPTED FOR MATHEMATICAL & GRAPHICAL MODELING OF
A. Data Anthology
As we are dealing with a flow shop scheduling problem, we will implement below-mentioned advance methods for the validity and effectiveness of our result in comparison with the existing one:
1) Mathematical Modeling by using “Approximate (heuristics) methods” for minimizing makespan Palmer’s Algorithm.
a) CDS (Campbell Dudek Smith) Algorithm. b) RA (Rapid Access) Algorithm
c) NEH (Nawaz Ensore Ham) Algorithm.
2) Graphical Modeling by using “Gantt Chart” for the comparative study of existing and calculated makespan.
The above methodologies along with conclusion and result will be presented and published in our third and final paper in this series of our M.Tech. Dissertation Work.
VII. ACKNOWLEDGEMENT
This research was supported by Faculty of Mechanical Engg. Department of Manav Rachna University, Faridabad (Haryana). We thank our colleagues from Mr. Pradeep Kumar Mouria and Mr. Gianender who provided insight and expertise that greatly assisted the research.
This research was partially supported by ARC Machine Tools Pvt. Ltd., Faridabad (Haryana). We thank Mr. Ashok Tomar - Production Head, for granting permission to visit the company for our research and for sharing their pearls of wisdom with us during the course of this research.
We thank Dr. Rakesh Kumar for assistance with selection and implementation of techniques and methodologies and also for comments that greatly improved the manuscript. We are also immensely grateful to him for their comments on an earlier version of the manuscript, although any errors are our own and should not tarnish the reputations of these esteemed persons.
REFERENCE
[1] https://www.snapsurveys.com/blog/qualitative-vs-quantitative-research/
[2] Raja Vinesh (2008), “Reverse Engineering: An Industrial Perspective,” Springer, pp. 1-9.
[3] Singh, Ramandeep (2013). “A Review of Reverse Engineering Theories and Tools,” International Journal of Engineering Science Invention, Volume 2, Issue 1, pp. 35-38.
[4] Jovanovic, Jelena R. et al. (2014). “Manufacturing Cycle Time Analysis and Scheduling to Optimize its Duration,” Journal of Mechanical Engineering 60 (2014) 7-8, pp. 512-524.