The authors are grateful for the financial support provided partially by the National Natural Science Key Foundation of China under Contract No. 51035008
Utilizing Data from a Sensorless AC Variable Speed Drive for Detecting
Mechanical Misalignments
Samieh Abusaad
1, Ahmed Benghozzi
1, Yimin Shao
2,Fengshou Gu
1, Andrew
Ball
11Centre for Efficiency and Performance Engineering, University of Huddersfield, Huddersfield, U.K.
2State Key Laboratory of Mechanical Transmission, Chongqing University, P.R. China.
Corresponding E-mail: [email protected]
Keywords: Condition monitoring, Diagnosis, Shaft Misalignment, Sensorless Variable Speed
Drive, Model based fault detection method.
Abstract. Conventional condition monitoring techniques such as vibration, acoustic, ultrasonic and thermal techniques require additional equipment such as sensors, data acquisition and data processing systems which are expensive and complicated. In the meantime modern sensorless flux vector controlled drives can provide many different data accessible for machine control which has not been explored fully for the purpose of condition monitoring. In this paper polynomial models are employed to describe nonlinear relationships of variables available from such drives and to generate residuals for real time fault detection and performance comparisons. Both transient and steady state system behaviours have been investigated for optimal detection performance. Amongst 27 variables available from the drive, the torque related variables including motor current, Id, Iq
currents and torque signals show changes due to mechanical misalignments. So only these variables are explored for developing and optimising detection schemes. Preliminary results obtained based on a motor gearbox system show that the torque feedback signal, in both the steady and transient operations, has the highest detection capability whereas the field current signal shows the least sensitivity to such faults.
1. Introduction
Shaft misalignment in rotating machinery is one of the most common problems in machines. Misalignments may cause a lower operating efficiency and in the long-run it can result in catastrophic failures due to additional stress and vibration on bearings and shafts; so a badly aligned machine can cost a factory 20% to 30% [1]. Several methods have been studied and examined aiming at developing more cost effective and early fault detection schemes in rotor systems. In most cases, these methods can be based on vibration [1, 2], wireless sensors [3, 4], stator current analysis [5], temperature/thermal image [6, 7], motor current signature analysis (MCSA) [8, 9], acoustic emission and lubrication oil analysis [8, 10]. Unfortunately, none of these methods can always be fully utilized because of high cost, low reliability and unsatisfactory accuracy [5, 10].
The main objective of this paper is to study the potential of using the data obtainable from a commercial VSD for mechanical fault detection in a multi-stage gearbox transmission system through a model based detection approach. The behaviour of the control system is analysed by considering stator current, torque, field and torque current components and power signals. The capability of these signals is examined by analyzing its transient and steady state operations based on the developed polynomial models. The work includes identifying the optimal variables that will be more effective in detecting mechanical misalignments of different severities.
2. Test facility and method
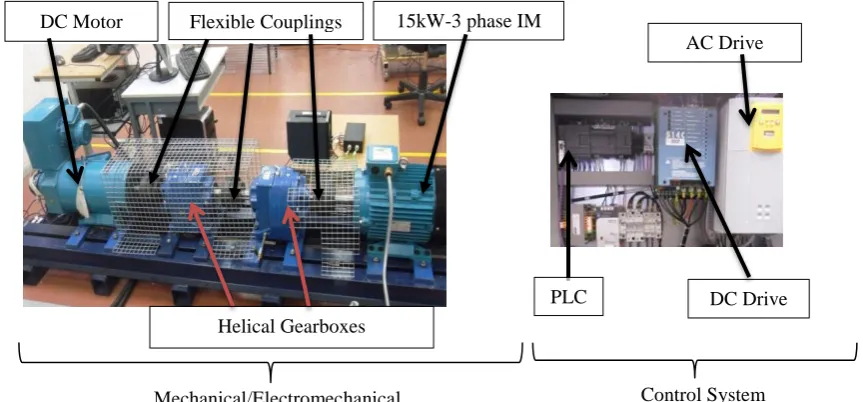
part and the electrical control part. The mechanical part consists of a 15kW AC induction motor as the prime driver, two back-to-back 2 stage helical gearboxes for coupling the DC motor with flexible spider rubber couplings. The first gearbox operates as a speed reducer while the second is a speed increaser so that the system maintains sufficient speed for loading. The control system consists of a programmable logic controller (PLC) for setting up test profiles requested by the operator, an AC variable speed drive (VSD) under sensorless flux vector control mode for controlling the speed of the system, a DC variable speed drive (VSD) providing a controlled variable load on the AC motor by regulating the torque of the DC motor/generator. In addition, two data acquisition systems are employed to log the data from both the sensorless flux vector control and PLC.
[image:2.595.119.539.193.648.2][image:2.595.105.537.200.401.2]
Figure 1 Test rig construction
Figure 2 Schematic of test system
As shown in Fig 2, designed test programs are entered into the test rig via a touch screen interface to the PLC. Settings include speed, load set-points and time duration for each operating cycle. Up to 15 cycles can be programed. When the user starts the test, the PLC sends the required values to both the AC and DC VSD.
The AC VSD obtains the required speed from the PLC and precisely runs the AC motor at this speed, benefits from the built in PID controller and uses the Model Reference Adaptive System
Helical Gearboxes
Mechanical/Electromechanical Control System DC Motor Flexible Couplings 15kW-3 phase IM
AC Drive
DC Drive PLC
DC VSD
15kw IM DC Motor
Two stage helical
gearboxes Flexible coupling Flexible
coupling
AC VSD
Touch Screen
PLC
Data Acquisition
System
Encoder
Analysis
Computer Data from
(MRAS), which allows steady operation of the AC motor even at a high starting torque by using a motor model which continually simulates the motor operation instead of receiving a speed feedback from an encoder or the tachometer.
The DC drive receives the load set-points from the PLC and subsequently provides the control signal to the DC motor so that it produces the required load onto the AC motor. This is achieved by regulating the armature and field currents of the DC motor using two phases of the three phase supply. As the DC motor currents vary, the load onto the AC motor varies proportionally. This provides the ability to study the control system’s behaviour under different speed and load conditions as well as the transient process between different conditions. With these facilities, tests can also be repeated within exactly the same load and speed condition.
Moreover, almost all data inside the AC drive are obtained and monitored via P3 port of the drive using the DSELite software. All data collected by the data acquisition system are stored in a PC for post processing and analysis using a Matlab program.
3. Development of detection approaches
A. Data Characteristics. Tests carried out are based on a variable speed and a constant load operating profile, as illustrated in Fig.3, to simulate VFD possible operating conditions. During each test the speed is set to 20%, 40%, 60%, 80% and 100% of full speed, each of which operates 1 minute, while the load is fixed during the test. The load is changed every test, taking the values of 0%, 40%, and 80%. Before any data is collected the system is tuned to produce the minimal level of vibration. Under this condition, data is then collected and taken as the baseline for comparison with different faults induced subsequently. To evaluate the performance of using control data, three different levels of parallel misalignment were induced by moving the DC motor from its optimal position by 0.5 mm, 1.00 mm and 1.80 mm and corresponding data was collected under identical operating conditions.
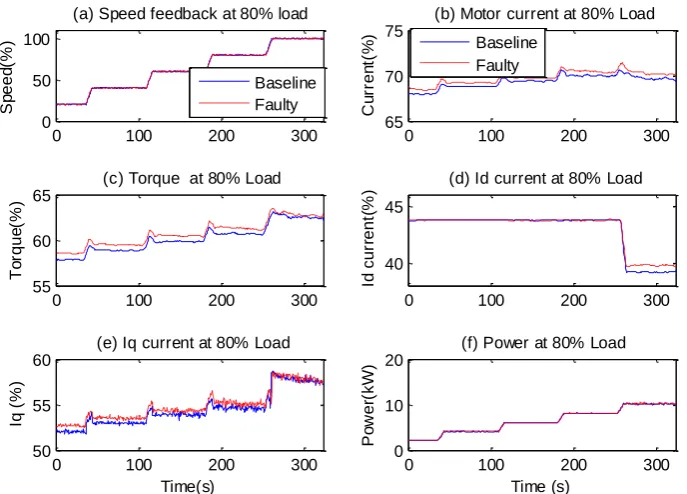
[image:3.595.124.468.429.676.2]Figure 3 Data sets for baseline and 1.0mm misalignment under 80% load
Fig. 3 presents a representative data set of several common variables under both baseline and a faulty case. It can be seen that both speed related and torque related variables show clear changes for different speed steps set in the test. However, comparing between the baseline and the faulty case shows that load related variables such as torque in Fig 3 (c), motor current Fig 3 (b) and Iq
0 100 200 300
0 50 100
S
p
e
e
d
(%
)
(a) Speed feedback at 80% load
Baseline Faulty
0 100 200 300
55 60 65
(c) Torque at 80% Load
T
o
rq
u
e
(%
)
0 100 200 300
50 55 60
(e) Iq current at 80% Load
Time(s)
Iq
(
%
)
0 100 200 300
65 70 75
(b) Motor current at 80% Load
C
u
rr
e
n
t(
%
)
Baseline Faulty
0 100 200 300
40 45
(d) Id current at 80% Load
Id
cu
rr
e
n
t(
%
)
0 100 200 300
0 10 20
(f) Power at 80% Load
Time (s)
P
o
w
e
r(
kW
current Fig. 3(e) show slightly higher amplitudes through all operating periods, giving high potential for fault detection. On the other hand, the speed shown in Fig. 3(a) and its related variables such as power Fig. 3(f) show little changes between baseline and faulty case. In particular the speed data is nearly the same. This is due to the fact that the AC VSD is designed to maintain the required speed regardless of any load or speed disturbances. From the point of view of fault detection and diagnosis, the speed variation due to faults is masked by the control process and may not be suitable for mechanical fault detection.
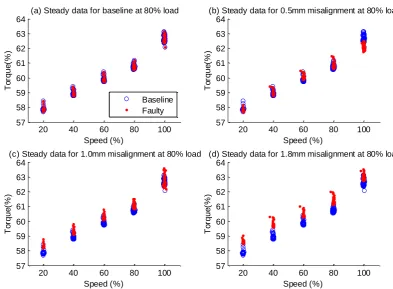
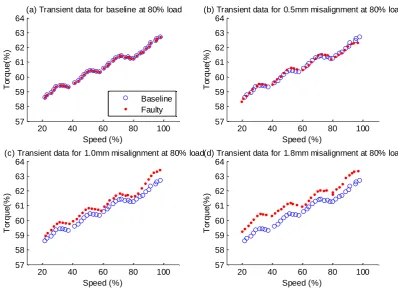
[image:4.595.101.495.326.615.2]Further study of the data in Fig. 4 has found that there are clear transient effects during speed changes. This may indicate that more control efforts are required in the transient process and hence it may have more information for fault detection as the misalignment has more disturbances. By separating the transient data from the steady data through setting a threshold to speed change rate, Fig. 4 and Fig. 5 show respectively the torque versus speed in the steady process and the transient process for all data cases. From these figures it can be observed that the data from transient process may be better for fault detection because of its bigger changes, even though the data in steady process also shows clear changes between the baseline and the faulty cases. In addition, the data in both processes shows a gradual increase trend with an increase in misalignment levels. So they may be used for fault classification.
Figure 4 Torque data behavior during steady period at 80% load
B. Polynomial model based detection. As shown in Fig. 4 and 5 torque signals are affected by the existence of misalignments. Both steady and transient responses of faulty sets have shown differences to that of healthy data sets. Similarly, the same variations have been observed in other variables. However, it seems difficult to distinguish the fault when it is as small as 0.5mm. Moreover, a set of variables that produce optimal detection also need to be identified for real-time implementation. Therefore, polynomial models have been developed to describe the relationship between these variables and the speed under both the transient and steady state operations. Based on the fundamental connection between torque related variables and speed, the order of models is set to
20 40 60 80 100
57 58 59 60 61 62 63 64
(a) Steady data for baseline at 80% load
Speed (%)
T
o
rq
u
e
(%
)
Baseline Faulty
20 40 60 80 100
57 58 59 60 61 62 63 64
(b) Steady data for 0.5mm misalignment at 80% load
Speed (%)
T
o
rq
u
e
(%
)
20 40 60 80 100
57 58 59 60 61 62 63 64
(c) Steady data for 1.0mm misalignment at 80% load
Speed (%)
T
o
rq
u
e
(%
)
20 40 60 80 100
57 58 59 60 61 62 63 64
(d) Steady data for 1.8mm misalignment at 80% load
Speed (%)
T
o
rq
u
e
(%
4 for describing the nonlinear correlation and then it is trained using the baseline data. Subsequently, the model is used to generate residuals for different condition cases. The residual from baseline is taken as the detection threshold for differentiating different faulty cases.
Figure 5 Torque data behavior during transient period
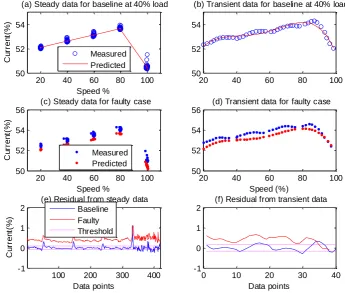
Fig. 6 shows a typical model based detection process performed on the current data sets between the baseline and 1.00mm misalignment under 40% load. For the steady operation, the model produces a lower current prediction than the measured ones. It means that more current is required under the same load and speed conditions to indicate the system is abnormal. Moreover, this abnormality can be clearly observed from the residual data based detection shown in Fig. 6 (e) in which the residual data from the faulty case exceeds the threshold developed according to mean squired error during modelling process. In addition, the residual data shows higher amplitude in high speed operation, showing that it needs more current in higher load conditions due to higher energy dissipation of coupling element and bearing friction. For the speed transient operation, the model prediction and residual data exhibit similar behaviour with that of the steady process. However, it does not show clear differences as expected earlier and is difficult to make a judgement on which is better in detecting the fault.
C. Optimal detection variables. To make a comparison of detection performance based on the two types of data and between different variables, a performance index parameter is defined based on the residual data as
̅̅̅̅ ̅̅̅
√
(1)
Where ̅ and ̅are the residual mean for baseline and faulty data respectively, and and are the standard deviation of baseline residual data and faulty residual respectively. Obviously, the larger the mean difference and the smaller the variance the better the performance in separating two set of data. In addition, because the original data is normalised, the amplitude from equation (1) can be directly compared between different variables.
20 40 60 80 100
57 58 59 60 61 62 63 64
(a) Transient data for baseline at 80% load
Speed (%)
T
o
rq
u
e
(%
)
Baseline Faulty
20 40 60 80 100
57 58 59 60 61 62 63 64
(b) Transient data for 0.5mm misalignment at 80% load
Speed (%)
T
o
rq
u
e
(%
)
20 40 60 80 100
57 58 59 60 61 62 63 64
(c) Transient data for 1.0mm misalignment at 80% load
Speed (%)
T
o
rq
u
e
(%
)
20 40 60 80 100
57 58 59 60 61 62 63 64
(d) Transient data for 1.8mm misalignment at 80% load
Speed (%)
T
o
rq
u
e
(%
Figure 6 Predicted and measured data in steady and transient processes of current signals at 40% load with 1.00 mm misalignment
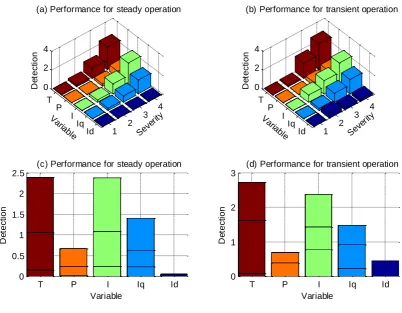
Fig. 7 presents comparison results for all torque related variables. As can be seen from the graphs the differences of the performance parameter between healthy and faulty signals are quite clear for both steady and transient data sets. Moreover, the differences are also clear between different faulty cases except for Id. These show that either of variables can be used for both
misalignment detection and severity diagnosis.
Furthermore, the feedback torque signal produces the highest detection capability for both types of data. However, when the misalignment is as small as 0.5 mm the stator current gives better detection. While Iq has obtained good detection capability for 1.0 mm and 1.8 mm misalignments.
In all cases, Id has shown the poorest detection ability over the different test situations. This is
understandable as under the normal operation conditions Id is independent of load variation. Thus it
is not influenced by load disturbances due to misalignments. Surprisingly, the steady data outperforms the transient data.
4. Conclusion
The study shows that it is feasible to use signals from a sensorless flux vector control drive for mechanical misalignment fault detection. For real time implementation, polynomial models can be employed to describe nonlinear relationships of variables available and generate residuals for fault detection and performance comparisons. From analytic studies it is understood that shaft misalignments mainly cause deviations to torque related variables such as motor current, Id, Iq
current and torque signals. So only these variables are useful in developing the model based detection scheme and identifying the optimal variables. Applying the model based method to experimental data sets from a motor-gearbox drive system has found that the developed model and detection approach for the variables of interest can discriminate between different misalignment
20 40 60 80 100
50 52 54
Speed %
C
u
rr
e
n
t(
%
)
(a) Steady data for baseline at 40% load
Measured Predicted
20 40 60 80 100
50 52 54 56
Speed %
C
u
rr
e
n
t(
%
)
(c) Steady data for faulty case
Measured Predicted
100 200 300 400
-1 0 1 2
(e) Residual from steady data
Data points
C
u
rr
e
n
t(
%
) BaselineFaulty
Threshold
20 40 60 80 100
50 52 54
(b) Transient data for baseline at 40% load
20 40 60 80 100
50 52 54 56
Speed (%)
(d) Transient data for faulty case
0 10 20 30 40
-1 0 1 2
(f) Residual from transient data
severities, showing that it is feasible to use any of the torque related variables for monitoring misalignments.
Figure 7 Detection and diagnosis comparison between variables and data types
Moreover, both transient operation data and steady operation data yield similar detection and diagnosis performance. However, the comparison between different variables shows that the feedback torque signal has the highest detection capability whereas the field current signal shows the least sensitivity to such faults. It means that the torque signal is the best one for detecting the misalignment problem. Obviously, substantial studies in using data from AC variable speed drives are needed to fuse different variables for detecting and diagnosing more complicated fault cases such as motor faults, gearbox deterioration and system looseness and their combinations.
References
[1] I. Ahmed, M. Ahmed, K. Imran1, M. Shuja. Khan, T. Akram1, M. Jawad1, Spectral analysis of misalignment in machines using sideband components of broken rotor bar, Shorted Turns and Eccentricity, International Journal of Electrical & Computer Sciences IJECS-IJENS Vol: 10 No: 06 (2010).
[2] S Nagrani, S. S. Pathan, I. H. Bhoraniya, Misalignment fault diagnosis in rotating machinery through the signal processing technique- signature analysis, International Journal of Advanced Engineering Research and Studies E-ISSN2249–8974, (2012).
[3] L. Arebi, F. Gu and A. Ball, A comparative study of misalignment detection using a novel Wireless Sensor with conventional Wired Sensors, 25th International Congress on Condition Monitoring and Diagnostic Engineering, (2012).
Id Iq I P T
1 2 3 4 0
2 4
Seve rity (a) Performance for steady operation
Va ria
ble
D
e
te
ct
io
n
Id Iq I P T
1 2 3 4 0
2 4
Seve rity (b) Performance for transient operation
Va ria
ble
D
e
te
ct
io
n
Id Iq I
P T
0 0.5 1 1.5 2 2.5
(c) Performance for steady operation
Variable
D
e
te
ct
io
n
Id Iq I
P T 0 1 2 3
(d) Performance for transient operation
Variable
D
e
te
ct
io
[4] L. Arebi, F. Gu, N. Hu, and A. Ball, Misalignment detection using a wireless sensor mounted on a rotating shaft, 24th International Congress on Condition Monitoring and Diagnostics Engineering Management. COMADEM, Stavanger, Norway, pp. 1289-1299. ISBN 0954130723, (2011).
[5] M. Blödt, P. Granjon and B. Raison, J. Regnier, Mechanical fault detection in induction motor drives through stator current monitoring - theory and application examples fault detection, Wei Zhang (Ed.), ISBN: 978-953-307-037-7, InTech, (2010).
[6] W. K. Wong, P. N. Tan, C. K. Loo and W. S. Lim, Machine condition monitoring using omnidirectional thermal imaging system, IEEE International Conference on Signal and Image Processing Applications, (2009).
[7] J. T. Suomela, Condition monitoring of paper machine with thermal imaging, Proceedings of SPIE Vol. 4710, (2002).
[8] L. D. Hall, D. Mba and R.H. Bannister, Acoustic emission signal classification in condition monitoring using the Kolmogorov-Smirnov statistic, Journal of Acoustic Emission, Vol. 19, pp 209- 228, (2001).
[9] H. C. Pusey, Turbomachinery Condition monitoring and failure prognosis, Sound and Vibration Magazine, (2007).