IJPSR (2013), Vol. 4, Issue 11 (Research Article)
Received on 22 June, 2013; received in revised form, 25 July, 2013; accepted, 25 October, 2013; published 01 November, 2013
FORMULATION & OPTIMIZATION OF SUSTAINED RELEASE MATRIX TABLETS OF SIMVASTATIN USING RESPONSE SURFACE METHODOLOGY
Disha Kesharwani*1, Gunjan Kalyani 1, Anchal Verma 1, Priyanka Dewangan 1, Shailendra P. Kela 1 and Chandra Patro 2
Royal College of Pharmacy 1, Raipur, Chhattisgarh, India
Roland Institute of Pharmaceutical Sciences 2, Behrampur, Orissa, India
ABSTRACT: The aim of the work is to formulate sustained release matrix tablets of simvastatin and to optimize them using Response Surface Methodology. The tablets were prepared by direct compression method and evaluated as per pharmacopoeia methodology. A central composite design for 2 factors at 3 levels each was employed to systematically optimize drug release profile. Concentration of HPMC K15M (X1) and PVP K30 (X2) were taken as the independent variables and the in vitro dissolution (Y1), t50% (Y2) and mean dissolution time (Y3) as dependent variables. Response surface plots and contour plots were drawn, and the optimum formulations were selected by feasibility and grid searches. Both the polymers had a significant effect on drug release from the tablets. The formulations were followed Higuchi drug kinetics and diffusion was the prime mechanism of drug release. The polynomial mathematical models produce for various response variables using the regression analysis and were found to be statistically significant (P< 0.05). Optimization study was validated using 8 confirmatory runs, indicated very high degree of predictive ability of response surface methodology with mean percentage error 0.197 ± 0.017.The results of multiple linear regression analysis revealed that the sustained release tablets can be prepared using an optimum concentration of HPMC K 15 and PVP K30. Contour plot is presented to represent graphically the effect of the independent variables on the dependent variables selected.
INTRODUCTION: In the development of sustained release matrix tablets optimization of dosage form is an important factor. For optimization many statistical experimental designs have been recognized as useful technique.
QUICK RESPONSE CODE
DOI:
10.13040/IJPSR.0975-8232.4(11).4351-61
Article can be accessed online on:
www.ijpsr.com
As an important subject in the statistical design of experiments, the Response Surface Methodology (RSM) is a collection of mathematical and statistical techniques useful for the modeling and analysis of problems in which a response of interest is influenced by several variables and the objective is to optimize the response. It is a set of mathematical and statistical techniques for analysis designed to create a mathematical model to efficiently explore any variable. Response-surface methodology comprises a body of methods for exploring the optimum operating conditions Keywords:
Central composite design, HPMC K15M, PVPK30, % Drug released,
t50%, MDT, Sustained release Correspondence to Author: Disha Kesharwani
Royal College of Pharmacy, Raipur, Chhattisgarh, India
E-mail:
through experimental methods 1-8. It is based on the principle of design of experiments (DoE). Different types of Response Surface methods include 3-level Factorial Design, Central Composite Design (CCD), Box- Behnken Design, and D- Optimal Design. The technique is very advantageous as it requires minimum experimentation and is very effective and cost effective 9.
Simvastatin (SIM) 1S,3R,7S,8S,8aR)-8-{2- [(2R,4R)-4-hydroxy-6-oxooxan-2-yl]ethyl}-3,7-dimethyl-1,2,3,7,8,8a-hexahydronaphthalen-1-yl 2,2-dimethylbutanoate is a crystalline compound, is practically insoluble in water and hence poorly absorbed from the GI tract. It is a potent and specific inhibitor of 3-hydroxy-3-methyl-glutaryl coenzyme A (HMG CoA) reductase, which catalyzes the reduction of HMG CoA to mevalonate.
Thus, simvastatin arrests a key step for cholesterol biosynthesis in the liver, and is hence widely used in the treatment of hypercholesterolemia and dyslipidemia, as an adjunct to diet. After oral administration, simvastatin is metabolized to its b -dihydroxy acid form (simvastatin acid) by the
cytochrome-3A system in liver, where it inhibits the rate-limiting step in cholesterol biosynthesis. It is mainly indicated in the treatment of hypercholesterolemia.
The drug is also indicated in the treatment of atherosclerosis, atherosclerotic plaque etc. 10-13. Hydroxy propyl methyl cellulose (HPMC) is widely used as a hydrophilic matrix base to prolong the release of the drug due to its rapid hydration, good compression properties, and gelling characteristics. Along with it is easily available and less toxic. It regulates the release of drug by controlling swelling and cross linking 14- 15.
EXPERIMENTAL:
Materials: Simvastatin was provided from Lupin Ltd (Research Park) Pune (India) and HPMC K15M and PVP K 30 were provided from HiMedia Laboratories Pvt. Ltd., Mumbai. Pearlitol SD 200 was obtained from Alembic Ltd., Vadodara, Mg Stearate, aerosil, talc were provided from Lobachem, Mumbai.
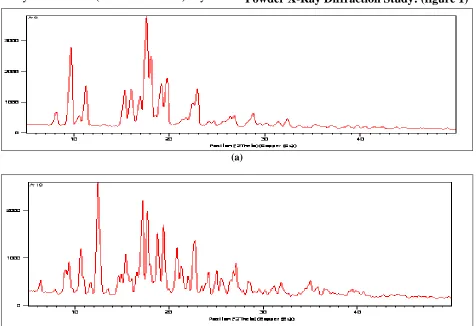
Powder X-Ray Diffraction Study: (figure 1)
(a)
[image:2.612.69.545.391.717.2](b)
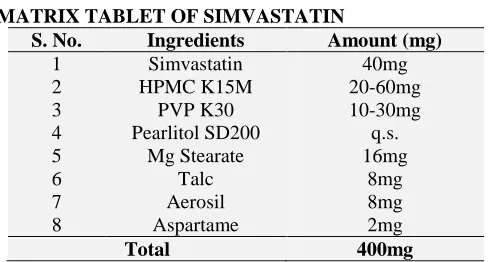
Preparation of Sustained Release Matrix Tablets of Simvastatin: Preparation of Sustained release matrix tablets was done by direct compression method. Table 1 enlists the composition of different sustained release formulations prepared using varying amounts of the polymers (i.e., HPMC K15M and PVP K30) and pearlitol SD200 as the diluent, along with the magnesium stearate, talc and aerosil as the lubricants.
[image:3.612.322.556.222.474.2]The drug and the excipients were homogeneously blended and subsequently compressed into a flat-faced tablets (400 mg, 12 mm diameter) using single-punch tablet compression machine (Cadmach, Ahmedabad, India).
TABLE 1: COMPOSITION OF SUSTAINED RELEASE MATRIX TABLET OF SIMVASTATIN
S. No. Ingredients Amount (mg)
1 Simvastatin 40mg
2 HPMC K15M 20-60mg
3 PVP K30 10-30mg
4 Pearlitol SD200 q.s.
5 Mg Stearate 16mg
6 Talc 8mg
7 Aerosil 8mg
8 Aspartame 2mg
Total 400mg
Experimental Design: A CCD with α = 1 was employed as per the standard protocol. The amounts of HPMC (X1) and PVP K30 (X2) were selected as independent variables, studied at 3
levels each. The central point (0, 0) was studied in quintuplicate. Other formulations and processing variables were kept invariant throughout the study. Table 2 enlists an account of the 13 experimental runs studied, their factor combinations, and table 3 summarizes the translation of the coded levels to the experimental units employed during the study.
The % drug release at 24 hours, Time is taken to release 50% of the drug (t50%); Mean Dissolution Time (MDT) was taken as the response variables.
TABLE 2: FACTOR COMBINATION AS PER THE CHOSEN EXPERIMENTAL DESIGN
Trial No. Coded factor Levels
X1 X2
I -1 -1
II 0 -1
III 1 -1
IV -1 0
V 0 0
VI 1 0
VII -1 1
VIII 0 1
IX 1 1
X 0 0
XI 0 0
XII 0 0
XIII 0 0
TABLE 3: VARIABLES IN 32 CENTRAL COMPOSITE DESIGN Independent variable, factors
Low (-1) (%)
Levels Used
Medium (0) (%) High (+1) (%) X1 : Concentration of HPMC K15M 5 10 15 X2: Concentration of PVP K30 2.5 5 7.5
Dependent variables, responses Y1: % Drug release at 24 Hr Y2: Time to release 50% of drug (t50%)
Y3: Mean Dissolution Time (MDT)
Evaluation:
[image:3.612.50.295.279.410.2]Post-compression Parameters:
1. Thickness Test: Thickness of tablets was determined using Vernier’s caliper. For each batch five tablets were used and thickness was calculated.
2. Hardness Test: The hardness was determined by using the Monsanto hardness tester.
3. Friability Test: The friability was measured using a Friability tester (Electro Lab). Ten tablets were weighed, rotated at 25 rpm or 4 minutes. Tablets were reweighed after removal of fines (dedusted) and the percentage of weight loss was calculated.
4. Weight Variation test: Twenty tablets were randomly selected from each formulation, independently weighed, the average weight and standard deviation was determined 17-18.
5. Drug Content Test: Twenty tablets from each batch were powdered and weighed accurately equivalent to 100 mg of Simvastatin. The drug content was determined using the standard calibration curve.
The percent drug content was determined as an average of three determinations. Weighed quantity of powder samples was diluted suitably and analyzed at 247nm for cumulative drug release using UV-Visible spectrophoto-meter 18.
6. Dissolution Study: Dissolution parameters: Apparatus - USP 2, Rotation Speed – 50 RPM, Dissolution Medium- Phosphate Buffer pH 7.0 containing 0.5%SLS, Time Interval- 30 min, 1 hr, 2 hr, 4 hr, 6 hr, 8 hr, 12 hr, 16 hr, 20hr, 24hr.
a. Procedure: - Dissolution was carried out using Phosphate buffer pH 7.0 containing 0.5% SLS prepared by dissolving 30 gm of sodium dodecyl sulphate and 8.28 gm of monobasic sodium phosphate in 6000ml of distilled water and adjusting with 50% (w/v) NaOH solution to a pH of 7.0, 900ml. 10 ml of test solution was filtered and transferred to a centrifuge tube containing about 10 mg of prewashed manganese dioxide/ml.
The mixture was allowed to stand for 30 minutes with occasional shaking, centrifuged and a portion of the clear solution was used as the test solution. The absorbance was measured spectrophotometrically of the above test solution at about 247 nm and at 257 nm.
The amount of C25H38O5 dissolved was
determined from the difference between the UV absorbance at the wavelength of maximum and minimum absorbance at about 247nm and 257 nm respectively 19.
Determination of t50%: The t50% is determined
by plotting a graph between Cumulative % drug released and time. Calculation of Mean Dissolution Time (MDT) 20-22:The mean time for the drug to dissolve is called as the mean dissolution time.
--- (1)
Here,
i = dissolution sample number.
n = no. of dissolution sampling times.
Tmid = midpoint time between Ti and Ti-1.
∆m = amount of simvastatin dissolved between times Ti and Ti-1.
Polynomial Equations for different Responses:
Mathematical relationship generated using regression analysis of the studied response
variables are expressed as equations.
Y1= 88.76 - 4.42 X1 - 8.11 X2 + 0.19 X1 X2 - 1.65
X12 + 0.56 X22 ……… (2)
Y2 = 10.95 + 1.57 X1+ 2.43 X2 - 0.72 X1 X2 -
0.37 X12 + 0.23 X22 ……… (3)
Y3 = 9.53 + 0.63 X1 + 0.73 X2 - 0.20 X1 X2 - 0.24
TABLE 5: MODELING OF THE RESPONSES IN THE EXPERIMENTAL DESIGN
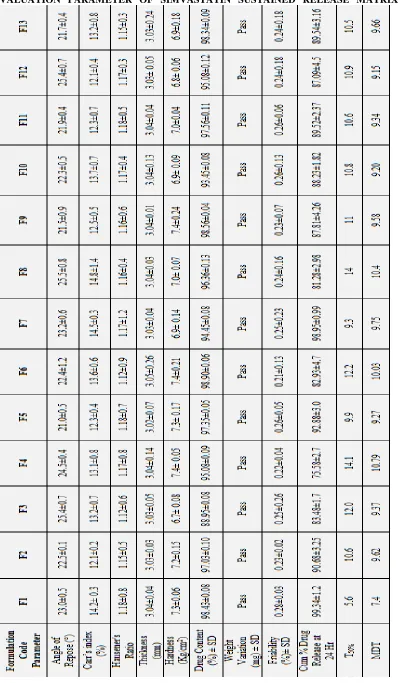
RESULTS AND DISCUSSION: Direct compression method was used because of its ease of manufacture and lower cost. A response surface model central composite design with 2 independent variables at 3 different levels was used to study the effects on the dependent variables. All the batches of dispersible tablets were evaluated for different pre-compression and post-compression parameters and were passed all the parameters. The dependent variables (% Drug release at 24 hrs, t50% and MDT)
were obtained at various levels of the 2 independent variables (X1 and X2) (table 5, 6).
Based on the result obtained from this analysis and regression of statistically significant variables, statistical models were generated. Analysis of variance for the responses (ANOVA) indicated that assumed regression models were significant and valid for each of the responses. The results of analysis for each response variable were given below. From the equations it is clear that all the responses are strongly affected by the independent variables selected for the experiment. In polynomial equation the main effect terms (X1 &
X2) represent the average results of changing one at
a time from its low to high level.
The interaction terms (X1 * X2) show how the
responses change when 2 variables are simultaneously changed. The negative coefficient for both the independent variables indicate a favorable effect on % drug release after 24 hrs (i.e. Y1) while a positive coefficient for the interaction
term (X1 * X2) indicates an unfavorable effect on
Y1.
Similarly, the positive coefficient for both the independent variables in case of Y2 and Y3 indicate
a favorable effect on the responses while a negative coefficient for the interaction terms indicates an unfavorable effect on Y2 and Y3 23.
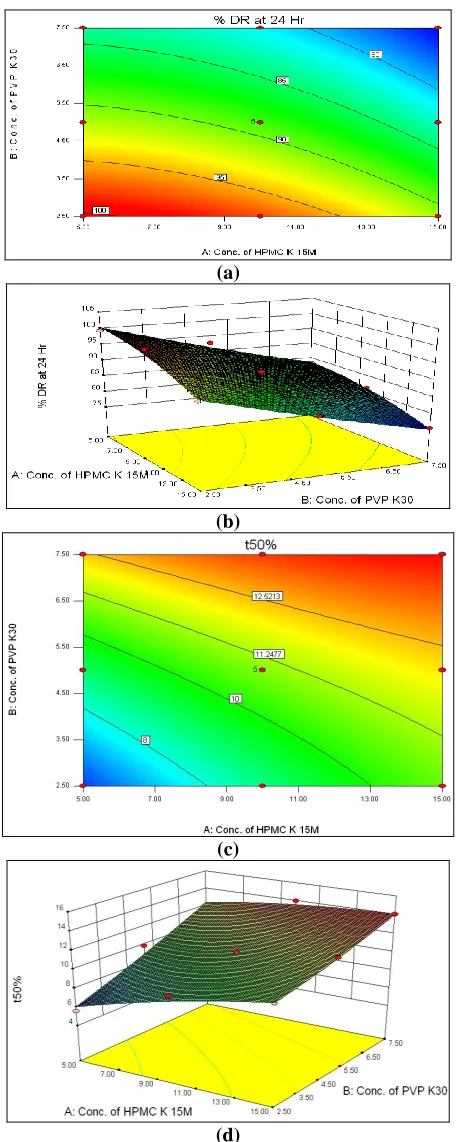
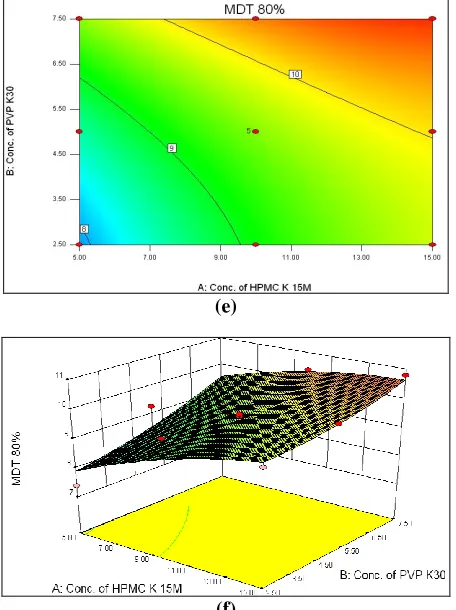
Analysis of Data: The regression equations (eq. 2, 3, & 4) are presented in the form of contour plots and response surface plots in fig. 2 showing the influence of independent factors on responses.
(a)
(b)
(c)
[image:6.612.325.553.182.753.2](e)
(f)
FIG. 2: CONTOUR PLOTS AND 3D GRAPHS FOR THREE RESPONSES
As it can be seen from the plots and also from regression equation, as the concentration of both the polymers were increased the % of drug released at 24 hours get decreased. Polymer HPMC K15M (X1) was used as a hydrophilic matrix forming
agent because it forms a strong viscous gel on contact with aqueous media, which could be useful in sustaining the delivery of water soluble drugs (Inclusion complex of Simvastatin).
Also the PVP K30 is a hydrophilic matrix forming agent, it also forms a strong viscous gel on contact with aqueous media. The gel which is formed in contact with aqueous media, consists of closely packed swollen particles, strongly retards the release of drug from the matrix.
The formulations containing a relatively higher % of polymer showed less initial drug release due to the unavailability of drug molecules at the surface of the matrix. Whereas when the concentration of both the polymers was increased t50% and MDT were getting increased. From the regression equations it's also clear that the second variable i.e. concentration of PVP K30 influences all the three responses more as compared to first variable as the coefficient of X2 is greater than that of the X1 in all
the cases.
The values of t50% enhanced markedly from 5.6
hours, observed at low levels of both the polymers, to as high as 14.1 hours, observed at high levels of both the polymers which indicated a considerable release- retarding potential of the polymers (HPMC K15M and PVP K30) for simvastatin 24. MDT value is used to characterize the drug release rate from the dosage form and the retarding efficacy of the polymer.
[image:7.612.60.288.43.348.2]A higher value of MDT indicates a more drug retarding ability and vice-versa. It was observed that the MDT values enhanced from 7.4 hours to 10.79 hours with the increase of both the polymers.
TABLE 6: p- VALUES Source
Cum % DR at 24 Hour
(Y1) t50% (Y2) MDT (Y3)
F- Value p-Value F- Value p-Value F- Value p-Value Model 66.93 <0.0001 36.96 <0.0001 5.18 0.0263
X1 75.54 <0.0001 51.58 0.0002 14.00 0.0072 X2 254.18 <0.0001 124.43 <0.0001 10.39 0.0146
X1X2 0.093 0.7691 7.36 0.0300 0.69 0.4323
X12 4.84 0.0636 1.32 0.2889 0.69 0.4335
X22 0.56 0.4785 0.52 0.4957 0.41 0.5423
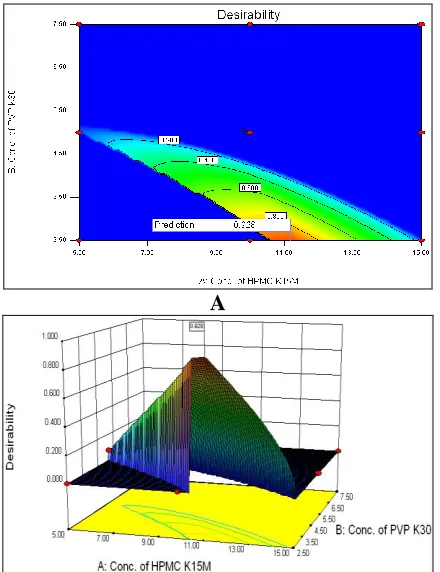
Validation and Optimization of the Formulation Parameters: To validate the model 8 check point formulations were prepared, evaluated for the responses and the experimental values obtained were compared with those predicted by the model. These plots (fig. 3a & b) are showing the desirable
area or the optimum area for the two factors in which the required responses can be obtained.
In each contour plot, the undesirable area is grayed- out and the yellow colored area that remains defines the final optimal factor setting. This yellow area is called the sweet spots.
A
[image:8.612.64.284.106.392.2]B
[image:8.612.329.548.198.669.2]FIG. 3: DESIRABILITY GRAPH (A) CONTOUR PLOT (B) 3D PLOT
FIG. 4: OVERLAY PLOT
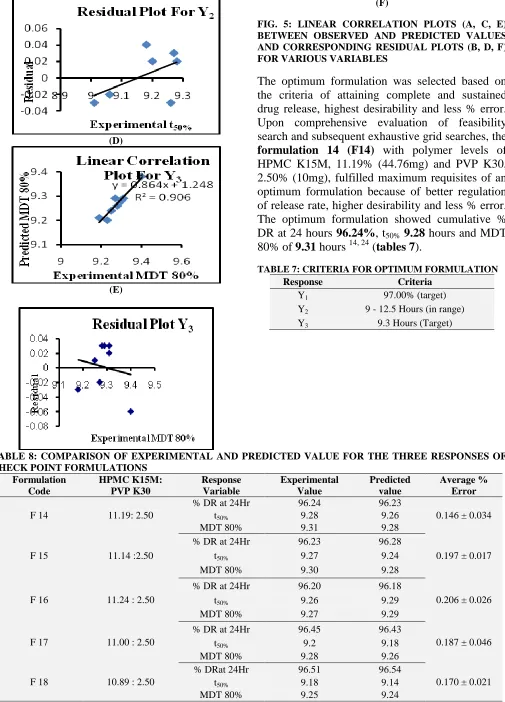
Validation of RSM Results: For all of the 8 checkpoint formulations, the results of the evaluation parameters were found to be within pharmacopeia limits. The check points compositions, their experimental and predicted values of all response variables, residuals and average % error in prognosis (Table 8). The linear correlation plots between the observed and predicted response variables, and the residual plots
showing the scatter of the residuals versus observed values in Figure 5. Upon comparison of the observed responses with that of the anticipated responses, the average % error variance between -0.775 ± 0.015 to 0.197 ± 0.017.
The linear correlation plots drawn between the predicted and observed responses demonstrated high values of correlation coefficients (ranging between 0.906 to 0.993), indicated excellent goodness of fit.
A
(B)
(D)
(E)
(F)
FIG. 5: LINEAR CORRELATION PLOTS (A, C, E) BETWEEN OBSERVED AND PREDICTED VALUES AND CORRESPONDING RESIDUAL PLOTS (B, D, F) FOR VARIOUS VARIABLES
The optimum formulation was selected based on the criteria of attaining complete and sustained drug release, highest desirability and less % error. Upon comprehensive evaluation of feasibility search and subsequent exhaustive grid searches, the formulation 14 (F14) with polymer levels of HPMC K15M, 11.19% (44.76mg) and PVP K30, 2.50% (10mg), fulfilled maximum requisites of an optimum formulation because of better regulation of release rate, higher desirability and less % error. The optimum formulation showed cumulative % DR at 24 hours 96.24%, t50% 9.28 hours and MDT
80% of 9.31 hours 14, 24 (tables 7).
TABLE 7: CRITERIA FOR OPTIMUM FORMULATION
Response Criteria
Y1 97.00% (target) Y2 9 - 12.5 Hours (in range) Y3 9.3 Hours (Target)
TABLE 8: COMPARISON OF EXPERIMENTAL AND PREDICTED VALUE FOR THE THREE RESPONSES OF CHECK POINT FORMULATIONS
Formulation Code
HPMC K15M: PVP K30
Response Variable
Experimental Value
Predicted value
Average % Error F 14 11.19: 2.50
% DR at 24Hr 96.24 96.23
0.146 ± 0.034
t50% 9.28 9.26
MDT 80% 9.31 9.28
F 15 11.14 :2.50
% DR at 24Hr 96.23 96.28
0.197 ± 0.017
t50% 9.27 9.24
MDT 80% 9.30 9.28
F 16 11.24 : 2.50
% DR at 24Hr 96.20 96.18
0.206 ± 0.026
t50% 9.26 9.29
MDT 80% 9.27 9.29
F 17 11.00 : 2.50
% DR at 24Hr 96.45 96.43
0.187 ± 0.046
t50% 9.2 9.18
MDT 80% 9.28 9.26
F 18 10.89 : 2.50
% DRat 24Hr 96.51 96.54
0.170 ± 0.021
t50% 9.18 9.14
[image:9.612.57.562.46.748.2] [image:9.612.53.557.508.750.2]F 19 10.75 : 2.50
% DR at 24Hr 95.71 96.69
-0.175 ± 0.009
t50% 9.06 9.08
MDT 80% 9.19 9.21
F20 10.66:2.50
% DRat 24 Hr 96.75 96.78
0.166 ± 0.018
t50% 9.01 9.04
MDT 80% 9.23 9.20
F 21 11.75 : 2.50
% DR at 24Hr 96.63 95.60
-0.775 ± 0.015
t50% 9.44 9.50
MDT 80% 9.4 9.38
CONCLUSION: Optimization of a sustained release matrix tablet is a complex process that necessitates one to consider a large number of variables and their interaction with each other. It was concluded that the Response Surface Methodology utilizing a polynomial equation can be successfully used to design a sustained release matrix tablet with predetermined release profile and with a small no. of experimental runs.
Highest degree of prognosis obtained using RSM corroborates that a 2-factor CCD is quite efficient in optimizing drug delivery systems. The optimum amount obtained were 44.76 mg of HPMC K15M and 10 mg of PVP K30. From the FTIR study, it may be concluded that no interaction was occurring between the drug and the excipients. And from the XRD study, it can clearly see that the solubility and bioavailability of the drug was enhanced.
ACKNOWLEDGEMENT: Authors wish to express their sincere gratitude to the Shree Patro Sir, Roland Institute of Pharmaceutical Sciences, to provide necessary requirements.
REFERENCES:
1. Raymond C Rowe and Ronald J Roberts. Artificial intelligence in the pharmaceutical product formulation, Knowledge based and expert system. PSTT 1998; 1(5). 2. Simpson ML, Unal R, Using Design of Experiments And
Response Surface Methodology As An Approach to Understand And Optimize Operational Air Power, Contractor, OPTECH Inc. 2010; 4: 757‐8567.
3. www.brad.ac.uk/staff/vtoropov/burgeon/thesis_luis/chapte r3.pdf
4. Box GEP, Behnken DW, Some New Three Level Designs for the Study of Quantitative Variables, Technometrics, 1960; 2:455- 475.
5. Montgomery, Douglas C, “Design and Analysis of Experiments: Response surface method and designs”, New Jersey: John Wiley and Sons, Inc., 2005.
6. Montgomery DC, Runger GC, “Applied Statistics and Probability for Engineers”, John Wiley and Sons, Inc, New York, 1994.
7. Myers RH, Khuri AI, Carter WH. Response surface methodology. Technometrics, 1989; 31(2): 137-153.
8. Raymond HM, Montgomery DC, “Response Surface Methodology: process improvement with steepest ascent, the analysis of response Surfaces, experimental designs for fitting response surfaces”, New York: John Wiley and Sons, Inc., 1995; 183-351.
9. Bolton, Bon, Pharmaceutical statistics, Marcel Dekker 4th edition volume 135, New York: 215-318
10. Liao and Laufs. Pleiotropic Effects of Statins. (2005) Annu. Rev. Pharmacol. Toxicol:45:89-118
11. Baselt R, Disposition of Toxic Drugs and Chemicals in Man, 8th edition, Biomedical Publications, Foster City, CA, 2008, pp. 1431-1433.
12. Lewington S, Whitlock G, Clarke R, et al. "Blood cholesterol and vascular mortality by age, sex, and blood pressure: a meta-analysis of individual data from 61 prospective studies with 55,000 vascular deaths". Lancet
December 2007; 370(9602): 1829–39.
13. Miettinen T A (March 1982) “ Diurnal Variation of Cholesterole Precursors Squalene and Methyl Sterols in Human Plasma Lipoproteins”, Journal of Lipid Research 23 (3): 466-73
14. Mandal Uttam, Gowda Veeran, Ghosh Animesh, Selvon Senthamil, Solomon Sam, and Pal Tapan Kumar, Formulation and Optimization of Sustained Release Matrix Tablet of Metformine HCl 500mg Using Response Surface Methodology, Yakugaku Zasshi 2007; 127(8): 1281- 1290. The Pharmaceutical Society of Japan.
15. Rowe Raymond C, Sheskey Paul J, Owen Sian C, “ Handbook of Pharmaceutical Excipients, Fifth edition 2006, Published by the Pharmaceutical Press, 188-189, 346-349, 430-432, 449-452, 611- 615, 767- 768.
16. Lachman Leon, Liberman H A and Kanig J L, “The Theory and Practice of Industrial Pharmacy”, 3rd
edition, Varghese publishes House Bombay, Pg.No. 430-456, 171-195.
17. Abelkader H, Abdalla O Y, Salem H, “Formulation of Controlled Release Baclofen Matrix tablets: Influence of Some Hydrophilic Polymers on the release Rate and in vitro Evaluation.
18. Lingam meka, Bhaskar kesavan, Venkatasimhadri naidu kalamata, Chandra mohan eaga, Suresh bandari, Venkateswarlu vobalaboina, Madhusudan rao yamsani. Design and evaluation of polymeric coated minitablets as multiple unit gastroretentive floating drug delivery systems for furosemide. Journal of Pharmaceutical Sciences June 2009; vol. 98, no. 6,
19. United States Pharmacopeia, United States Pharmacopeia /National Formulary (USP25/NF20). 2002, Rockville, MD: United States Pharmacopeia Convention Inc.
20. Sankalia J M, Sankalia M G, Mashru R C, “Drug release and swelling kinetics of directly compressed glipizide sustained-release matrices: Establishment of level A IVIVC”, Journal of Controlled Release, 2008, 129 49–58 21. Rahman Md. M, Hasan S, Alam Md. A, Roy S, Jha M K,
Eudragit and HPMC, Int. J. Pharm Biomed Res 2011, 2 (1), 7- 12
22. Reza M S, Abdul Q M, Haider S S, “Comparative evaluation of plastic, hydrophobic and hydrophilic polymers as matrices for controlled- release drug delivery, J Pharm Sci. 2003; 6:282-291.
23. Sameer G. Late, Yi-Ying Yu, Banga K A, “Effects of disintegration- promoting agent, lubricants, and moisture
treatment on optimized fast disintegrating tablets”, International Journal of Pharmaceutics, 2009, 365, 4-11
24. Singh B, Chakkal S K, and Ahuja N, Formulation and Optimization of Controlled Release Mucoadhesive Tablets of Atenolol Using Response Surface Methodology, AAPS PharmSciTech 2006; 7 (1) Article 3 (http://www. aapspharmscitech.org), January 13; 2006.
All © 2013 are reserved by International Journal of Pharmaceutical Sciences and Research. This Journal licensed under a Creative Commons Attribution-NonCommercial-ShareAlike 3.0 Unported License.
This article can be downloaded to ANDROID OS based mobile. Scan QR Code using Code/Bar Scanner from your mobile. (Scanners are available on Google Playstore)
How to cite this article: