IJPSR (2017), Volume 8, Issue 10 (Research Article)
Received on 25 February, 2017; received in revised form, 09 May, 2017; accepted, 27 May, 2017; published 01 October, 2017
BIOANALYTICAL METHOD DEVELOPMENT AND VALIDATION OF NITROFURANTOIN IN HUMAN PLASMA BY LC -MS / MS
Meruva Sathish Kumar* and P. Shanmugapandiyan
Department of Pharmacy, Mewar University, Chittorgarh - 312901, Rajasthan, India.
ABSTRACT: A simple, rapid and sensitive method using an isocratic Liquid chromatography coupled with Tandem mass spectrometry was developed and validated for the assay of nitrofurantoin in the Human Plasma. The Mass transition of nitrofurantoin and losartan (Internal standard) were M/z 237.1/151.9 and M/Z 421.300/ 179 in ESI Negative ionization. Linearity was observed between the nitrofurantoin concentration and the peak area ratio from 10.451 to 1033.897 ng/mL with R2 value of 0.99. Plasma samples containing nitrofurantoin were extracted with Acetonitrile: 5mM Ammonium Acetate (pH 3.8) (80:20). The observed recovery of nitrofurantoin was 90%. The intra-day and inter-day accuracy was performed. Stability parameter was performed. The method will be used in the determination of the pharmacokinetic parameters of nitrofurantoin.
INTRODUCTION: Nitrofurantoin is an antibiotic that has fights bacteria in the body. Chemically it is (E)-1-[(5nitro2furyl)methylideneamino] imidazolid ine-2,4-dione 1 - 4. It has an empirical formula of C8H6N4O5 and a molecular weight of 238.16 g/mol.
It works as an antibiotic by damaging bacterial DNA, since its reduced form is highly reactive. It is used in the treatment of UTI’s caused by susceptible bacteria nitrofurantoin is readily absorbed after oral dosing from the gastrointestinal tract with peak plasma levels occurring in 4 - 8 hrs and half life is 20 - 60 minutes. Literature survey reveals that very few methods were developed and validation for the quantification of nitrofurantoin in pharmaceutical and biological fluids 5 - 13.
QUICK RESPONSE CODE
DOI:
10.13040/IJPSR.0975-8232.8(10).4186-94
Article can be accessed online on:
www.ijpsr.com
DOI link: http://dx.doi.org/10.13040/IJPSR.0975-8232.8 (10).4186-94
The aim and objective of proposed method is to develop the simplest, sensitive, high recovery and selective method with proper internal standard usage. The method was validated as per ICH guidelines 14.
FIG. 1: STRUCTURE OF NITROFURANTOIN
MATERIALS AND METHODS:
Instrumentation: A thermo LC system equipped was used to inject 25μl of the samples on a Hypurity advance Kromosil-C-8; 4.6x50mm which was kept at ambient temperature of 25 °C. The Electron Spray Ionization source was heated at 4500 °C nebulizer operating in negative ion mode. A mixture of buffer and acetonitrile in the ratio of 20:80 % v/v was degassed ultrasonically for 5 min. The flow rate of mobile phase was 0.8 ml/min (split ratio-0.5ml).
Keywords:
LC-MS/MS, Nitrofurantoin, Losartan, Validation
Correspondence to Author: Meruva Sathish Kumar
Associate Professor and Research Scholar, V-102, Hivision residency, Backside Siddh Convention, Kompally, Hyderabad - 500014, Telangana, India.
Preparation of Standard Stock and Plasma Samples: The nitrofurantoin standard stock solution of 1033896.6 ng/ml was prepared by dissolving required quantity in acetonitrile and dimethyl sulphoxide. This was further diluted with acetonitrile and water to get a concentration of 51694.8 ng/ml. The spiked calibration curve standards (CC) and quality control samples (QC) were prepared by using standard stock and intermediate stock solution in 80% acetonitrile in water. The internal standard (IS) stock solution was prepared by dissolving 10 mg in methanol. This was further diluted with methanol to get a
concentration of 1033896.6 ng/ml. all the solutions were stored at - 20 °C. The CC standards and QC samples were prepared by spiking human plasma with respective working solutions. CC standards were prepared at 10.4505, 26.1262, 52.2524, 104.5048, 261.2621, 466.5394, 681.0794, 878.8121 and 1033.8966 n/ml for nitrofurantoin. QC samples were prepared at 10.5163 ng/ml (LLOQ QC), 28.8119 ng/ml (LQC), 364.7070 ng/ml (MQC) and 878.8121 ng/ml (HQC) concentrations as shown in the Table 1 and 2. All the spiked samples were stored at -20 °C for sample analysis and validation.
TABLE 1: PREPARATION OF SPIKED CALIBRATION CURVE STANDARDS Stock
CC-ID
Stock Concentration (ng/ml)
Stock Aliquot (ml)
Plasma Added (ml)
Final Volume (ml)
Final Concentration (ng/ml)
Spiked CC-ID
SS1 51694.8300 0.2 9.8 10 1033.8966 I/I1
SS2 43940.6055 0.2 9.8 10 878.8121 H
SS3 34053.9693 0.2 9.8 10 681.0794 G
SS4 23326.9689 0.2 9.8 10 466.5394 F
SS5 13063.1026 0.2 9.8 10 261.2621 E
SS6 5225.2410 0.2 9.8 10 104.5048 D
SS7 2612.6205 0.2 9.8 10 52.2524 C
SS8 1306.3103 0.2 9.8 10 26.1262 B
SS9 522.5241 0.2 9.8 10 10.4505 A/A1
TABLE 2: PREPARATION OF SPIKED QUALITY CONTROL SAMPLES Stock
CC-ID
Stock Concentration (ng/ml)
Stock Aliquot (ml)
Plasma Added (ml)
Final Volume (ml)
Final Concentration (ng/ml)
Spiked CC-ID
QC1 43940.6055 0.2 9.8 10 878.8121 HQC
QC2 18235.3513 0.2 9.8 10 364.7070 MQC
QC3 1440.5928 0.2 9.8 10 28.8119 LQC
QC4 525.8164 0.2 9.8 10 10.5163 LLOQ
Sample Preparation: Prior to analysis, the required number of quality Control samples along with the Calibration Curve Standards was withdrawn from Ultra Low Temperature Freezer and thawed to room temperature. Thawed samples were vortexed ensuring complete mixing of contents.
500µl of samples and 50µl of Internal Standard (10000ng/ml) solution was added to all samples except blank and vortexed. add 50µl of 10% v/v Orthophosphoric acid and 2.5 ml of ethyl acetate was added to all samples and vortexed and vibramaxed at 2500 rpm for 10 minutes centrifuged at 4500rpm for 10 minutes at 4 °C in a refrigerated Centrifuge from that take 1.8 ml of supernatant samples were separated and taken in fresh ria vial were dried under nitrogen evaporator at 50 °C and 15 psi. The dried residue sample in all RIA vials
was reconstituted with 0.5ml mobile phase and vortexed and injects 25μl of solution into LC-MS/MS system.
plasma obtained from 8 different donors. Also spiked six samples at LLOQ concentration of nitrofurantoin and IS in plasma of one donor from above plasmas (except hemolytic and lipemic plasmas). Compare the response of analyte and IS in blanks with the mean response of injected LLOQ. The matrix effect for the intended method was assessed by using chromatographically screened human plasma concentrations equivalent to LQC and HQC prepared with six different lots. The linearity of the method was determined by using a 1/x2 weighted least square regression analysis of standard plots associated with a 9 point standard curve. The intra and inter day accuracy and precision were determined by analyzing 6 replicates of LQC, GMQC, MQC and HQC in a single day and between two consecutive days respectively. The precision (% CV) at each concentration level should not be more than 15% except for LLOQ QC where it should be 20%. The accuracy (%) must be within +15% of their nominal value except for LLOQ QC where it should be within +20%. The percentage mean recoveries were determined by measuring the concentrations of the extracted plasma QC samples at HQC, MQC and LQC against unextracted QC samples. Reinjection reproducibility was performed by analyzing 6 replicates of LQC and HQC samples. Stability results were assessed by measuring the area response of stability samples against freshly prepared LQC and HQC samples. Freeze thaw stability was estimated after 3 cycles of freezing and thawing of samples at -20 °C auto sampler stability was determined by keeping the samples in the auto sampler at 15 °C and analyzed after 36 hrs under a fresh calibration curve. Dry extract stability was evaluated by reconstituting and
evaporating the samples kept on the bench at ambient temperature and analyzed after 24hrs.
RESULTS AND DISCUSSION:
Optimization of Liquid Chromatography and Mass Spectrometry Conditions: For complete chromatographic resolution of nitrofurantoin and Internal Standard, several solvents such as acetonitrile, methanol, different buffers and mixture of solvents were tried along with different flow rates. Finally the resolution of peaks was achieved with 5mM ammonium acetate (pH 3.8) in Acetonitrile: 5mM Ammonium Acetate with pH (3.8), (80:20) using High purity advance Kromosil-C-8; 4.6x50mm (25µl). The flow rate was 0.8ml/min. Following mass spectrometric conditions, precursor ion to the parent ion transitions for nitrofurantoin and IS were at m/z 237.1→151.9 and 421.3→179.0 respectively was used for quantification purpose.
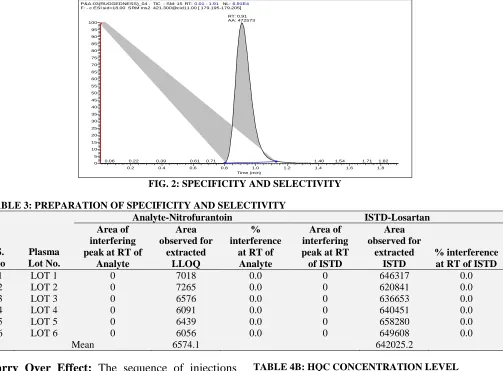
Method Validation Parameters: The selectivity of the present method was established by checking any interfering compounds that elute along with nitrofurantoin. The response of analyte and IS in blanks was compared with the mean response of injected LLOQ. Hence there were no interfering peaks formed at nitrofurantoin retention time and IS retention time in the plasma blanks. Fig.1 shows representative chromatograms of K2 EDTA blank human plasma samples.
The specificity of the method was determined by comparing the response of analyte and IS with the mean response of injected LLOQ. There were no interfering peaks obtained at nitrofurantoin and IS retention time. The results were shown in Table 3.
Chromatogram of Blank Plasma and Internal Standard:
P&A-03(RUGGEDNESS)_04 - TIC - SM: 15 RT:0.01 - 2.50 NL:5.65 F: - c ESI sid=18.00 SRM ms2 [email protected] [ 151.995-152.005]
0.2 0.4 0.6 0.8 1.0 1.2 1.4 1.6 1.8 2.0 2.2 2.4
P&A-03(RUGGEDNESS)_04 - TIC - SM: 15 RT:0.01 - 1.91 NL:6.91E4
F: - c ESI sid=18.00 SRM ms2 [email protected] [ 179.195-179.205]
0.2 0.4 0.6 0.8 1.0 1.2 1.4 1.6 1.8
Time (min) 0 5 10 15 20 25 30 35 40 45 50 55 60 65 70 75 80 85 90 95 100 R el at ive In te nsi ty RT: 0.91 AA: 472573
[image:4.612.61.564.55.426.2]1.40 1.54 1.71 1.82 0.06 0.22 0.39 0.61 0.71
FIG. 2: SPECIFICITY AND SELECTIVITY TABLE 3: PREPARATION OF SPECIFICITY AND SELECTIVITY
S. no
Plasma Lot No.
Analyte-Nitrofurantoin ISTD-Losartan
Area of interfering peak at RT of
Analyte Area observed for extracted LLOQ % interference
at RT of Analyte
Area of interfering peak at RT of ISTD Area observed for extracted ISTD % interference at RT of ISTD
1 LOT 1 0 7018 0.0 0 646317 0.0
2 LOT 2 0 7265 0.0 0 620841 0.0
3 LOT 3 0 6576 0.0 0 636653 0.0
4 LOT 4 0 6091 0.0 0 640451 0.0
5 LOT 5 0 6439 0.0 0 658280 0.0
6 LOT 6 0 6056 0.0 0 649608 0.0
Mean 6574.1 642025.2
Carry Over Effect: The sequence of injections containing two blank samples and two samples containing of LLOQ and ULOQ with internal standard were analyzed alternately to check if there is any carry over affecting the blank sample. There was no carryover effect observed in the present method.
Recovery: The peak areas of extracted QC samples were compared against the peak areas of respective aqueous QC samples. The % mean recovery for cycloserine in LQC, MQC and HQC was 79.38, 74.72 and 75.12% respectively. Recovery for IS was 73.28%. The results were shown in the Table 4.
Analyte (Nitrofurantoin) Recovery:
TABLE 4A: MQC CONCENTRATION LEVEL
QC-ID Aqueous Area Extracted Area
MQC 385414 381928
395943 377500
417814 347267
350511 301452
392824 338011
401160 352982
[image:4.612.274.556.128.737.2]Mean 390611.0 349856.7
TABLE 4B: HQC CONCENTRATION LEVEL
QC-ID Aqueous Area Extracted Area
HQC
761326 705893
763073 695685
753228 733564
799654 785758
784508 606553
835182 693699
Mean 782828.5 703525.3
TABLE 4C: LQC CONCENTRATION LEVEL
QC-ID Aqueous Area Extracted Area
LQC
82716 78898
77079 78586
88886 83564
82512 57957
71351 65243
72561 69086
Mean 79184.2 72222.3
TABLE 4D: TOTAL RESULTS OF ANALYTE RECOVERY
HQC 89.9
MQC 89.6
LQC 93.0
Average 90.8333
SD 1.8823
[image:4.612.314.562.380.737.2]TABLE 5A: INTERNAL STANDARD (LOSARTAN) RECOVERY
Aqueous Area Extracted Area
HQC
271130 276519
276010 277961
267479 291076
270622 277356
281986 273247
281459 300743
MQC
275058 285905
266841 288092
285684 317747
247565 306391
271793 251363
277453 238767
LQC
271299 257841
265772 274409
295935 280751
274500 286071
239484 283411
240319 265221
Mean 270021.6000 279603.9000
SD 14727.6700 19021.1300
% CV 5.5 6.8
% Recovery 103.5
TABLE 5B: TOTAL RESULTS OF ANALYTE
RECOVERY
HQC 89.9
MQC 89.6
LQC 93.0
Average 90.8333
SD 1.8823
%CV 2.06
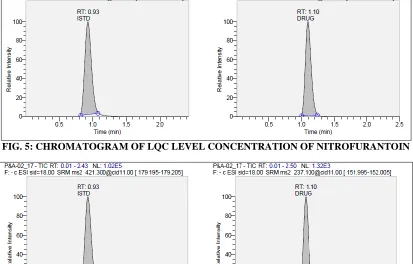
[image:5.612.49.297.78.382.2]Linearity, Accuracy, Precision and Sensitivity: The calibration curve was constructed using 9 calibration standards ranging from 10.45ng/ml to 1033.897ng/ml. a straight line fit was made through the data points by 1/x2 weighing method. The correlation coefficient was found to be ≥ 0.99. The lower limit of quantification (LLOQ) was found to be 10.516ng/ml. The sensitivity results were shown in following Table 7. The percent accuracy observed for the mean of back calculated concentrations for four calibration curves for nitrofurantoin was within 97.8-109.7, while % CV values ranged from 4.8-10.9. Accuracy and precision for intraday and inter day plasma homogenate samples are presented in the Table 6, 7 and 8. The following chromatograms represents accuracy and precision for LQC, GMQC, MQC and LQC samples. (Fig. 3, 4, 5 and 6).
[image:5.612.64.545.81.751.2]FIG. 3: CHROMATOGRAM OF HQC LEVEL CONCENTRATION OF NITROFURANTOIN
[image:5.612.99.514.486.728.2]FIG. 5: CHROMATOGRAM OF LQC LEVEL CONCENTRATION OF NITROFURANTOIN
[image:6.612.100.513.68.332.2]FIG. 6: CHROMATOGRAM OF LLOQ QC LEVEL CONCENTRATION OF NITROFURANTOIN TABLE 6: SENSITIVITY OF NITROFURANTOIN
LLOQ
Actual Concentration (ng/ml) 10.516
1 11.792
2 11.417
3 11.357
4 12.141
5 11.605
6 10.522
Mean 11.4724
SD 0.5452
%CV 4.8
% Accuracy 109.1
TABLE 7: RESULTS OF PRECISION AND ACCURACY WITHIN BATCH OF NITROFURANTOIN
QC-ID HQC MQC LQC LLOQ
Actual concentration (ng/ml) 878.812 364.707 28.812 10.516
902.132 395.541 29.365 8.929
817.447 325.615 28.952 33.865
748.133 321.296 30.071 8.692
964.761 359.552 25.934 8.500
787.459 336.101 29.036 8.489
937.105 336.415 26.939 8.761
Mean 859.5060 345.7530 28.3830 8.6740
SD 87.5000 27.7610 1.5900 0.1850
%CV 10.2 8.0 5.6 2.1
% Accuracy 97.8 94.8 98.5 82.5
882.722 363.175 27.189 11.550
890.648 330.480 31.236 11.835
1154.519 375.567 31.770 13.037
872.328 352.082 32.880 12.079
1069.678 347.941 30.377 12.439
Mean 959.9550 352.7950 31.5770 12.2320
SD 121.0440 15.3370 2.9050 0.5260
% CV 12.6 4.3 9.2 4.3
% Accuracy 109.2 96.7 109.6 116.3
858.366 366.757 28.885 11.792
892.020 329.451 32.345 11.417
849.483 342.189 35.243 11.357
1071.416 375.739 32.018 12.141
867.743 371.061 32.716 11.605
1052.868 354.862 28.398 10.522
Mean 931.9830 356.6760 31.6010 11.4720
SD 101.9850 18.0350 2.5640 0.5450
% CV 10.9 5.1 8.1 4.8
[image:7.612.51.563.260.554.2]% Accuracy 106.1 97.8 109.7 109.1
TABLE 8: RESULTS OF PRECISION AND ACCURACY BETWEEN BATCHES OF NITROFURANTOIN
QC-ID HQC MQC LQC LLOQ
Actual concentration (ng/ml) 878.812 364.707 28.812 10.516
902.132 395.541 29.365 8.929
817.447 325.615 28.952 *33.865
748.133 321.296 30.071 8.692
964.761 359.552 25.934 8.500
787.459 336.101 29.036 8.489
937.105 336.415 26.939 8.761
902.132 395.541 29.365 8.929
817.447 325.615 28.952 *33.865
748.133 321.296 30.071 8.692
964.761 359.552 25.934 8.500
787.459 336.101 29.036 8.489
937.105 336.415 26.939 8.761
858.366 366.757 28.885 11.792
892.020 329.451 32.345 11.417
849.483 342.189 35.243 11.357
1071.416 375.739 32.018 12.141
867.743 371.061 32.716 11.605
1052.868 354.862 28.398 10.522
Mean 883.6650 349.3940 29.4550 9.7230
SD 93.8012 24.0222 2.4203 1.4404
% CV 10.61 6.87 8.21 14.81
% Accuracy 100.55 95.8 102.22 92.48
Stability: The predicted concentrations for nitrofurantoin at LQC and HQC samples deviated with in ±15% of nominal concentration in stability tests i.e. auto sampler stability (36 hrs), bench top
(6 hrs), repeated three freeze thaw cycles, 24hrs of dry extract stability. The results were found to be within the acceptance limits during the entire process (Table 9).
TABLE 9: FREEZE THAW STABILITY FOR NITROFURANTOIN QUALITY CONTROL SAMPLES QUALITY CONTROL SAMPLES
S. No.
Freshly spiked FT Cycle III
LQC HQC LQC HQC
Actual concentration (ng/mL)
27.892 850.765 28.812 878.812
1 27.892 850.765 30.932 894.515
2 28.766 777.603 25.774 887.512
3 30.425 726.666 30.870 878.819
[image:7.612.57.564.652.750.2]5 33.174 807.561 28.757 870.821
6 40.189 829.280 32.495 748.152
MEAN 32.0247 808.4298 29.1405 869.4692
SD 4.4348 49.7810 2.7820 63.7489
% CV 13.4 6.0 9.5 7.3
% Stability 88.1 104.1
TABLE 10: BENCH- TOP STABILITY FOR NITROFURANTOIN QUALITY CONTROL SAMPLES
S. No.
Freshly spiked 6 hours
LQC HQC LQC HQC
Actual concentration (ng/mL)
27.892 850.765 28.812 878.812
1 27.892 850.765 28.812 878.812
2 28.766 777.603 25.374 545.275*
3 30.425 726.666 32.914 912.576
4 31.703 858.704 25.100 801.950
5 33.174 807.561 31.588 805.710
6 40.189 829.280 28.093 799.702
Mean 26.1560 745.4630 29.3480 811.0080
SD 4.4348 49.7810 3.1776 52.4902
% CV 16.4 6.5 10.8 6.5
% Stability 108.6 105.3
TABLE 11: AUTO SAMPLER STABILITY FOR NITROFURANTOIN QUALITY CONTROL SAMPLES
S. No.
Freshly spiked 36 hours
LQC HQC LQC HQC
Actual concentration (ng/mL)
27.892 850.765 28.812 878.812
1 27.892 850.765 34.866 827.089
2 28.766 777.603 31.083 608.694
3 30.425 726.666 25.977 734.222
4 31.703 858.704 32.427 767.973
5 33.174 807.561 30.379 758.263
6 40.189 829.280 33.674 774.536
Mean 32.0247 808.4298 31.4009 745.1297
SD 4.4348 49.7810 3.1240 73.4985
% CV 13.4 6.0 9.9 9.9
% Stability 94.9 89.2
TABLE 12: DRY EXTRACT STABILITY FOR NITROFURANTOIN QUALITY CONTROL SAMPLES
S. No.
Freshly spiked 24hours
LQC HQC LQC HQC
Actual concentration (ng/mL)
27.892 850.765 28.812 878.812
1 27.892 850.765 28.373 766.546
2 28.766 777.603 27.658 *746.073
3 30.425 726.666 18.716 *525.883
4 31.703 858.704 34.067 *593.530
5 33.174 807.561 24.040 904.203
6 40.189 829.280 30.853 839.989
Mean 32.0247 808.4298 27.2846 836.9126
SD 4.4348 49.7810 5.3669 68.8797
% CV 13.4 6.0 19.7 8.2
% Stability 82.5 100.2
CONCLUSION: A LC-MS/MS method was developed for the determination of nitrofurantoin in human plasma by using simple liquid - liquid extraction method. The method is simple, rapid,
of determination of nitrofurantoin in human plasma by using LC-MS/MS method
ACKNOWLEDGMENT: I thank Dr. M. Sridhar Department of Pharmaceutical Analysis for supporting me to do this research work. I thank my guide Dr. P. Shanmugapanidyan for his immense support.
CONFLICTS OF INTEREST: Nil. REFERENCES:
1. U.S. Department of Health and Human Services Food and
Drug Administration Center for Drug Evaluation and Research (CDER) Center for Veterinary Medicine (CVM)
May 2001 BP.
2. Indian Pharmacopoeia 1996; 1(5): 16-17.
3. http://en.wikipedia.org/wiki/nitrofurantoin.
4. United States Pharmacopoeia 2007; 3: 27.
5. Ramchandra KP: A New RP-HPLC Assay Method for
Determination and Quantitation of Nitrofurantoin API. International Journal of Chemical and Pharmaceutical 2017; 4: 250-258.
6. Zhang S, Li PP, Yan ZG, Long J and Zhang X:
Identification and quantification of nitrofurazone metabolites by ultra-performance liquid chromatography –quadrupole time of flight high-resolution mass spectrometry with pre-column derivatization. Analytical
and Bioanalytical Chemistry 2017; 409: 2255-2260.
7. Zhai H, Zhang L, Fang Y, Yuan K, Huang L and Yu X:
Simultaneous Determination of Chloramphenicol,
Ciprofloxacin, Nitrofuran Antibiotics and their
Metabolites in Fishery Products by CE.
Chromatographia 2015; 78: 551-556.
8. Veach BT, Baker CA, Kibbey, John H, Andrew F,
Broadaway, Bryanna J, Drake and Connie P: Quantitation of Chloramphenicol and Nitrofuran Metabolites in
Aquaculture Products Using Microwave-Assisted
Derivatization, Automated SPE, and LC-MS/MS. Journal of AOAC International 2015; 98:588-594.
9. Patel DS, Sharma N, Patel MC, Patel BN, Shrivastav PS
and Sanyal M:Quantitation of Nitrofurantoin in Human
Plasma by Liquid Chromatography Tandem Mass
Spectrometry.Acta Pharm2013; 63: 141-158.
10. Hanoon IT and Hussian HK: Determination of
Nitrofurantoin in Drug Formulations by High Performance
Liquid Chromatography. Kerbala Journal of
Pharmaceutical Sciences 2013; 6: 164-178.
11. Patil RS, Krishna CA, Prakash PVDLSR and Patil SR:
Simple, Rapid and Sensitive Method for Determination of Nitrofurantoin in Human Plasma by using Liquid Chromatography / Tandem Mass Spectrometry. Current Trends in Biotechnology and Pharmacy 2012; 6: 196-203.
12. Mottier P, Khong SP, Gremaud E, Richoz J, Delatour T,
Goldmann T and Guy PA: Quantitative determination of four nitrofuran metabolites in meat by isotope dilution
liquid chromatography-electrospray ionisation-tandem
mass spectrometry. Journal of Chromatography A 2005; 1067(1-2): 85-91.
13. Alexander L, Peter Z and Wolfgang L: Determination of
the metabolites of nitrofuran antibiotics in animal tissue by high-performance liquid chromatography–tandem mass spectrometry. Journal of Chromatography A 2001; 939: 49-58.
14. ICH guidelines for validation of analytical procedure; Q2
(R1) 1996; 4.
All © 2013 are reserved by International Journal of Pharmaceutical Sciences and Research. This Journal licensed under a Creative Commons Attribution-NonCommercial-ShareAlike 3.0 Unported License.
This article can be downloaded to ANDROID OS based mobile. Scan QR Code using Code/Bar Scanner from your mobile. (Scanners are available on Google Playstore)
How to cite this article:
Kumar MS and Shanmugapandiyan P: Bioanalytical method development and validation of nitrofurantoin in human plasma by LC – MS /