IJPSR (2014), Vol. 5, Issue 7 (Research Article)
Received on 19 January, 2014; received in revised form, 30 March, 2014; accepted, 07 June, 2014; published 01 July, 2014
APPLICABILITY OF BIVARIATE CALIBRATION ALGORITHM AND VIERORDT METHOD FOR SIMULTANEOUS DETERMINATION OF TIMOLOL MALEATE AND BRIMONIDINE TARTRATE IN THEIR BINARY MIXTURE AND PHARMACEUTICAL DOSAGE FORM
Mohamed S. Rizk 1, Hanan A. Merey 2, Shereen M. Tawakkol 1 and Mona N. Sweilam*1
Analytical Chemistry Department, Faculty of Pharmacy, Helwan University 1, Ain Helwan – 11790, Cairo, Egypt
Analytical Chemistry Department, Faculty of Pharmacy, Cairo University, Kasr El Aini st. – 11562, Cairo, Egypt
ABSTRACT: Three simple, rapid, sensitive, specific and economic spectrophotometric methods were developed and validated for simultaneous quantitation of timolol maleate (TM) and brimonidine tartarate (BT) in bulk powder and eye drops. Vierordt’s and bivariate calibration algorithm spectrophotometric methods were developed for the simultaneous estimation of cited drugs in a binary mixture without previous separation. In the simultaneous equation method (Vierordt’s), TM and BT were quantified using their absorptivity values at selected wavelengths 257 nm and 295 nm, respectively. Also bivariate calibration procedure was successfully applied for simultaneous determination of both drugs. Difference spectrophotometric method was also tried and showed high selectivity for BT determination without any interference from TM or eye drops additives. The accuracy and reproducibility of the proposed methods were statistically validated by recovery studies. The calibration curves were found to be rectilinear over the concentration ranges 5-85 μg/mL for TM in all methods. BT calibration curves were rectilinear over the concentration (2–35 μg/mL) in case of D1 and Vierordt’s methods, while (5–35 μg/mL) in case of bivariate method at the previously mentioned wavelengths, in addition to (4-50 μg/mL) in case of difference spectrophotometry. The proposed methods can determine different concentrations of bulk powder with satisfied mean percentage recoveries. The proposed methods are economic and rapid methods only a few minutes were required for the analysis. So, they can be used for routine analysis of both drugs in quality control laboratories.
INTRODUCTION: Timolol Maleate (TM) (-)-1 - (tert-butylamino)-3-[(4-morpholino-l, 2, 5-thiadiazol-3-yl)-oxy]-2-propanol 1.
QUICK RESPONSE CODE
DOI:
10.13040/IJPSR.0975-8232.5(7).2631-41
Article can be accessed online on: www.ijpsr.com DOI link: http://dx.doi.org/10.13040/IJPSR.0975-8232.5 (7). 2631-41
TM is a nonselective beta-adrenergic receptor antagonist that lowers intraocular pressure by decreasing the production of aqueous humour 2.
Brimonidine Tartrate (BT)
[5-bromo-6-(2-imidazolidinylideneamino) quinoxaline L-tartrate] is a selective alpha-2 adrenergic agonist, used in the treatment of open-angle glaucoma or ocular hypertension.
Keywords:
Brimonidine tartrate, Bivariate calibration method, Difference spectrophotometry, Timolol maleate,
Vierordt’s method
Correspondence to Author:
Mona N. Sweilam
Analytical Chemistry Department, Faculty of Pharmacy, Helwan University, Ain Helwan, 11790-Cairo, Egypt
The mechanism of action of Brimonidine to reduces intraocular pressure by decreasing aqueous secretion 2. Various methods have been reported for both drugs individually. TM can be determined by titrimetric official methods USP 1 and BP 3,
HPLC methods 4, 5, HPTLC method 6,
chemiluminescence methods 7, 8, voltammetric determination 9-11.
The reported methods for BT were HPLC 12-15, HPTLC 16, UV Spectrophotometric method for the estimation of BT 17, 18, capillary electrophoresis 19, gas chromatography with mass detection 20. Also simultaneous determinations of both drugs were reported by spectrophotometric determination 21, 22, TLC-densitometry 23 and simultaneous estimation of TM and BT in nanoparticles formulation by RP-HPLC 24. The aim of this work was to develop and
validate simple, rapid and economic
spectrophotometric methods suitable for
simultaneous determination of TM and BT in binary mixture without any interference from preservative or any inactive ingredients present in eye drops.
EXPERIMENTAL
Reagents and chemicals: All chemicals used were of analytical grade. Distilled water was used throughout the study.
Timolol maleate, its purity was found to be 100.0 ± 0.697 according to the comparison method21, brimonidine tartarate (BT), its purity was found to be 100.2 ± 1.070 according the comparison method 21 and benzalkonium chloride (BZ), were kindly
supplied by SIGMA Pharmaceuticals
Industries, Egypt.
Combigan® eye drops, each 1 mL labeled to contain 6.8 timolol maleate (equivalent to 5.0 mg timolol) and 2.0 mg brimonidine tartarate, and 0.05 mg benzalkonium chloride as a preservative, manufactured by
Allergan Pharmaceuticals Ireland,
Westport, Co. Mayo, Ireland was purchased from local market.
Sodium hydroxide (Sigma, Egypt), 0.1N NaOH solution.
Hydrochloric acid 30% v/v (Adwic, Egypt), 0.1N HCl solution.
Instrument: A JASCO V-530 double beam UV-VIS spectrophotometer with a fixed slit width (2 nm) connected to a computer loaded with Spectra Manager Program (JASCO) was used for spectral acquisition and elaboration of the data obtained. Quartz cuvettes, 1-cm path length, were used for measuring the light absorption in ultra-violet region (200-400 nm).
Preparation of solutions:
1. Preparation of standard solutions: Standard stock solutions:
- Standard stock solution of TM (1.0 mg/mL): An accurately weighed 100.0 mg of TM was transferred into 100-mL volumetric flask, dissolved and completed to volume with distilled water.
- Standard stock solution of BT (1.0 mg/mL): An accurately weighed 100.0 mg of BT was transferred into 100-mL volumetric flask, dissolved and completed to volume with distilled water.
- Standard stock solution of BZ (0.2 mg/mL): An accurately weighed 20.0 mg of BZ was transferred into 100-mL volumetric flask, dissolved and completed to volume with distilled water.
Standard working solutions:
- Standard working solution of TM (0.1 mg/mL): 10 mL of the previously prepared standard stock solution was transferred into 100-mL volumetric flask then completed to volume with distilled water.
- Standard working solution of BT (0.08
mg/mL) used in difference
spectrophotometry: 8 mL of the previously prepared standard stock solution was transferred into 100-mL volumetric flask then completed to volume with distilled water.
- Standard working solution of BZ (1.0 µg/mL): 0.5 mL of the previously prepared standard stock solution was transferred into 100-mL volumetric flask then completed to volume with distilled water.
Preparation of eye drops solutions:
1. Eye drop stock solution: Stock solution equivalent to 136 μg/mL of TM and 40 μg/mL of BT was prepared by transferring 1 mL of Combigan® eye drops into 50-mL volumetric flask then completed to volume with distilled water.
2. Eye drop working solutions: Portions 2.5 mL, 3.75 mL and 5 mL of the previously prepared eye drops stock solution were accurately transferred separately into two sets each set composed of three 10-mL volumetric flasks then completed to volume with 0.1N NaOH for first set or with 0.1N HCl for second set.
Laboratory-prepared mixtures
a. Preparation of laboratory prepared: Three laboratory prepared mixtures containing different ratios of TM, BT and BZ were prepared as the following:
- Ratio of (34: 10: 0.25 µg/mL), 3.4 mL of
TM standard working solution (0.1
mg/mL), 2.5 mL of BT standard working solution (0.04 mg/mL) and 2.5 mL of BZ standard working solution (1.0 µg/mL) were transferred into 10-mL volumetric flask then the volume was completed with 0.1N NaOH, simulating the ratio of commercial eye drops.
- Ratio of (10: 10: 0.1 µg/mL) 1 mL of TM standard working solution (0.1 mg/mL), 2.5
mL of BT standard working solution (0.04 mg/mL), and mL of BZ standard working solution (1.0 µg/mL) were transferred into 10-mL volumetric flask then the volume was completed with 0.1N NaOH.
- Ratio of (10: 20: 0.1 µg/mL), 1 mL of TM standard working solution (0.1 mg/mL), 5 mL of BT standard working solution (0.04 mg/mL) and 1 mL of BZ standard working solution (1.0 µg/mL) were transferred into 10-mL volumetric flask then the volume was completed with 0.1N NaOH.
In case of difference spectrophotometric method, the same mixtures were prepared in 0.1N HCl in addition to that prepared in 0.1N NaOH.
Procedures:
1. Spectra characteristic relationship: - Scanning of absorption spectra of TM and BT in presence of BZ used in Vierordt’s and bivariate calibration spectrophotometry.
Into three separate 10-mL volumetric flasks, solutions containing 35.0 μg/mL of TM and 10.0 μg/mL of BT and 0.25 μg/mL of BZ were prepared by transferring 3.5 mL of TM, 2.5 mL BT and 2.5 mL BZ from their respective standard working solutions then the volume was completed with 0.1N NaOH. The zero-order (D0) absorption
spectrum of each solution was recorded over the range of 200-450 nm against 0.1N NaOH as a blank.
The D0 absorption spectra of the equimolar
solutions in different pH medium were scanned against their specific blank, then the difference spectra (ΔA) of the studied drugs were obtained by keeping acidic form (in 0.1N HCl) in reference cell and basic form (in 0.1N NaOH) in sample cell.
Validation procedure:
1. Linearity: Construction of calibration curves for Vierordt’s and bivariate calibration spectrophotometry. Aliquots equivalent to 50 – 850 μg of TM and 20-350 μg for BT from their respective standard working solution, were transferred separately into two series of 10-mL volumetric flasks then the volume was completed with 0.1N NaOH. The D0
absorption spectrum of each solution was recorded against 0.1N NaOH as a blank. Construct the calibration curves relating the absorbance at the wavelengths 257 nm and 295 nm to the corresponding drug concentrations in Vierordt’s method, while in bivariate calibration method the selected two wavelengths were 260 nm and 300 nm for the two drugs. The corresponding regression equations were computed at the selected wavelengths for both drugs in both methods.
- Construction of calibration curve for difference spectrophotometry: Aliquots equivalent to 40–500 μg of BT from standard working solution (0.08 mg/mL), were transferred separately into two series of 10-mL volumetric flasks. The volume was then adjusted with 0.1N HCl and 0.1N NaOH separately to give equimolar
solutions in different pH medium.
Difference spectra (ΔA) were obtained by keeping acidic form (in 0.1N HCl) in reference cell and basic form (in 0.1N NaOH) in sample cell. Calibration curve was constructed at 268 nm for BT relating the absorbance difference (ΔA) between two solvents against drug concentrations and the corresponding regression equation was computed.
2. Accuracy: The previously mentioned procedure under linearity was applied for
the determination of different
concentrations of TM and BT in all
methods. The concentrations were
calculated from their corresponding
regression equations. The recovery
percentages, the mean recovery and SD were then calculated. To prove the accuracy of the proposed method, the results of the assay of TM and BT in pure form by the proposed methods was compared with those obtained using the comparison method 21. Also, the accuracy of the proposed procedure was assessed by applying the standard addition technique, by spiking different known concentrations of pure drugs to eye drops. Each solution was
measured in triplicate and the
concentrations of added TM and BT were calculated using the regression equations of each method.
3. Precision:
a. Intra-assay precision (Repeatability): The Intra-assay precision was evaluated for the studied drug by assaying three concentrations of TM (35, 45 and 55 μg/mL were analyzed by all methods) and BT (10, 20 and 30 μg/mL were analyzed by all methods) triplicate, using the previously mentioned procedure under “linearity” of each method. The percentage recovery and standard deviation were calculated.
b. Intermediate precision: The previous procedure mentioned under “linearity” for all methods was repeated on three successive days for assaying the three prepared solutions of TM (35, 45 and 55 μg/mL were analyzed by all methods) and BT (10, 20 and 30 μg/mL were analyzed by all methods) triplicate. The percentage recovery and standard deviation were calculated.
4. Selectivity: The D0 absorption spectra of
concentrations of TM and BT in each mixture were calculated from their corresponding regression equations of each method. Also, the prepared working solutions of Combigan® eye drops were analyzed as mentioned under “linearity” for all methods. The concentrations of TM and
BT were calculated from their
corresponding regression equations of each method.
5. Limit of detection (LOD) and Limit of quantification (LOQ): LOD and LOQ for TM and BT were calculated according to ICH Q2 (R1) recommendation 25. LOQ and LOD had been calculated from the linearity of the calibration curve of each method.
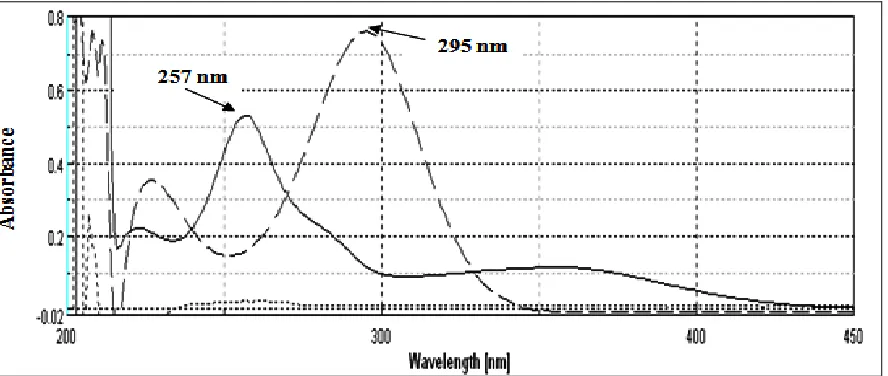
[image:5.612.90.534.291.479.2]RESULTS AND DISCUSSION: The completely overlapped spectra of TM and BT in alkaline solution were represented in Figure 1. This spectral overlapping is sufficient to demonstrate the resolving power of the proposed Spectrophoto-metric methods. The direct spectrophotoSpectrophoto-metric method cannot be directly applied to the simultaneous determination of the two drugs in their mixture without prior separation. In contrast, the proposed methods can resolve the overlapping. Different solvents were tried (to obtain less spectral overlap) as 0.1 N HCl solution and 0.1N NaOH solution. The best solvent giving the best crossing point for resolving the mixture was found to be 0.1N NaOH due to the bathochromic shift that happened to BT, (Figure 1).
FIGURE 1: ZERO ORDER ABSORPTION SPECTRUM OF 10 µg/mL BT (____), 35 µg/mL TM ( __ __ ) AND 0.25 µg/mL
BZ (...) USING 0.1N NaOH AS BLANK
1. Vierordt’s method: In order to apply the Vierordt’s method in the resolution of binary mixture of TM and BT, the absorbance of each component TM or BT at the two maximum wavelengths 257 nm and 295 nm, respectively were recorded, Figure (1). Then the concentrations of TM and BT were calculated using the following simultaneous equations:
Where C1: Concentration of TM (mole/liter)
C2: Concentration of BT (mole/litre)
A1: Absorbance of the laboratory prepared mixtures
at 295nm.
A2: Absorbance of the laboratory prepared mixtures
at 257 nm.
α1: Molar absorptivity of TM at 295 nm.
α2: Molar absorptivity of TM at 257 nm.
β1: Molar absorptivity of BT at 295 nm.
Experimental parameters were calculated for the determination of TM and BT at optimal wavelength for each other by Vierordt’s method.
2. Bivariate calibration curve method: The principle of bivariate calibrations is the measurement of absorbance (AAB1, AAB2) of
binary mixture (A, B) at two carefully selected wavelengths (1, 2), to obtain two equations:
AAB1 = mA1CA + mB1CB + eAB1, AAB2 = mA2CA
+ mB2CB + eAB2.
Where eAB1, eAB2 are the sum of the intercepts of
the linear calibration at two wavelengths (eAB1 = eA1
+ eB1), mA, mB are the slopes of the linear
regression and CA, CB are the concentrations of the
analytes.
The resolution of such equations, allows the evaluation of CA and CB values:
The simple mathematical algorithm allows the resolution of the binary mixture by measuring the absorbance of the mixtures at the two wavelengths and using the parameters of the linear regression functions evaluated individually for each component at these same wavelengths. The method of Kaiser 26 was used for the selection of optimum wavelengths set which assured the best sensitivity for the determination. A series of sensitivity matrices, K, was created for each binary mixture and for every pair of pre-selected wavelengths:
Where mA1,2 , mB1,2 are the sensitivity parameters
of the components A, B at the two selected wavelengths (1, 2). It was decided to use the values of the linear regression calibration slopes at the sensitivity factor. The determinants of these matrices were calculated and the wavelength set was selected for which the highest matrix determinant value was obtained.
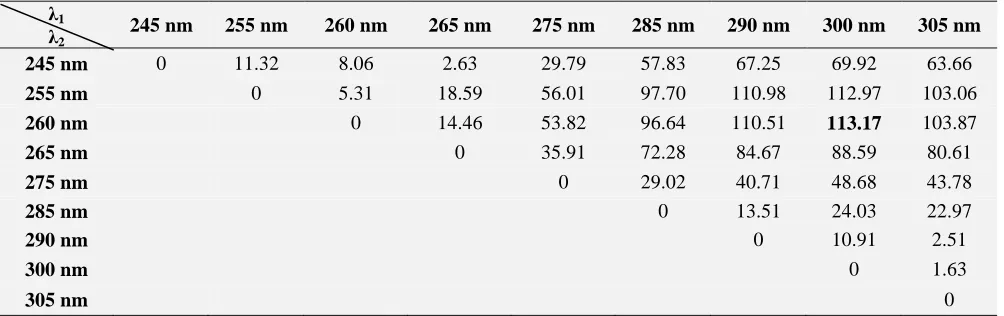
For TM and BT mixture, nine wavelengths (245, 255, 260, 265, 275, 285, 290, 300 and 305 nm) were taken and the slope values of the linear regression were estimated for the respective components at the selected wavelengths. Using the obtained data, the sensitivity matrices were created and the respective determinants were calculated, (Table 1). 260 nm and 300 nm were used for bivariate determination of TM and BT.
TABLE 1): APPLICATION OF THE KAISER METHOD 26 FOR THE SELECTION OF WAVELENGTH SET FOR
THE MIXTURE OF TM AND BT λ1
λ2
245 nm 255 nm 260 nm 265 nm 275 nm 285 nm 290 nm 300 nm 305 nm
245 nm 0 11.32 8.06 2.63 29.79 57.83 67.25 69.92 63.66
255 nm 0 5.31 18.59 56.01 97.70 110.98 112.97 103.06
260 nm 0 14.46 53.82 96.64 110.51 113.17 103.87
265 nm 0 35.91 72.28 84.67 88.59 80.61
275 nm 0 29.02 40.71 48.68 43.78
285 nm 0 13.51 24.03 22.97
290 nm 0 10.91 2.51
300 nm 0 1.63
305 nm 0
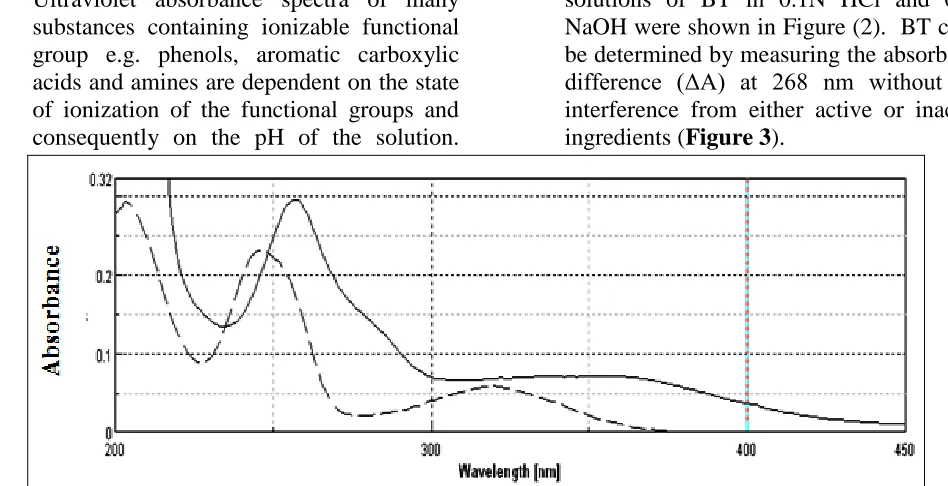
[image:6.612.57.559.585.743.2]3. Difference Spectrophotometry (ΔA): Ultraviolet absorbance spectra of many substances containing ionizable functional group e.g. phenols, aromatic carboxylic acids and amines are dependent on the state of ionization of the functional groups and consequently on the pH of the solution.
[image:7.612.68.542.75.318.2]Different absorbance spectra of equimolar solutions of BT in 0.1N HCl and 0.1N NaOH were shown in Figure (2). BT could be determined by measuring the absorbance difference (ΔA) at 268 nm without any interference from either active or inactive ingredients (Figure 3).
FIGURE 2: The D0 ABSORBANCE SPECTRA OF EQUIMOLAR SOLUTIONS (6 µg/mL) OF BT in 0.1N HCl ( _ _ _ )
USING 0.1N HCl AS BLANK AND IN 0.1N NaOH ( _____ ) USING 0.1N NaOH
FIGURE 3: ΔA SPECTRA OF 10 µg/mL BT (____), 34 µg /mL TM (_ _ _), 0.25 µg/mL BZ (...) AND LABORATORY PREPARED MIXTURE OF ALL (-.-.-) IN 0.1N NaOH USING THE ACIDIC FORM IN 0.1N HCl AS BLANK
4. Methods validation: All methods were validated according to the ICH Q2 (R1) recommendation 25.
a. Linearity and range: The calibration curves were found to be rectilinear over the concentration ranges 5-85 μg/mL for TM in all methods. BT calibration curves were rectilinear over the concentration (2–35 μg/mL) in case of D1 and Vierordt’s
methods, while (5–35 μg/mL) in case of bivariate method at the previously mentioned wavelengths, in addition to (4-50
μg/mL) in case of difference
spectrophotometry. The regression
equations in D1 method were computed at
313 nm and 386 nm for TM and BT, respectively, and found to be:
P313 = 0.0007C - 0.0004
r = 0.9999 For TM
P386 = 0.0206C + 0.0003
[image:7.612.78.541.353.529.2]Where P313 is the peak amplitude at 313 nm, P386 is
the peak amplitude at 386 nm, C is the concentration of the drug in μg/mL and r is the correlation coefficient.
The regression equations in Vierordt’s method were calculated for the calibration curves at the two maximum wavelengths for each component and were found to be:
A257= 0.0048C - 0.0033 r = 0.9999 for TM
at 257 nm
A295= 0.0223C - 0.0094 r = 0.9999 for TM
at 295 nm
A257= 0.0572C - 0.0036 r = 0.9999 for BT
at 257 nm
A295= 0.0131C - 0.0056 r = 0.9999 for BT
at 295 nm
Where A is the absorbance value at 257 nm and 295 nm, C is the concentration in μg/mL and r is the correlation coefficient.
The linear regression equations of bivariate calibration method were found to be:
A260= 0.0055C - 0.0041 r = 0.9999 For TM
at 260 nm
A300= 0.0211C - 0.0053 r = 0.9999 For TM
at 300 nm
A260= 0.0564C - 0.028 r = 0.9999 For BT
at 260 nm
A300= 0.0106C - 0.0012 r = 0.9999 For BT
at 300 nm
Where A is the absorbance value at 260 nm and 300 nm, C is the concentration in μg/mL and r is the correlation coefficient.
The regression equation of ΔA procedure for BT was computed and found to be:
P268 = 0.028C + 0.003
r = 0.9999 For BT
Where P268 is the peak amplitude at 268 nm, C is
the concentration in μg/mL and r is the correlation coefficient.
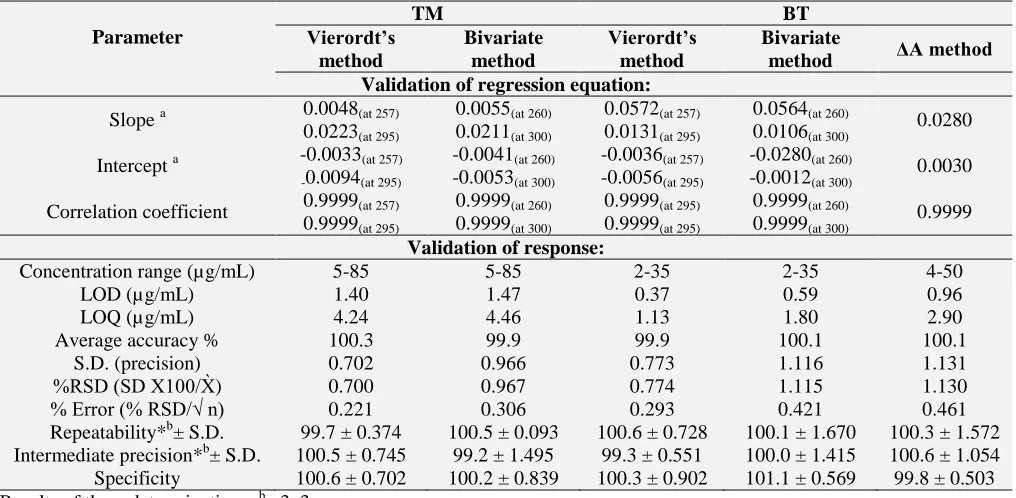
[image:8.612.53.561.490.739.2]The results obtained show that linearity of the calibration graphs and the compliance with Beer's law were validated, as illustrated by the high values of correlation coefficients of regression equations and the small values of intercepts (table 2).
TABLE 2: ASSAY VALIDATION SHEET OF THE PROPOSED SPECTROPHOTOMETRIC METHODS FOR THE DETERMINATION OF TM AND BT
Parameter
TM BT
Vierordt’s method
Bivariate method
Vierordt’s method
Bivariate
method ΔA method
Validation of regression equation:
Slope a 0.0048(at 257)
0.0223(at 295)
0.0055(at 260)
0.0211(at 300)
0.0572(at 257)
0.0131(at 295)
0.0564(at 260)
0.0106(at 300)
0.0280 Intercept a -0.0033(at 257)
-0.0094(at 295)
-0.0041(at 260)
-0.0053(at 300)
-0.0036(at 257)
-0.0056(at 295)
-0.0280(at 260)
-0.0012(at 300)
0.0030 Correlation coefficient 0.9999(at 257)
0.9999(at 295)
0.9999(at 260)
0.9999(at 300)
0.9999(at 295)
0.9999(at 295)
0.9999(at 260)
0.9999(at 300)
0.9999
Validation of response:
Concentration range (µg/mL) 5-85 5-85 2-35 2-35 4-50
LOD (µg/mL) 1.40 1.47 0.37 0.59 0.96
LOQ (µg/mL) 4.24 4.46 1.13 1.80 2.90
Average accuracy % 100.3 99.9 99.9 100.1 100.1
S.D. (precision) 0.702 0.966 0.773 1.116 1.131
D ( D 100/ ) 0.700 0.967 0.774 1.115 1.130
Error ( D/√ n) 0.221 0.306 0.293 0.421 0.461
Repeatability*b± S.D. 99.7 ± 0.374 100.5 ± 0.093 100.6 ± 0.728 100.1 ± 1.670 100.3 ± 1.572 Intermediate precision*b± S.D. 100.5 ± 0.745 99.2 ± 1.495 99.3 ± 0.551 100.0 ± 1.415 100.6 ± 1.054 Specificity 100.6 ± 0.702 100.2 ± 0.839 100.3 ± 0.902 101.1 ± 0.569 99.8 ± 0.503
b. Limits of detection and quantification (LOD-LOQ): LOQ and LOD had been calculated from the linearity of the calibration curve of each method and satisfactory results were obtained Table (2).
c. Accuracy: The proposed methods can determine different concentrations of bulk powder with mean percentage recoveries of 99.4 ± 0.921 for TM and 99.7 ± 1.009 for BT in D1 method. While the proposed
Vierordt’s method can determine different concentrations of bulk powder with mean percentage recoveries of 100.3 ± 0.702 for TM and 99.9 ± 0.773 for BT. Alternatively, the proposed bivariate calibration method can determine different concentrations of
TM and BT in bulk powder with mean percentage recoveries of 99.9 ± 0.966 and 100.1 ± 1.116, respectively. The proposed ΔA method can determine different concentrations of bulk powder with mean percentage recovery of 100.1 ± 1.131 for BT. To prove the accuracy of the proposed methods, the results of the assays of TM and BT in pure forms was compared with those obtained using the comparison method 21. Statistical comparison of the results obtained by the proposed methods with those obtained by the comparison method using student t-test and variance ratio F-test 27 revealed no significant differences between the performances of all methods in Table 3.
d. Precision: Precision of the assays was determined in relation to repeatability (intra-assay) and intermediate precision (inter-assay). In order to evaluate the repeatability of the methods, nine samples were determined during the same day for three concentrations of TM and BT. Intermediate precision was studied by comparing the assays performed on three different days. The SD values were less than 2 demonstrating that the method was precise. Good recoveries were obtained for each concentration, confirming that the method was accurate (Table 2).
e. Selectivity (Application to laboratory-prepared mixtures of TM and BT in presence of BZ): The proposed methods
were successfully applied for the
determination of different ratio of TM and BT in laboratory-prepared mixtures.
TABLE 4: DETERMINATION OF TM AND BT IN LABORATORY PREPARED MIXTURES BY THE PROPOSED METHODS
Proposed Method Concentration (µg/mL) Mean ± SD*
TM BT BZ TM BT
Vierordt’s 34.00
10.00 10.00 10.00 10.00 20.00 0.25 0.10 0.10
100.6 ± 0.702 100.3 ± 0.902
Bivariate calibration 100.2 ± 0.839 101.1 ± 0.569
ΔA --- 99.8 ± 0.503
*Each result is the average of three separate determinations 5. Application to Pharmaceutical
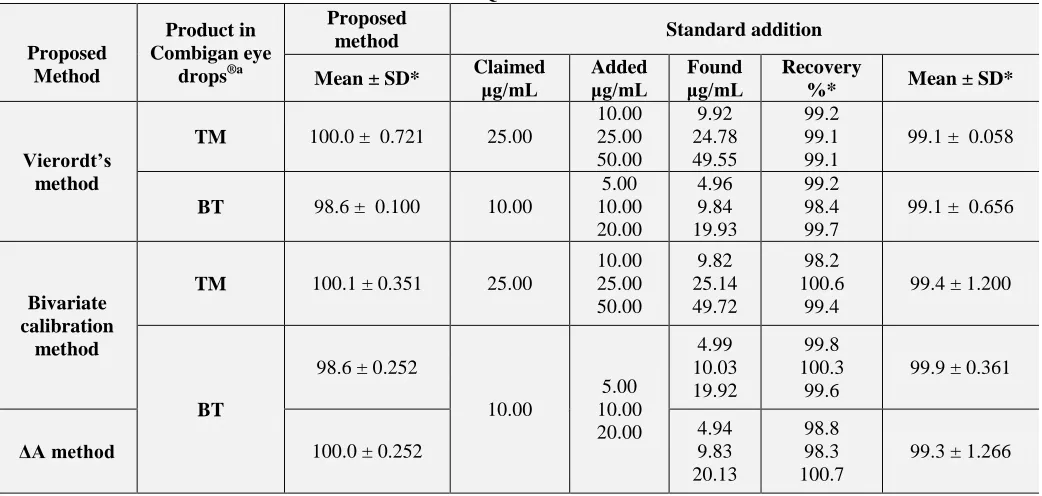
Formulation: The suggested methods were valid and applicable for the analysis of Combigan® eye drops with no interference from the additives or preservative.
The accuracies of the proposed procedures were assessed by applying the standard addition technique and the results were shown in Table 5.
TABLE 5: DETERMINATION OF TM IN COMBIGAN® EYE DROPS BY THE PROPOSED METHODS AND
APPLICATION OF STANDARD ADDITION TECHNIQUE
Proposed Method Product in Combigan eye drops®a Proposed
method Standard addition
Mean ± SD* Claimed μg/mL Added μg/mL μg/mL Found Recovery
%* Mean ± SD*
Vierordt’s method
TM 100.0 ± 0.721 25.00
10.00 25.00 50.00 9.92 24.78 49.55 99.2 99.1 99.1
99.1 ± 0.058
BT 98.6 ± 0.100 10.00
5.00 10.00 20.00 4.96 9.84 19.93 99.2 98.4 99.7
99.1 ± 0.656
Bivariate calibration
method
TM 100.1 ± 0.351 25.00
10.00 25.00 50.00 9.82 25.14 49.72 98.2 100.6 99.4
99.4 ± 1.200
BT
98.6 ± 0.252
10.00 5.00 10.00 20.00 4.99 10.03 19.92 99.8 100.3 99.6
99.9 ± 0.361
ΔA method 100.0 ± 0.252
4.94 9.83 20.13 98.8 98.3 100.7
99.3 ± 1.266
*Each result is the average of three separate determinations. a Batch no. E66681.
CONCLUSIONS: From the previous discussion, it could be concluded that the proposed methods are simple and do not require sophisticated techniques or instruments. They are also sensitive and selective and could be used for routine analysis of simultaneous determination of TM and BT in their available dosage form without prior separation except ΔA method is for sensitive determination of BT only.
There is no significant difference in terms of precision between all the methods. They are economic methods. Only a few minutes were required for the analysis in the developed methods.
REFERENCES:
1- USP 35-NF 30, The United States Pharmacopoeia and National Formulary, Twinbrook Parkway, Rockville, 2012.
2- Nema HV and Nema N: Textbook of Ophthalmology. Sixth Edition, JP Medical Ltd, 2011.
3- The British pharmacopeia, The stationary office, London, 2012.
4- He H, Edeki TI and Wood AJJ: Determination of low plasma timolol concentrations following topical application of timolol eye drops in humans by high performance liquid chromatography with electrochemical detection. J. Chromatogr. B: Biomed. Sci. Appl. 1994; 661(2): 351-356.
[image:10.612.47.568.285.533.2]6- Kulkarni SP and Amin PD: Stability indicating HPTLC determination of timolol maleate as bulk drug and in pharmaceutical preparations. J. Pharm. Biomed. Anal. 2000; 23(6): 983-987.
7- Du J, Quan J and Wang Y: Chemiluminescence determination of timolol maleate by gold nanoparticles-catalyzed luminol-N-bromosuccinimide system. Talanta 2012; 90: 117-122.
8- Nie F, Liu QH and Lu JR: Determination of timolol maleate with soluble Mn(IV) - formaldehyde chemiluminescence system. Yaowu Fenxi Zazhi 2006; 26(2): 236-238.
9- Al-Ghamdi AF: Stripping Voltammetric Determination of Timolol Drug in Pharmaceuticals and Biological Fluids. Amer. J. Anal. Chem. 2011; 2: 174-181.
10- Türkdemir MH, Erdögdu G, Aydemir T, Karagözler AA and Karagözler AE: Voltammetric Determination of Timolol Maleate: A β-Adrenergic Blocking Agent. J. Anal. Chem. 2001; 56(11): 1047-1050.
11- Norouzi P, Ganjali MR, Sepehri A and Ghorbani M: Novel method for fast determination of ultra-trace amounts of timolol maleate by continuous cyclic voltammetry at Au microelectrode in flowing injection systems. Sens. Actuators B. 2005; 110(1): 239-245.
12- Jiang S, Chappa SK and Proksch JW: A Rapid and Sensitive LC/MS/MS Assay for the Quantitation of Brimonidine in Ocular Fluids and Tissues. J. Chromatogr. B. 2009; 877: 107–114.
13- Ali MS, Khatri AR, Munir MI and Ghori M: A Stability-Indicating Assay of Brimonidine Tartrate Ophthalmic Solution and Stress Testing Using HILIC. Chromatographia 2007; 70: 539–544.
14- Anand M, Fonseca A, Santosh GV and Padmanabh DB: Development and Validation of High Performance Thin Layer Chromatographic Method for Estimation of Brimonidine Tartrate as Bulk Drug and in Ophthalmic Solutions. Int. J. PharmTech Res. 2010; 2(3): 1376-1379. 15- Bhagav P, Deshpande P, Pandey S and Chandran S:
Development and Validation of Stability Indicating UV Spectrophotometric Method for the Estimation of Brimonidine Tartrate in Pure Form, Formulations and Preformulation studies. Scholars Res. Library 2010; 2(3): 106-122.
16- Jain PS, Khatal RN and Surana SJ: Development and validation of first order derivative UV-spectrophotometric method for determination of brimonidine tartrate in bulk
and in formulation. Asian J. Pharm. Biol. Res. 2011; 1(3): 323-329.
17- Karamanos NK, Lamari F, Katsimpris J and Gartaganis S: Development of an HPLC Method for Determining the alpha2-adrenergic Receptor Agonist Brimonidine in Blood Serum and aqueous Humor of the Eye. Biomed. Chromatogr. 1999; 13: 86–88
18- Tzovolou DN, Lamari F, Mela EK, Gartaganis SP and Karamanos NK: Capillary electrophoretic analysis of brimonidin in aqueous humor of the eye and blood sera and relation of its levels with intraocular pressure. Biomed. Chromatogr. 2000; 14: 301–305.
19- Shirke RR and Pai N: Reversed phase-HPLC determination of Brimonidine tartrate in brimonidine tartrate eye drops. Indian Drugs 2002; 39(9): 484-486. 20- Acheampong A and Tang-Liu DD: Measurement of
brimonidine concentrations in human plasma by a highly sensitive gas chromatography/mass spectrometric assay. J. Pharm. and Biomed. Anal. 1995; 13(8): 995-1002. 21- Elzanfaly ES, Saad AS and Abd-Elaleem AB: A smart
simple spectrophotometric method for simultaneous determination of binary mixtures. J. Pharm. Anal. 2012; 2(5): 382-385.
22- Elzanfaly ES, Saad AS and Abd-Elaleem AB: Combining the isoabsorptive point in the ratio spectrum and the smart ratio difference methods for a single step determination of compounds with overlapped spectra. Spectrochim. Acta A Mol. Biomol. Spectrosc. 2012; 95: 188–192.
23- Jain PS, Khatal RN, Jivani HN and Surana SJ: Development and Validation of TLC-densitometry Method for Simultaneous Estimation of Brimonidine tartrate and Timolol maleate in Bulk and Pharmaceutical Dosage Form. J. Chromatogr. Sep. Tech. 2011; 2(3).
24- Phogat A, Kumar MS and Mahadevan N: Simultaneous Estimation of Brimonidine Tartrate and Timolol Maleate in Nanoparticles Formulation by RP-HPLC. Int. J. Recent Adv. Pharm. Res. 2011; 3: 31-36.
25- ICH Harmonized Tripartite Guideline, Validation of Analytical Procedures: Text and Methodology, Q2(R1), Current step 4 version, Parent guidelines on Methodology dated November 6; 1996, Incorporated in November 2005. 26- Massart DL, Vandeginste BGM, Deming SN, Michotte Y and Kaufman L: Chemometrics: a Textbook. Elsevier, Amsterdam, 1988.
27- Miller JN and Miller JC: Statistics and Chemometrics for Analytical Chemistry. Fifth Edition, Pearson Education Limited, Harlow, England, 2005.
All © 2013 are reserved by International Journal of Pharmaceutical Sciences and Research. This Journal licensed under a Creative Commons Attribution-NonCommercial-ShareAlike 3.0 Unported License
This article can be downloaded to ANDROID OS based mobile. Scan QR Code using Code/Bar Scanner from your mobile. (Scanners are available on Google Playstore)
How to cite this article: