100
AN EMPIRICAL STUDY OF THE BEHAVIORAL FACTORS
AFFECTING STUDENTS’ PERCEPTION ON ADOPTING
ELECTRONIC ASSESSMENT SYSTEM
1SHERVIN FARZIN, 2HALINA MOHAMED DAHLAN
Faculty of Computer Science and Information System, University Teknologi Malaysia Johor, Malaysia
E-mail: 1[email protected], 2[email protected]
ABSTRACT
Electronic assessment (e-assessment) system inevitably plays a role in the educational environment as one of the means available to measure students learning outcomes. There are large numbers of cases that prove the establishment of an e-assessment system did not bring the promised benefits for students. Meanwhile, many studies focused on technical difficulties of development rather than incorporating the behavioral aspects. This all amounted to create a gap in understanding of e-assessment system adoption from student's point of view. Thus, the main concern in this research would be to identify all the behavioral issues of adopting an e-assessment system from students’ point of view. Alas, encapsulate identified constructs into one model that resolve all the behavioral problems, and at last, investigating the existence of statistical relationship among the proposed constructs. In that sense, the first step would be to recognize real-world problems that students are facing in their practices. The behavioral model has been proposed on the basis of the behavioral essence of the unified theory of acceptance and use of technology. For the model evaluation, the research conducts a survey on 380 students from Open University Malaysia (OUM) who had prior experience with e-assessment system. The results show that the entireties of hypothesis were significantly validated except in the case of habit toward usage intention. Moreover, the statistical findings of this research can create a well-established ground for future research, as well as, developing of e-assessment system for university level students.
Keywords: Electronic Assessment, E-Assessment, Adoption, Behavioral Model of Adoption, UTAUT
1. INTRODUCTION
The interest of study which mostly depends on having unlimited access to educational materials and knowledge bases has been increased rapidly due to gaining easy access through internet and online information bases [1]. In that sense, the role of internet and all internet base programs become dominant, and these contemporary trends been as an influence on the higher education system and due to that the concepts such as electronic learning (e-learning) which became more and more popular these days and provide opportunity for students to attaint classes, interact with lecturers or other students, or even have their exam via internet base software regardless of their whereabouts [2]. As a result, the vital need for proper and accessible online learning materials becomes the main interest since it is fairly important for educational institutions to meet the students’ needs by properly defining the knowledge bases and effectively design an interface so the whole process of e-learning
becomes more useable and enjoyable for students [3].
A fully developed e-learning system can be braked down into several sub-systems which work together in order for the whole system to function properly [4]. The functionality of these sub-systems can varies from managing library documents, to producing top management level reports and handling the process of information in the body of the e-learning system. One of these primary systems which have been described as the pillar of successful implemented e-learning system is electronic assessment system [4].
2. RESEARCH BACKGROUND 2.1 E-ASSESSMENT
101 tool for the organization as well as participants. Also it will benefit the organization by preparing fast feed backs and generating reports to streamline the decision making process [5].
In an educational environment, the traditional way of conducting assessment was for students to attend the assessing session while they bring their own personal facilities. Introducing an e-assessment system to streamline the process of assessment tends to reduce unnecessary efforts that students have to take, also the time that usually takes for lecturers to go through all the papers will helps to reduce time and human efforts dramatically [6].
The findings of prior studies in this regard shows that, students who had prior experience working with e-assessment system(s) found all aspects of the process challenging or problematic, including operating the technology [7]-[8]-[9]. Essentially this confirms the view seen over a decade of e-assessment rollout; there are many legitimate concerns from tutors, learners and universities about all aspects of e-assessment adoption [10].
In light of that, however the system may be beneficial for all parties involved, there are some problems in terms of successful adoption of the system [11]. Regarding the adoption of an e-assessment system, there are two aspects that need to be investigated, technical such as software design, infrastructure, security, and factors that psychologically drive end user’s intentions toward working with the system, which can be define as behavior [12]. Prior studies show the evidence of frustrations that students experience encountering e-assessment system happens due to the lack of behavioral intentions from students [13]. However, large number literature are focusing on technological sides of successful implementation of such system, but less attempts have been made to study other key factors that have positive effect on successful adoption of the system by its users.
2.2 ADOPTION ISSUES
From literature perspective there are some major issues that developers and IT managers are dealing with in regard to developing an e-assessment system. These issues can be mostly related to security, confidentiality, and robustness; however, there is another aspect to the acceptance of the system which can be seen from student’s perspective. They are playing a major rule in terms of adopting the system, therefore considering their point of view on the matter can be decisive. A list of behavioral issues in adopting e-assessment
system based on student’s perception is presented as follow:
Fear of Computer Malfunction: Students' familiarity with assessment related facilities can be extended to their own facilities and their familiar method of input [14]. It was argued that, under the high pressure situation, students will be efficient and more stressed due to the fact that they are not comfortable enough with the level of dependency in the assessment facilities [15]. This mentioned issue, in a way, reflects the fact that under the normal pressure of the assessment itself, students who are participating will have more reasons to get flustered. Thereby the research need to investigate behavioral relevant concepts in order to address this emerged issue as well as existed pressure from fear of computer malfunction [16].
Lack of Technical Support: The majority of e-assessment program and solutions available in the market are applications that to some degrees considered by students to be intrusive [17]. As a result, Staff training is critical in order to guarantee the quality of assessment on a wide scale [18]. The support of dedicated staff is needed in order to ensure support for e-assessment and the reliability of the solution. Dedicated staff may also take full responsibility for assessment development for students [19]. Technical support should provide guidance, also covering instructions for properly using the tools. Failure to find this support may cause serious motivation problems among students. It is thus required that such support should be available in the organization in the long term [18].
Distraction: There is a need to provide all students with an equivalent environment for the reason of fairness while catering to equity issues [20]. Various authorities utilize different definitions of fairness [15]-[21] that range from providing the same environment to all candidates to providing different environments to ensure accessibility to those with disabilities. Furthermore, Krieger [22] argued that under the stressful conditions, noise and other external distractive variables in students’ surrounding must keep to minimal in terms of optimizing their concentration and focus. The assessment system should have a range of accessibility features available to all [15].
102 non-supervised type of assessment such as quizzes, reports, and essays are more likely to be typed. [23]. This would naturally lead to the fact that students due to their familiarity with typing medium, are more prone to typing rather than traditional ways, in particular of assessment cases [24]. Moreover, the increase rate in computer usage has been proved to have negative impact on students' handwriting motor skills [25], which in turn will lead to sensing discomfort and uneasiness during long handwritten assessments. Also it was noted that complains about "exams hurting hands" by the students has been reported in the media [24]. This all will tend to create a gap between modern way of typing and traditional way of pen and paper base assessments [15]-[26]. According to the proposed definition by Wu [27], these practices are in fact the degree of an individual’s actions that perceived to be automatic.
Complicated Interface: Technology enriches the range of assessment scenarios and question types when compared to paper-based approaches [19]. The ability to incorporate multimedia elements with computer-based forms of assessment including video, virtual views, scenarios, software tools, simulations, are all made possible. Traditional paper-based exams provide little opportunity for feedback and have been described as a ‘feedback desert’ [5], however in light of all those beneficial aspects towards a multi-media transformation of the traditional way of assessment, there is the issue of complexity [28]. According to [19], the university should maintain a streamlined process to conduct the process of assessment in terms of software simplicity and robustness.
Lack of Training: Unauthorized data and communication must be excluded from the exam environment. A controlled software environment that provides the ability to prevent students accessing unauthorized resources such as web sites, mobile devices and communications, other candidates, 3rd party helpers outside of the exam room or the hard disk drive of the computer [29]. Due consideration of the principles of information security can guide developers in the early stages of system planning to help ensure a secure and reliable platform, as well as, university IT administration team to plan for training sessions and laying down necessary infrastructures [30].
Being Demotivated: Assessments at universities are of the highest stakes. The process needs to be at least equivalent to paper-based solutions in terms of reliability and validity to be accepted by stakeholders (university administrators, academics, students, parents, employers, governments and the
public) [31]-[32]. Without a secure and reliable solution academics, in particular, will be reluctant to adopt e-assessment systems. If things were to go wrong with the assessment process, the university would risk a loss of reputation as to their status as guardians of standards and as reliable accreditors of graduate achievements. The impact on students affected would also be significant with increased distress at a time of already high stress, which in turn will lead to increase level dissatisfaction [31]. Other studies in this regard also suggest that the other downward to complications like that not only carries immediate effect on the students, but also will shape their intuitions and perspective toward the whole experience, therefore existing negative impacts can lead to negativity and passed to other students causing demotivation and dissatisfaction in them even before they experience the system first hand [32].
Corresponding with the extracted behavioral issues with adoption of e-assessment system, a summary of extracted problems from previous works of literature is as follows: perception of automatic behavior, fear of computer malfunction, lack of technical support, being demotivated, complicated interface, distraction, and lack of training.
As a conclusion, the negative impacts of all those issues can be amounted to resentment and dissatisfaction in students toward adopting new e-assessment system, since their behaviors are shaped based on their personal experience and factors of
social influences.
2.3 PROBLEM MAPPING
103 In continue the research will shed light on important behavioral factors that potentially can be used to resolve behavioral problems of e-assessment adoption.
Habit: According to Ratcliffe [24], increased computer use among students in the higher education sector has been shown to reduce handwriting motor skills which can be defined as the degree of an individual’s actions that perceived to be automatic. In light of the fact that students tend to feel discomfort in practicing examination in its traditional sense, it can be addressed by investigating further into the factor of habit, since the definition presented by previous studies [23]-[25]-[24] fits the problem students are facing. In addition, habit as a construct reflect on students cognitive abilities, thereby, according to the definition of behavioral factors, habit can be considered a behavioral construct in adopting e-assessment system.
Habit can be considered to be based in part on the ability of the individual to learn the particular behavior cognitively. Thus habit represents the automatic behavior tendencies developed during the past history of the individual. Thus a particular situation will provoke the behavior even when the individual does not instruct him or herself to perform the act, as in the case of using e-assessment system by students, based on the definition that has been presented under the key word of “Fine Motor Skills” [27]-[36]. According to researches such as Karaiskos [37], it has been shown that habit has a direct effect on technology use and individuals intention to use.
Anxiety: There are unpleasant side effects to the use of technology such as being in a negative state of emotions that occurs before, during and after engaging with a technical system, when the thoughts of interaction start in an individuals’ mind. Strong emotional states like anger, frustration, and anxiety are shown to have a significant impact on productivity, the process of learning, social interaction as well as actual system use [16].
The state of anxiety can be understood from three different perspectives. Firstly, is trait anxiety which has been defined as a state of emotion that an individual experience over the course of his or her life in general. The second type would be the state of anxiety worrisome experiences and can be facultative over time. The third is concept dependent anxiety which is a mixture of trait and state anxiety [38]. The element of anxiety relevant to this research area can be classified under the
second type of anxiety which is the state anxiety since the feeling will emerge before or during and engagement with an e-assessment system [35].
Also, it can be defined as the uncontrolled occurrence of an anxious or emotional reaction when it comes to performing behavior according to Hsu [39]. In the case of the traditional assessment system, anxiety can play a critical role and in the case of electronic assessment studies such as Stowell [40], shows it has a negative effect toward student’s behavioral intention of using a technology to complete their assessment process.
Usage Comfort: Usage comfort represents the degree of simplicity to use a particular system which reveals the degree to how much effort the user put to use the system [41]. As can be seen, usage comfort in a way or another represent perceived ease of use in the original TAM model and effort expectancy from UTAUT. Multiple studies in the context of adopting new technology postulate that there are significant differences in the influence of usage comfort on students’ willingness to use e-learning instruments and tools [42]-[43].
According to Karaiskos [37], usage comfort reflects on the behavioral aspects of information system adoption. In fact, as many learners in developing countries are not exposed to many information systems this construct is an important determinant of learning behavioral intention to use such systems [44]-[45].
Perceived Practicality: Perceived practicality is a belief about the future rather than the current existence [46]. This means that while one person perceives their efforts to lead to a great accomplishment, another person may believe their same effort will not lead to much accomplishment at all. This difference in perceptions is due to many factors. Two factors that can affect perception of practicality are ability and interest [46]. Lack of ability or interest will decrease a person’s expectancy. With proper training and a high-interest level, people will have an increased level of expectancy. University’s IT administration needs to consider this fact as they create ways to help motivate students. By encouraging students and building self-efficacy, IT staff can increase students’ perceived practicality [47].
104 influence their perception toward adopting the system [19]-[28].
Perceived Confidence: Normative beliefs result in perceived social pressure or so-called perceived confidence. In other words, perceived confidence relate to the individual’s perception of social pressure from others who are important to them (e.g. family, friends, colleagues) to behave (or not) in a certain manner and their motivation to comply with those people’s views [48]. According to King and Boyatt [49], perceived confidence is determined by beliefs about the extent to which significant others want them to perform a behavior. The study also distinguishes between injunctive and descriptive norms as separate sources of motivation, with the perceived confidence component of the theory of planned behavior being injunctive social norms, since it relates to the opinion of significant others, and descriptive norms referring to perceptions of significant others' own attitudes and behavior in the domain.
Perceived confidence can be defined as the degree to which an individual believes using an electronic system will be influenced by the degree of other’s belief and understanding. Social Influence is the equivalent of the construct perceived confidence in most of the socio-technical models, which serves to address issues surrounding the matter from a social perspective. In the case of e-assessment adoption there are real world problems faced by students, thus all those problems amount to negatively influence students perception toward adopting e-assessment system, and not only that but also leads to negatively demotivated them which then turn to passing the demotivation feeling to the other students in the social groups [31]-[32].
Situational Support: Situational support defined as the degree to which an individual believes that an organizational resource and technical infrastructure are existed to support his or her use of the system [42]. According to similar studies done by Yoo [50], situational support can be defined as the availability of support and assistance was given to students to integrate with new technology. Researchers have discussed many obstacles that prevented students from integrating technology in their learning and assessing the process and some examples of their findings are the lack of adequate infrastructure, lack of personal technology expertise [51] and inadequate technical support [52]-[53]. These studies reported that situational support and the availability of support to students are the major ‘obstacles’ to the process of integrating technology into learning and assessing process by universities.
This situation applies to new students, who normally showed a higher level of confidence in using technology.
In the case e-assessment adoption, the need for providing an assessment system that has a range of accessibility features available to all can be relatively challenging, which in turn can lead to dissatisfaction due to lack of technical support during the assessment session [15].
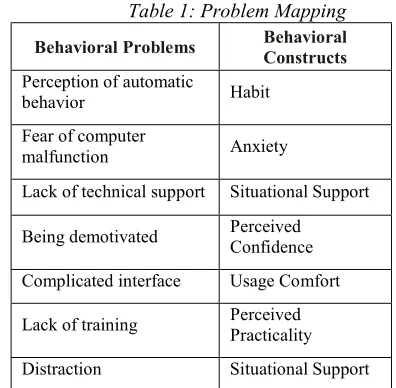
[image:5.612.317.515.250.444.2]To summarize, Table 1 shows a cross mapping of identified problems in e-assessment adoption with corresponding factors that can resolve those issues.
Table 1: Problem Mapping
Behavioral Problems Behavioral Constructs
Perception of automatic
behavior Habit
Fear of computer
malfunction Anxiety
Lack of technical support Situational Support
Being demotivated Perceived Confidence
Complicated interface Usage Comfort
Lack of training Perceived Practicality
Distraction Situational Support
3. HYPOTHESIS AND RESEARCH MODEL
Venkatesh [54], suggested that in the case of adopting any new technology there are some factors involved that measure end-users behaviors, such as their perception of effort expectancy, performance expectancy, social norms, and facilitating conditions. However, more recent studies [13]-[55]-[24]-[47]-[5] stands to prove that the real problem in regard to adopting e-assessment system is something beyond the presented factors in one contemporary adoption theory. On that note, most socio-technical theories are too generalized for their own benefits and there is no single model that was developed to address the problems emerges in a specified situation as in adoption of e-assessment system. In addition, there are problems faced by students that are not fitted or addressed in one conceptual framework and in order to resolve this, the need for developing a behavioral model specifically for the case of e-assessment adoption have comes to light.
105 such as sociotechnical theories, there are lots of variables and constructs involved which in turn stand to represent a single problem or set of issues in regard to measuring student’s behavior toward adopting e-assessment system. Considering a limited number of studies in this extent, there are some identified problems in terms of e-assessment adoption from students perspective that can be addressed by behavioral constructs.
All of the behavioral elements that were presented in table 1 are having roots in socio-technical theories of adoption. Also it is noticeable that UTAUT encapsulate most the behavioral elements of e-assessment adoption. Thereby, it can be concluded that UTAUT would serve as a suitable underling theory to address behavioral issues and problem from students’ perspective of e-assessment adoption.
3.1 USAGE COMFORT
Usage comfort points to the fact that how well and clear an electronic system will interact with its users, in the sense of time and mental effort that working with system user interface takes from users and working their way through the system processes to do what they required. In numerous prior studies focus was on the importance of the usage comfort element in terms of interacting with information base technologies [56]-[57]-[47].
In addition, similar to prior research which was centralized on the effect of usage comfort on end user’s perspective, it has been supported that it can have an impact on users standpoint of the overall system model and it will consequently effect and influence their behavioral intention to use electronic base system or reject it. Based on these facts, the following hypothesis for this research is presented:
H1: Usage comfort has positive effects on student’s behavioral intention.
3.2 PERCEIVED PRACTICALITY
Perceived practicality is the degrees to which an individual believe that using the system will help him or her to increase job performance. In the case of e-assessment adoption there are some real world problems faced by students such as lack of sufficient training sessions for students that can influence their perception toward adopting the system, therefore considering perceived practicality as a construct can address those identified issues [19]-[28].
According to Song [56], perceived practicality has been used to measure user productivity amount
employees. It measured that employees which are software end users are in this believe that having and using a computer in their workplace would increase their productivity, increase effectiveness of them on their respective tasks, and also enhance their job performance which consequently leads them toward job satisfaction. In addition, based on their research they defined perceived practicality as the state of being positively in this believe that using some certain information system in the job can lead toward improved performance and increase the level of satisfaction. Therefore it is concluded that perceived practicality influence on behavioral intention and the following hypothesis is proposed:
H2: Perceived Practicality positively influence Behavioral Intention.
3.3 SITUATIONAL SUPPORT
Situational support defined as the degree to which an individual believes that an organizational resources and technical infrastructure are existed to support his or her use of the system. In the case e-assessment adoption the need for providing an assessing system that have a range of accessibility features available to all can be relatively challenging, which in turn can lead to dissatisfaction due to lack of technical support during an assessment session [58]-[47]. Due to that reason, studying the effect of situational support must be considered.
Moreover, according to Bindhu [59], situational support can directly influence students behavioral and shape their intentions toward using any educational electronic means, such as an e-assessment system; thereby, due to the important effect of situational support on student’s intention to use, the following hypotheses are presented:
H3: Situational support has positive effects on behavioral intention.
H4: Situational support has positive effects on usage intention.
3.4 ANXIETY
106 the state anxiety, since the feeling will emerge before or during and engagement with an information system [35].
Another definition of anxiety can be relied with the tendency to which an individual experience uneasiness when using computer [54]. In addition previous studies have shown that anxiety has a significant impact on computer-related activities such as computer use, computing skills, attitudes toward computers, intentions to use computers or software applications, and perceived ease of use [16]. These findings showed that anxiety increases resistance to computer technology and represents an obstacle to an individual’s involvement with computers, an in turn, will negatively affect one’s behavioral and actual usage intentions to work with an electronic system [60]. According to Powell [35], this construct covers affecting emotional reactions and anxiousness when it comes to using a technology. As a result of prior finding in regard to effects of anxiety as a construct of behavioral intention, following hypotheses are presented in this research:
H5: Anxiety negatively affects behavioral intention.
H6: Anxiety negatively affects usage intention.
3.5 PERCEIVED CONFIDENCE
Base on the study that has been conducted by Shroff [31], it has been argued that external elements such as social or environmental variables may lead to individual’s perception of confidence; thereby perceived confidence was considered an important factor to determine individual’s intention to use a system.
In the current research, the perceived confidence has been added to explain the effect of social elements that influence student’s perception toward adopting an information base system. In addition, this element has been presented by Venkatesh [54]. Moreover, based on prior studies [56]-[42] normative pressure, or in this case perceived confidence, is pointing to this fact that people behavioral pattern can be influenced by perceptions and perspective of others that surrounding them. Peoples like friends, parents, and lecturers regarding to educational environment [56]. Also Tan [47], explained social pressure in the same way as a result of several previous studies regarding perceived confidence in university level students.
As it’s been demonstrated by prior studies, in an educational environment, intention to use of electronic system by students may indeed be in
direct correlation with society that surrounded students and they will be influence by it [61], therefore base on mentioned facts, the following hypotheses was concluded:
H7: Perceived confidence positively influence student’s behavioral intention.
H8: Perceived confidence positively influence student’s usage intention.
3.6 HABIT
Habit can be considered to be based in part on the ability of the individual to learn the particular behavior into a cognitive script. Thus habit represents the automatic behavior tendencies developed during the past history of the individual. Thus a particular situation will provoke the behavior even when the individual does not instruct him or herself to perform the act, as in the case of using e-assessment system by students [62].
In addition to this direct effect on behavior, habit should also have an interactive effect. As a particular behavior becomes more routinized, habit becomes more dominant and intention should no longer have as much effect. In this study habit will be theorized to effect behavior directly and that intentions will mediate between habit and actual behavior.
According to prior studies [42]-[62]-[63], it has been shown that habit has a direct effect over technology use and individuals intention to use. In this study, the researcher adopts the above discussed conceptual definitions of habit. As a result the following hypotheses are presented in this research:
H9: habit positively influences student’s behavioral intention.
H10: habit positively influences student’s usage intention.
3.7 BEHAVIORAL INTENTION
Behavioral intention is defined as a person's perceived likelihood or subjective probability that he or she will engage in a given behavior [42]. Intention has been represented in measurement by other synonyms and is distinct from similar concepts such as desire and self-prediction [6]. Bindhu [59], argued that behavioral intention reflects how hard a person is willing to try, and how motivated he or she is, to perform the behavior.
107 variable that leads to actual usage of a given system. Behavioral intention has been found to have high predictive validity in relation to Intention to Use [42]-[59], indicating that respondents in general, tends to show their usage intention is aligned with their behavioral intention to use a system [47]. As a result of these findings, the following hypothesis is presented in this research:
H11: Behavioral intention positively influences usage intention.
3.8 USAGE INTENTION
Base on the research done by Mandal [57], usage intention was defined as a direct function of attitude which in turn runs from individual behaviors and can be describe as the way that a person been disposed towards an object which can be divided into negative affection or positive [57]. In the
educational environment any attempt of
implementing a new technology or system is in great need of support from teachers, lecturers as well as students.
In other words, positive behaviors or negative ones can influence the way that students and teachers may react in case that they been exposed to the new technology or new implemented system [47]. In addition, it’s been mentioned that teachers with low level intention of using computers which was defined as negative attitude toward using computers, may not be able to encourage their students to work with new computer base system [47].
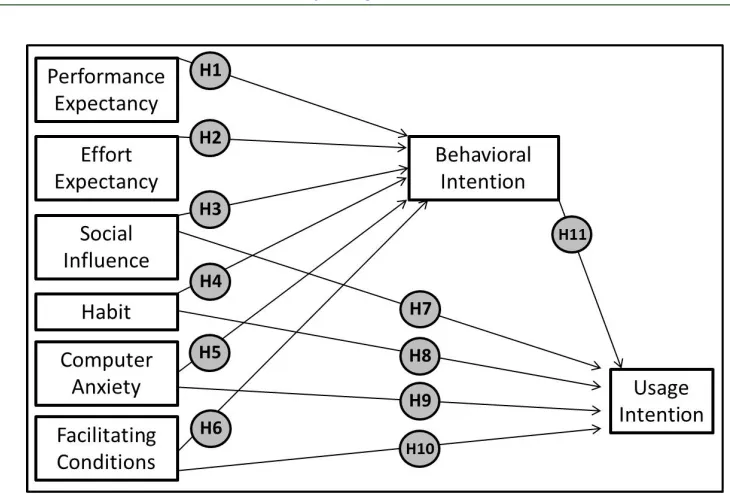
The proposed model in this reach stands to imply that there are five behavioral elements that have effects on usage intention which are behavioral intention, perceived confidence, situational support, anxiety, and habit.
In figure 1, the entire behavioral constructs of this research are incorporated into a shell of UTAUT model, in order to present a behavioral tailored model to address all of the behavioral problems that are faced by students in regard to adopting an e-assessment system.
4. RESEARCH METHOD
The explanatory research design was adopted due to the nature of the study since there are some hypothesis that needs to be tested before commencing the data collection process; a study that tries to investigate and explain the relationships between the independent, mediators and the dependent variables of conceptual model. The
quantitative research approach has been used for this study.
4.1 DATA COLLECTION
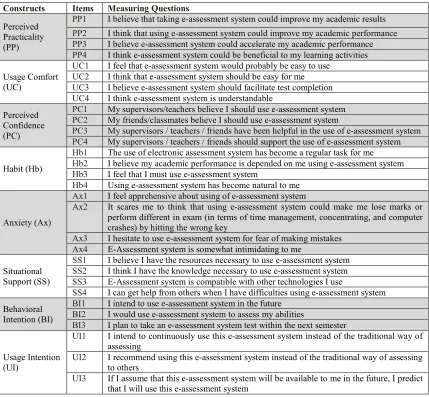
A survey technique was used to collect data. The population sample is consisting of students from Open University Malaysia (OUM) who has prior experience using an e-assessment system. In order to efficiently use the survey method, a 30 items questionnaire was developed. The questionnaire was intricately designed to gauge the impact of behavioral factors on students in regard to them interacting with an e-assessment system. However, the questions used in the instrument were adopted from prior studies that focused on one or more of these same constructs. The research obtained 380 responses out of 420 distributed questionnaires.
To design the questionnaire several available
questionnaires were reviewed. The main
questionnaires the researcher used in this study is from the study done by Venkatesh [42], on investigating the usage of information technology to expand UTAUT model [42]. Moreover, a UTAUT analysis adoption done by [47], a comparison study regarding computer anxiety done by [35], a research on web site design and usage behavior done by Al-Qeisi [63], are another sources for this study for designing the questionnaire. In Table 2, list of all the questionnaire items are provided.
5. RESULTS
In this phase, a series of test will be conducted to insure the reliability and validity of the collected data as well as reporting the descriptive results and result of data analysis to test the proposed hypothesis of this research using Statistical Package for Social Science (SPSS) software. In addition, the relationships among variables are explained in such a way to reflect the meaning of accepted or rejected hypothesis and the effect it will carry to the commercial world, wither facing by e-assessment beneficiaries or to the development team.
The next step will continue to investigate further more into the validity and reliability of the collected data, to insure that, a test for instrument reliability will be carried on. In continue, there are two aspects to test for validity of the data which are test for convergence validity and test for discriminate validity. The end result of these tests will insure the acceptance of the collected data for putting them through to the core level of data analysis which is multiple regression analysis.
108 variables as well as testing for inter-connection dependency. This stage will be the determinants for the hypothesis testing. And finally, the result of data analysis will be mapped with research proposed hypothesis to investigate the significance of identified constructs and the accordance of their relationships based on the research hypothesis.
5.1 INSTRUMENT RELIABILITY
The test of reliability according to Stone [65] goes to show, if the entire measured items in a
survey, successfully measuring the same
characteristics or traits of the same construct. By proving the reliability of the test results, it can be seen that how stable and consistent these results are in order to collect relevant information which will be used to combine and represent constructs in the model. Reliability test helps to gauge the goodness of answers [66].
The most practiced method to conduct this test is called Cronbach’s Alpha test. According to Brown [67], the more closer the value of Cronbach’s Alpha test gets to 1, shows more consistency among the items that measure one particular construct. Also it was noted that any Cronbach’s Alpha value equal or greater than 0.7 will be sufficient. Table 3 below; demonstrate the result of Cronbach’s Alpha test for each construct in the survey.
Table 3: Result of Reliability Test
Construct Cronbach’s Alpha
Usage Comfort 0.795 Perceived Practicality 0.891 Situational Support 0.956
Anxiety 0.882
Perceived Confidence 0.798
Habit 0.805
Behavioral Intention 0.793 Usage Intention 0.904
As it was demonstrated in table 3, all the measured values of Cronbach’s Alpha is greater than 0.7 which shows the adequate level of reliability among the instruments items.
5.2 INSTRUMENT VLIDITY
Validity is the extent to which an instrument measures what it is supposed to measure and performs as it is designed to perform. It is rare, if nearly impossible, that an instrument be 100% valid, so validity is generally measured in degrees [68].
The main purpose of conducting validity test is to insure that all the items in the instrument are converging into one stand-alone component. In another word, it shows how good items will
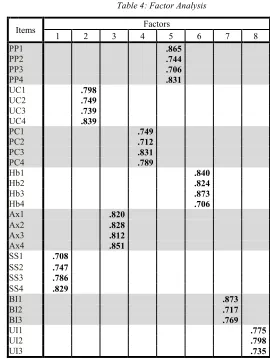
converge into measuring one construct [65]. Using SPSS, there are number of test that can be executed in order to insure of instrument validity. The main test that is widely used is called factor analysis [69]. As for this study by collecting data from 380 respondents and representing all those data in 30 different items thereby in order to extract 6 items which represent the model perfectly we need to use factor analysis for extracting 6 factors. After the analysis a single value names factor loading will represent the strength of measurements among all items. Table 4 will illustrate the result of factor analysis across 30 set of data.
As it has been demonstrated in table 4, all items that are used in this study to measure corresponding variables, falls in under the same factors, which proves the fact that the instrument used in this research is statistically valid.
5.3 MULTIPLE REGRESSION ANALYSIS
In order to study and examine all eleven hypotheses; there is the need to conduct a multiple-regression test. The multiple-regression analysis is a tool to reveal any linearity in terms of a predictable model among factors which is this case consists of one dependent variable, one mediator, and six independent variables.
According to Pallant [70], the significance of correlation can be examined by explaining the
effect t-value in standardize coefficient
measurement from the results of multiple regression analysis. A summary of the coefficient results of multiple regressions is presented in Table 5 to further test the research hypotheses.
Based on the result of Path coefficient of multiple regression analysis, it can be explained that since the sig. value of all the hypotheses is less than 0.05, then it can be conclude that all of the research hypothesis are supported except for the path from Habit toward Usage Intention, which is represented by sig. value equal to 0.094 that is greater than 0.05, therefore hypothesis 10 of the research has not been statistically supported.
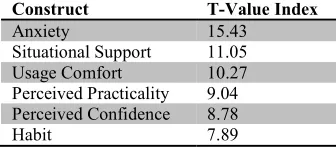
109 Table 6: Importance Construct Analysis
Construct T-Value Index
Anxiety 15.43
Situational Support 11.05 Usage Comfort 10.27 Perceived Practicality 9.04 Perceived Confidence 8.78
Habit 7.89
As it has been illustrated in table 6, anxiety with the T-Value index equal to 15.43 is measured to be the most relevant variable according to the students. It followed by situational support, usage comfort, perceived practicality, perceived confidence and last Habit.
6. DISCUSSION
According to the result of multiple regression analysis for this research, it was proved that Usage Comfort, directly and positively influence Behavioral Intention. This result has been supported by prior studies done in the field adoption [56]-[57]-[47]-[59]. Tan [47], argued that from students perspective, usage comfort plays an important role in terms of adopting an electronic placement test software. Usage comfort with the t-value equal to 10.276 shows a strong relationship toward behavioral intention of students for adopting and e-assessment system. This result implies that software developers and managers, who are involved in the process of developing e-assessment system, must consider the easiness and comfort of using the system, since it has been proven to be highly important from adoption perspective.
Second hypothesis of the research states that, there is a positive relationship between perceived practicality and behavioral intention. This hypothesis has been suggested by many other studies that aimed to identify adoption related factors [56]-[19]-[42]-[28]. According to Song [56], perceived practicality has been used to measure user productivity amount employees that are interacting with software in their work place and it has positive impact on employee’s intention toward the system in general. Perceived practicality with the t-value equal to 9.045 shows a strong relationship with student’s behavioral intention toward using an e-assessment system.
Third and Forth research hypothesis states that, situational support has a positive relationship with
behavioral intention and usage intention
subsequently. These two hypotheses were supported by the findings of this research as the t-value of situational support toward behavioral intention was
measured to be 11.219, and also, t-value toward usage intention was measured to be 11.058, illustrating a very strong relationship between situational support and behavioral intention as well as situational support towards usage intention. It was stated by Bindhu [59], that situational support can directly influence students behavioral and shape their intentions toward using any educational electronic means.
The fifth and sixth hypotheses in this research state that, there is a negative relationship between anxiety and behavioral intention, as well as anxiety towards usage intention. It was suggested by other researchers [38]-[35]-[16]-[60] that state of anxiety during computer interaction can lead to user’s resistance toward adopting the system in general. Anxiety has a significant impact on computer-related activities such as computer use, computing skills, attitudes toward computers, intentions to use computers or software applications. In accordance with the findings of this research, there is a significantly strong correlation between anxiety and behavioral intention which was measured with t-value being equal to 15.435, also anxiety strongly effect intention to use with the t-value being equal to 11.496. These measurements perfectly aligned with the findings of prior studies in regard to investigate the negative effect of anxiety toward adopting e-assessment system. As a result, it is
highly advisable for management and
administration of universities to put eliminating the negative effect of anxiety at the top of their priorities since among all six constructs, anxiety carries the most notable significance toward students’ behavioral intention.
110 behavioral intention, and also 8.652 toward usage intention, showing a strong positive relationship between perceived confidence with behavioral intention as well as usage intention.
Ninth and tenth hypothesis that are presented in this research states that, Habit positively influence behavioral intention and usage intention. In accordance to the result of data analysis, Habit with the t-value equal to 7.892 has a significant effect over behavioral intention. This relation has been examined and supported by other researchers [42]-[37]-[63]-[62]. According to Karaiskos [37], it has been shown that Habit has a direct effect over technology use and individuals intention to use in the field of mobile data banking, which aligns with the result of analysis in this research. However, in contrast to the reported results of other researches, significant value of the relationship between Habit and usage intention was measured to be less than satisfying value (<0.05) thereby, it is concluded that in the field of e-assessment adoption, there is no direct and significant relationship between Habit and usage intention. Therefore hypothesis ten was not supported, never the less, the effect of Habit over behavioral intention was significant enough for university official to take this factor into their consideration.
The Eleventh hypothesis that demonstrated in this research states that, there is positive relationship between behavioral intention and usage intention. This hypothesis has been practiced and proven to exist by many researchers in the field of general adoption [54]-[64]-[31]-[57]-[42]-[47]-[59]. Also in particular, by some in the field of e-assessment adoption [71]-[72]-[58]. Based on the result of data analysis in this research, behavioral intention with t-value equal to 12.041 had a strongly positive relationship with usage intention, and as a result, it supports the findings of prior studies in this field.
7. CONCLUSION
In conclusion, there are considerable numbers of behavioral related problems that occurs from students’ point of view in regard to e-assessment practice. Identifying said problems can bring numerous benefits for the key players and stake-holders in higher education sector as well as building up a set for future researchers to address recognized problems accordingly. Furthermore, the negative impacts of all those issues can be amounted to resentment and dissatisfaction in students toward adopting new e-assessment technology, since their behaviors are shaped based
on their personal experience and factors of social influences.
An important part of literature review in this research is the result of identifying behavioral issues of adoption and in continue, categorizing behavioral factors that can successfully address all those issues. According to Powell [35], most of the factors representing the problems and issues are carrying both behavioral and technical essence. However, due to the fact that the main focus of this research is to identify behavioral factors that influence adoption of e-assessment system, an attempt was made to extract the behavioral essence of identified constructs, as well as, incorporating said constructs into one behavioral model that addresses all the behavioral related issues of adopting e-assessment system based on students’ perception.
Moreover, the research take a step forward to empirically investigate the relationship amongst the identified variables embedded in a shell of UTAUT model. Statistical analysis in that regard was conducted and furthermore presents evidence that statistically there were significant relationship between six independent variables presented in the research towards students’ behavioral intention to use e-assessment system. Also it was shown with the exception of habit, the rest of measuring constructs are significantly influencing students’ actual intention to use e-assessment system. The result of research analysis shows that amongst the entire set of behavioral related problems that students are facing in regard to their interaction with e-assessment system, anxiety proves to have the highest impact amounts all. Thereby, it is highly advisable to software developers and universities’ IT administration team to take anxiety in to the account before planning on e-assessment system implementation.
REFERENCES:
[1] Nair, I., & Das, V. M. (2012). Using
Technology Acceptance Model to assess teachers’ attitude towards use of technology as teaching tool: A SEM
Approach. International Journal of
Computer Applications, 42(2).
[2] Akinsanmi, O., Ruth, O. T., & Soroyewun,
M. B. (2010). Development of an
E-Assessment Platform for Nigerian
Universities. Research Journal of Applied
Sciences, Engineering and
111
[3] Pedersen, C., White, R., & Smith, D.
(2012). Usefulness and reliability of online
assessments: a Business Faculty's
experience. International Journal of
Organizational Behavior, 17(3), 33-45.
[4] Riad, A. M., & El-Ghareeb, H. A. (2008).
A Service Oriented Architecture to Integrate Mobile Assessment in Learning
Management Systems. Online
Submission, 9(2), 200-219.
[5] Scoles, J., Huxham, M., & McArthur, J.
(2013). No longer exempt from good practice: using exemplars to close the feedback gap for exams. Assessment & Evaluation in Higher Education, 38(6), 631-645.
[6] Mbarek, R., & Zaddem, F. (2013). The
examination of factors affecting e-learning effectiveness. International Journal of Innovation and Applied Studies, 2(4), 423-435.
[7] Chew, E., Jones, N., & Blackey, H.
(2010). Implementing institutional online assessment–addressing the challenges. In International Conference on Hybrid Learning (pp. 453-464). Springer Berlin Heidelberg.
[8] McCann, A. L. (2010). Factors affecting
the adoption of an e‐assessment
system. Assessment & Evaluation in Higher Education, 35(7), 799-818.
[9] Stödberg, U. (2012). A research review of
e-assessment. Assessment & Evaluation in Higher Education, 37(5), 591-604.
[10] Osuji, U. S. (2012). The use of
e-assessments in the Nigerian higher education system. Turkish Online Journal of Distance Education, 13(4), 140-152.
[11] Tan, P. J. B. (2013). Applying the UTAUT
to Understand Factors Affecting the Use of English E-Learning Websites in Taiwan. SAGE Open, 3(4), 2158244013503837.
[12] Ayo, C. K., Akinyemi, I. O., Adebiyi, A.
A., & Ekong, U. O. (2007). The prospects of e-examination implementation in Nigeria. Turkish Online Journal of Distance Education-TOJDE, 8(4), 125-134.
[13] Park, S. Y. (2009). An Analysis of the
Technology Acceptance Model in
Understanding University Students'
Behavioral Intention to Use e-Learning. Educational Technology & Society, 12(3), 150-162.
[14] Joshua, M. T., & Ikiroma, B. (2012).
Computer-Based testing in Nigeria's
university entrants' matriculation
examination: Readiness and acceptability of critical stake-holder.
[15] Fluck, A. (2012). State wide adoption of
e-assessments. In Ensuring quality and standards for e-assessments in Tertiary
Education: Redefining innovative
assessment in the digital age (pp. 1-9).
[16] Saadé, R., Kira, D., & Nebebe, F. (2013).
The Challenge of Motivation in e-Learning: Role of Anxiety. In Proceedings of the Informing Science and Information Technology Education Conference (Vol. 2013, No. 1, pp. 301-308).
[17] Llamas-Nistal, M., Fernández-Iglesias, M.
J., González-Tato, J., & Mikic-Fonte, F. A. (2013). Blended e-assessment: Migrating classical exams to the digital world. Computers & Education, 62, 72-87.
[18] Bennett, S., Dawson, P., Bearman, M.,
Molloy, E., & Boud, D. (2016). How technology shapes assessment design: Findings from a study of university teachers. British Journal of Educational Technology.
[19] Crisp, G. (2011). Teacher’s Handbook on
e-Assessment. Transforming Assessment-An ALTC Fellowship Activity, 18.
[20] Apampa, K. M., Wills, G., & Argles, D.
(2010). An approach to presence verification in summative e-assessment security. In Information Society (i-Society), 2010 International Conference on (pp. 647-651). IEEE.
[21] Gathuri, J. W., Luvanda, A., & Kamundi,
S. M. M. S. (2014). Impersonation challenges associated with e-assessment of university students. Journal of Information Engineering and Applications ISSN 2224-5782 (print) ISSN 2225-0506 (online), 4(7).
[22] Krieger, K. (2015). Creating learning
material from web resources. In European Semantic Web Conference (pp. 721-730). Springer International Publishing.
[23] Mogey, N., Paterson, J., Burk, J., &
Purcell, M. (2010). Typing compared with handwriting for essay examinations at university: letting the students choose. Research in Learning Technology, 18(1).
[24] Ratcliffe, R. (2012). Exams make our
hands sore, say students. The Guardian.
112 http://www.guardian.co.uk/education/mort arboard/2012/jan/25/exams-make-our-hands-sore
[25] Sülzenbrück, S., & Heuer, H. (2011). Type
of visual feedback during practice influences the precision of the acquired internal model of a complex visuo-motor transformation. Ergonomics, 54(1), 34-46.
[26] Dermo, J. (2009). E‐Assessment and the
student learning experience: A survey of
student perceptions of e‐assessment.
British Journal of Educational
Technology, 40(2), 203-214.
[27] Wu, Y. L., Tao, Y. H., & Yang, P. C.
(2007). Using UTAUT to explore the behavior of 3G mobile communication users. In Industrial Engineering and Engineering Management, 2007 IEEE International Conference on (pp. 199-203). IEEE.
[28] Hillier, M., & Fluck, A. (2013). Arguing
again for e-exams in high stakes examinations. In 2013 Australian Society for Computers in Learning and Tertiary Education Conference (pp. 1-11).
[29] Whitman, M. E., & Mattord, H. J. (2010).
The enemy is still at the gates: threats to information security revisited. In 2010
Information Security Curriculum
Development Conference (pp. 95-96). ACM.
[30] Rout, G., & Patnaik, S. (2011). A case
study on E-examination in universities in Odisha. International Journal of Internet Computing, 1(2).
[31] Shroff, R. H., & Vogel, D. R. (2009).
Assessing the factors deemed to support individual student intrinsic motivation in technology supported online and face-to-face discussions.
[32] Cho, J., & Eberhard, B. (2013). When
Pandora's Box Is Opened: A Qualitative Study of the Intended and Unintended Impacts of Wyoming's New Standardized Tests on Local Educators' Everyday Practices. Qualitative Report, 18, 20.
[33] Liu, S. H., Liao, H. L., & Peng, C. J.
(2005). Applying the technology
acceptance model and flow theory to online e-learning users’ acceptance behavior. E-learning, 4(H6), H8.
[34] Farzin, S., & Dahlan, H. M. (2016).
Proposing a model to predict students’ perception toward adopting an E-Assessment system. Journal of Theoretical
and Applied Information Technology, 90(1), 144.
[35] Powell, A. L. (2013). Computer anxiety:
Comparison of research from the 1990s and 2000s. Computers in Human Behavior, 29(6), 2337-2381.
[36] Mogey, N., & Fluck, A. (2014). Factors
influencing student preference when comparing handwriting and typing for essay style examinations. British Journal of Educational Technology.
[37] Karaiskos, D. C., Drossos, D. A.,
Tsiaousis, A. S., Giaglis, G. M., & Fouskas, K. G. (2012). Affective and social determinants of mobile data services
adoption. Behavior & Information
Technology, 31(3), 209-219.
[38] Oye, N. D., A Iahad, N., Rahim, A., &
Zairah, N. (2012). Behavioral intention to accept and use ICT in public university: integrating quantitative and qualitative data. Journal of Emerging Trends in Computing and Information Sciences, 3(6), 957-969.
[39] Hsu, M. K., Wang, S. W., & Chiu, K. K.
(2009). Computer attitude, statistics anxiety and self-efficacy on statistical software adoption behavior: An empirical study of online MBA learners. Computers in Human Behavior, 25(2), 412-420.
[40] Stowell, J. R., & Bennett, D. (2010).
Effects of online testing on student exam performance and test anxiety. Journal of Educational Computing Research, 42(2), 161-171.
[41] Venkatesh, V., Thong, J. Y., Chan, F. K.,
Hu, P. J. H., & Brown, S. A. (2011).
Extending the two‐stage information
systems continuance model: incorporating UTAUT predictors and the role of context. Information Systems Journal, 21(6), 527-555.
[42] Venkatesh, V., Thong, J. Y., & Xu, X.
(2012). Consumer acceptance and use of information technology: extending the unified theory of acceptance and use of technology. MIS quarterly, 36(1), 157-178.
[43] Lancaster, S., & Lancaster, P. (2016).
Online Learning: Students’ Perception, Satisfaction, and Comfort. In Global Learn (Vol. 2016, No. 1, pp. 460-465).
[44] Mtebe, J. S., & Raisamo, R. (2014).
113 education in Tanzania. The International Review of Research in Open and Distributed Learning, 15(2).
[45] Tarhini, A., Hone, K., & Liu, X. (2014).
The effects of individual differences on e-learning users’ behavior in developing countries: A structural equation model. Computers in Human Behavior, 41, 153-163.
[46] Redmond, M. (2014). Combining
explanation types for learning by understanding instructional examples. In 11th Annual Conference Cognitive Science Society Pod (p. 147). Psychology Press.
[47] Tan, P. J. B. (2013). Students’ adoptions
and attitudes towards electronic placement tests: A UTAUT analysis. American Journal of Computer Technology and Application, 1(1), 14-23.
[48] Eckhardt, A., Laumer, S., & Weitzel, T.
(2009). Who influences whom? Analyzing workplace referents' social influence on IT adoption and non-adoption. Journal of Information Technology, 24(1), 11-24.
[49] King, E., & Boyatt, R. (2015). Exploring
factors that influence adoption of
e‐learning within higher education. British
Journal of Educational Technology, 46(6), 1272-1280.
[50] Yoo, S. J., & Huang, W. D. (2016). Can
e-learning system enhance e-learning culture in the workplace? A comparison among companies in South Korea. British Journal of Educational Technology, 4(47), 575-591.
[51] Benson, D. E., & Mekolichick, J. (2007).
Conceptions of self and the use of digital technologies in a learning environment. Education, 127(4), 498.
[52] Teo, T. (2009). Evaluating the intention to
use technology among student teachers: A structural equation modeling approach. International Journal of Technology in Teaching and Learning, 5(2), 106-118.
[53] Cho, V., Cheng, T. E., & Lai, W. J.
(2009). The role of perceived user-interface design in continued usage intention of self-paced e-learning tools. Computers & Education, 53(2), 216-227.
[54] Venkatesh, V., Morris, M. G., Davis, G.
B., & Davis, F. D. (2003). User acceptance of information technology: Toward a unified view. MIS quarterly, 425-478.
[55] Osang, F. (2012). Electronic Examination
in Nigeria, Academic Staff Perspective— Case Study: National Open University of Nigeria (NOUN).International Journal of Information and Education Technology, 2(4), 304-307.
[56] Song, X. Y., & Wang, P. (2010). Research
on Concept and Effective Factors of Information Adoption Behavior [J]. Information Science, 5, 027.
[57] Mandal, D., & McQueen, R. J. (2012).
Extending UTAUT to explain social media adoption by microbusinesses. International
Journal of Managing Information
Technology, 4(4).
[58] Fluck, A., & Mogey, N. (2013).
Comparison of institutional innovation: Two universities' nurturing of computer-based examinations. In 10th IFIP World conference on computers in education (pp. 11-20).
[59] Bindhu, A., & Manohar, H. L. (2015).
Dimensions of E-Learning effectiveness - A theoretical perspective. International Journal of Economic Research, 12(2).
[60] Pandiya, S., & Gupta, S. (2015). A Study
of Changing Pattern and Demand for Mobile Banking Services in India. Global Journal of Enterprise Information System, 7(1), 16-27.
[61] Magsamen-Conrad, K., Upadhyaya, S.,
Joa, C. Y., & Dowd, J. (2015). Bridging the divide: Using UTAUT to predict
multigenerational tablet adoption
practices. Computers in human behavior, 50, 186-196.
[62] Kishore, K., & Sequeira, A. H. (2014). An
Empirical Observation of Age Factor’s Moderating Role on Mobile Banking Adoption in Rural Karnataka. International Journal of Marketing, Financial Services & Management Research, ISSN, 2277-3622.
[63] Al-Qeisi, K., Dennis, C., Alamanos, E., &
Jayawardhena, C. (2014). Website design quality and usage behavior: Unified Theory of Acceptance and Use of Technology. Journal of Business Research, 67(11), 2282-2290.
[64] Venkatesh, V., & Bala, H. (2008).
Technology acceptance model 3 and a research agenda on interventions. Decision sciences, 39(2), 273-315.
[65] Stone, K. B. (2015). Burke-Litwin
114 Reliability and validity. Organization Development Journal, 33(2).
[66] Afifi, A. A., & Azen, S. P. (2014).
Statistical analysis: a computer oriented approach. Academic press.
[67] Brown, T. A. (2015). Confirmatory factor
analysis for applied research. Guilford Publications.
[68] Keith, N. R., Clark, D. O., Stump, T. E.,
Miller, D. K., & Callahan, C. M. (2013). Validity and Reliability of the Self-Reported Physical Fitness (SRFit) Survey. JPAH, 11(4).
[69] Yong, A. G., & Pearce, S. (2013). A
beginner’s guide to factor analysis: Focusing on exploratory factor analysis. Tutorials in Quantitative Methods for Psychology, 9(2), 79-94.
[70] Pallant, J. (2013). SPSS survival manual.
McGraw-Hill Education (UK).
[71] Akinsanmi, O., Ruth, O. T., & Soroyewun,
M. B. (2010). Development of an
E-Assessment Platform for Nigerian
Universities. Research Journal of Applied Sciences, Engineering and Technology, 2(2), 170-175.
[72] Buzzetto-More, N., & Alade, A. (2010).
Best practices in e-assessment. Journal of
Information Technology Education:
115
Table 2: List of Questionnaire Items
Constructs Items Measuring Questions
Perceived Practicality (PP)
PP1 I believe that taking e-assessment system could improve my academic results
PP2 I think that using e-assessment system could improve my academic performance
PP3 I believe e-assessment system could accelerate my academic performance
PP4 I think e-assessment system could be beneficial to my learning activities
Usage Comfort (UC)
UC1 I feel that e-assessment system would probably be easy to use
UC2 I think that e-assessment system should be easy for me
UC3 I believe e-assessment system should facilitate test completion
UC4 I think e-assessment system is understandable
Perceived Confidence (PC)
PC1 My supervisors/teachers believe I should use e-assessment system
PC2 My friends/classmates believe I should use e-assessment system
PC3 My supervisors / teachers / friends have been helpful in the use of e-assessment system
PC4 My supervisors / teachers / friends should support the use of e-assessment system
Habit (Hb)
Hb1 The use of electronic assessment system has become a regular task for me
Hb2 I believe my academic performance is depended on me using e-assessment system
Hb3 I feel that I must use e-assessment system
Hb4 Using e-assessment system has become natural to me
Anxiety (Ax)
Ax1 I feel apprehensive about using of e-assessment system
Ax2 It scares me to think that using e-assessment system could make me lose marks or perform different in exam (in terms of time management, concentrating, and computer crashes) by hitting the wrong key
Ax3 I hesitate to use e-assessment system for fear of making mistakes
Ax4 E-Assessment system is somewhat intimidating to me
Situational Support (SS)
SS1 I believe I have the resources necessary to use e-assessment system
SS2 I think I have the knowledge necessary to use e-assessment system
SS3 E-Assessment system is compatible with other technologies I use
SS4 I can get help from others when I have difficulties using e-assessment system
Behavioral Intention (BI)
BI1 I intend to use e-assessment system in the future
BI2 I would use e-assessment system to assess my abilities
BI3 I plan to take an e-assessment system test within the next semester
Usage Intention (UI)
UI1 I intend to continuously use this e-assessment system instead of the traditional way of assessing
UI2 I recommend using this e-assessment system instead of the traditional way of assessing to others
116
Table 5: Path Coefficent and t-value
H IV DV
Unstandardized
Coefficient Standardized Coefficient
Sig. B Std. Error Beta T
1 Usage Comfort Behavioral Intention 2.110 .162 .478 10.276 .000
2 Perceived Practicality Behavioral Intention 2.098 .097 .425 9.045 .001 3 Situational Support Behavioral Intention 2.323 .084 .397 11.219 .000
4 Situational Support Usage Intention 2.284 .097 .499 11.058 .000
5 Anxiety Behavioral Intention 2.958 .084 .184 15.435 .000
6 Anxiety Usage Intention 2.570 .102 .378 11.496 .000
7 Perceived Confidence Behavioral Intention 1.734 .323 .346 8.783 .006
8 Perceived Confidence Usage Intention 1.615 .104 .298 8.652 .007
9 Habit Behavioral Intention 1.264 .118 .471 7.892 .014
10 Habit Usage Intention 0.862 .086 .298 1.137 .094
[image:17.612.81.528.504.654.2]11 Behavioral Intention Usage Intention 2.622 .075 .304 12.041 .000
Table 4: Factor Analysis
Items Factors
1 2 3 4 5 6 7 8
PP1 .865
PP2 .744
PP3 .706
PP4 .831
UC1 .798
UC2 .749
UC3 .739
UC4 .839
PC1 .749
PC2 .712
PC3 .831
PC4 .789
Hb1 .840
Hb2 .824
Hb3 .873
Hb4 .706
Ax1 .820
Ax2 .828
Ax3 .812
Ax4 .851
SS1 .708
SS2 .747
SS3 .786
SS4 .829
BI1 .873
BI2 .717
BI3 .769
UI1 .775
UI2 .798
117