The efficiency of a pumping plant is calculated as follows:
Q x H
EO
=3,960 x IHP
where Eo is the overall pumping efficiency, Q is the pump flow rate or capacity (gallons per minute [gpm]), H is total head or lift (feet), IHP is the input horsepower and 3,960 is a conversion factor, which converts the product of Q x H into horsepower. The total head is the sum of the pumping lift (elevation difference between the pump discharge pipe and the pumping water level in the well) and the discharge pressure head (discharge pressure in pounds per square inch [psi] multiplied by 2.31). The discharge pressure must be converted to feet of head to make it compatible with pumping lift, which is also in feet. (Note: a column of water 2.31 feet high creates 1 psi of pressure at its base.)
The input horsepower depends on the energy source. For electric motors,
IHP can be calculated using
48.2 x
Kk
I H P =where Kh is the meter constant (stamped on the power meter faceplate) and t is the time in seconds for 10 revolutions of the meter disc. Newer power meters display the kilowatt demand of the electric motor. Kilowatts are multiplied by 1.34 to obtain horsepower.
The input horsepower of a diesel engine can be calculated by
IHP = 55 x q
where 9 is the fuel consumption of the engine in gallons per hour. The fuel consumption can be measured by disconnecting the fuel line from the fuel tank, placing it into a container filled with a known volume of fuel and measuring the time it takes to fill the container with fuel. The discharge end of any bypass fuel line should also be inserted into the container. The input horsepower of a diesel engine may be three to four times that of an electric motor because of differences in engine efficiency. However, both are rated based on the brake or shaft horsepower: An electric motor rated at 100 horsepower produces the same power as a 100-hprsepower diesel engine.
An inefficient ingine may cause low overall efficiency even when the pump itself is efficient. Separating engine efficiency from pump efficiency requires specialized equipment. The efficiency of an electric motor tends to be relatively constant as long as the motor will run
-
unless the motor becomes severely underloaded, making separation easier.-
B.R.H.charge of the pump and the pumping water level in the well). The higher the efficiency, the more power that is pro- duced per unit of input power.
Electricity users pay for energy based on the number of kilowatt-hours (kwh) consumed (plus fixed charges). The kilowatt is the power demand of the electric motor; 1 kilowatt equals 1.34 horsepower. The hours are the op- erating time of the motor. To reduce electrical energy use, the kilowatt- hours must decrease because of fewer kilowatts or less operating time, or both. Regardless of the claims about a proposed energy-saving measure, if the number of kilowatts or the operat- ing time is not reduced, no energy sav- ings will occur.
The 2001 energy crisis resulted in a state-funded program for testing pumps and improving pumping plant efficiency. The goal, of course, was to reduce energy use in California. Yet the grower response at the Salinas meeting suggests that improving effi- ciency may not actually translate into cost savings. This article discusses the reasons behind the growers’ response. Improving efficiency
Options for improving pumping plant efficiency include adjusting im- pellers, repairing or replacing worn pumps, replacing mismatched pumps, and converting to energy- efficient electric motors. The effect of these options on energy use was evaluated using data collected over the past 20 years from numerous pumping plant tests conducted by the author, utility companies and
companies that install and maintain pumps.
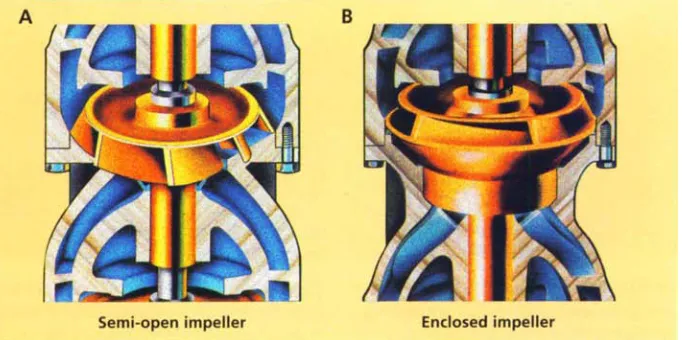
Adjusting impellers. Maintaining the appropriate clearance between the bottom of the vanes of a semi-open im- peller and the bowl housing is critical for efficient pump performance. Wear caused by sand in the well water can increase the clearance between the im- pellers and housing, and reduce pumping plant efficiency. Efficiency can be partially restored by adjusting the impellers. This involves slightly lowering the pump shaft and, in turn, the impellers, by rotating the nut at the top of the shaft (fig. 1). This adjust- ment will not work for enclosed impel- lers (fig. 2).
When we adjusted the impellers of four pumps, both pump capacity and overall efficiency increased consider- ably (table 1). Total head increased slightly, because pumping lift only contributed to total head (see box, page 124). However, for all four pumps, impeller adjustments in- creased input horsepower. Therefore, if the pumps are operated for the same amount of time after the adjustment (a common practice), energy use will in- crease. Energy use will decrease only if the operating time is decreased by pumping the same volume of water af- ter the adjustment as before. For these data (table l), the increase in energy costs ranged from 8.3% to 18.2% for the same operating time before and af- ter adjustment. For tests 1,3 and 4, the decrease in energy costs ranged from 12% to 22.4% to pump the same vol- ume of water. For test 2, energy costs increased by 6%. In this case, the in-
Semi-open impeller Enclosed impeller
Fig. 2. To improve pump performance, semi-open impellers (A) can be adjusted, but enclosed impellers (B) cannot.
crease in pump capacity was insuffi- cient to offset the increase in input horsepower because part of the in- creased pump output also contributed to increased total head.
Repairing worn pumps. Repairing a worn pump can increase capacity, total head and overall efficiency, as shown by the pump test data in table 2. However, for this data the input horsepower increased from 83 to 89. This behavior may be typical of many repaired pumps. A summary of 63 data sets of pump performance before and after repair shows increases of 39%, 0.5% and 33% in pump capacity, total head and overall efficiency, re- spectively (Hanson 1988). The small increase in total head occurred be- cause pumping lift was the main con- tributor. However, the repair
increased the input horsepower for 58% of the pumping plants, with an average increase of 17%. For these pumping plants, using the same oper- ating time before and after the pump repair will increase energy use by 17%. However, pumping the same volume will decrease the average en- ergy use by 22%. For many pumping plants, reducing the operating time may be necessary to realize any en- ergy savings from pump repairs.
Operators of irrigation pumping plants commonly run repaired or ad- justed pumps for the same amount of time after repairs or adjustments as they did before. Operating times are often based on the management and
operating requirements of the particu- lar irrigation system; as a result, it may not be possible to reduce operating time in many cases. The practice of not reducing operating times is what led to the growers’ response in Salinas; it is possible that most irrigators were unaware of the need to reduce operat- ing times and as a result were using more energy after their pumps were repaired.
Replacing mismatched pumps. A performance characteristic of deep- well turbine and centrifugal (booster) pumps is that as pump capacity in- creases, pump efficiency increases to a maximum and then decreases. New pumps should be selected to provide the desired flow rate and total head near the point of maximum efficiency, which minimizes the horsepower de- mand of the pump. Initially efficient pumps can become inefficient because of changes in operating conditions, such as different groundwater levels or alterations in discharge to pressur- ized irrigation systems, even though the pump is operating properly (no wear).
A pump operating properly but not near the point of maximum efficiency is said to be mismatched to the operat- ing conditions. Used pumps are also candidates for being mismatched. To restore the pumping plant’s efficiency, the mismatched pump must be re- placed with one providing the desired total head and capacity near maxi- mum efficiency. This change reduces
[image:3.612.220.561.45.215.2]the kilowatt demand of the pump and results in energy savings even if the operating time is unchanged.
A review of pump test data from a pump (table 3) revealed an overall effi- ciency of 48%. However, an efficiency of 57% was found by testing the pump under several different conditions. This relatively high efficiency sug- gested a mismatched pump. An analy- sis showed that replacing the ineffi- cient pump with one producing the same output at an efficiency of 60% would reduce the input horsepower from 112 to 90, for a 19.6% reduction in energy use.
Using energy-efficient electric motors. Energy-efficient electric mo- tors need less input horsepower than standard motors (table 4). Buying an energy-efficient motor for a new irri- gation pumping plant is more eco- nomical than retrofitting an existing pumping plant. For example, an energy-efficient, 100-horsepower motor can cost $6,000, compared with $5,000 for a standard motor. The input horsepower of the energy-efficient motor will be 104 compared with 109 for the standard motor. At a typical cost of $0.1 per kilowatt-hour operat- ing the pump for 2,000 hours per year will save $746, with a simple payback period of 1.3 years. The payback period for retrofitting, on the other hand, is 8 years.
Evaluating plant performance
Pumping plants should be eval- uated every several years to determine the status of the pump and possible reasons for poor efficiency. Evaluating a pumping plant requires a pump test, during which capacity (flow rate), lift, discharge pressure and input horse- power are measured. The overall
2 0
-Worn impeller and a centrifugal pump.
pumping plant efficiency is calculated from these data, and can then be compared with the standards for correcting electric pumping plants (table 5)(Hanson 2000).
Pump wear or a mismatched pump can cause poor efficiency. Likewise, repairing a mismatched pump may not improve efficiency. So how can one determine if a pump is mismatched or worn?
One approach is to conduct mul- tiple pump tests, each under different operating conditions. These conditions can be imposed on a pump simply by partially closing a valve in the dis- charge pipe or changing the number of sprinkler pipelines or drip lines
0
Mismatched pump0
Wearing pumpthat are irrigated. An efficiency of about 60% or more for one of the tests indicates a mismatched pump under the normal operating conditions.
A second approach is to compare pump test data under normal operat- ing conditions with the manufact- urer’s performance data. Manu- facturers provide information for each pump on the relationships be- tween capacity and total head, effi- ciency and brake horsepower. By comparing the total head of the pump test with the manufacturer’s total head at the measured capacity, one can evaluate if a low efficiency is due to wear or mismatched operat- ing conditions.
0
2,000 2,400 2,800 3,200 3,600 Pump capacity (gpm)
[image:4.612.229.568.425.698.2]For example, a pump test con- ducted in 1984 showed an efficiency of 54% (fig. 3, mismatched pump). How- ever, the deviation of the test point from the manufacturer’s curve was about the same as that of the 1983 test point. The following year (1985), pump efficiency rebounded. This be- havior suggests that the 1984 effi- ciency was due to a mismatched condition. The 1985 point, which shows efficiency similar to the 1983 test, verifies this. However, a second data set showed that the deviation be- tween pump test data and the
manufacturer’s performance curve in- creased with time, indicating possible increasing pump wear (fig. 3, wearing Some caution is necessary in taking this approach. Poor-quality pump test data may prevent an accurate evalua- pump).
tion of the pumping plant. Cascading water in a well may prevent good measurements of pumping lift. Poor test conditions may also prevent good flow-rate measurements. The test sec- tion should have eight to 10 pipe di- ameters of straight pipe immediately upstream of a flow meter and two pipe diameters downstream to prevent errors due to excessive turbulence in the water. For a 10-inch-diameter pipe, a straight section 80 to 100 inches long is recommended. However, research has shown that propeller flow meters are less susceptible to large errors from tur- bulence caused by bends or elbows and checks valves upstream from the meter (Hanson and Schwankl1998).
Energy savings
This series of studies shows that simply improving pumping plant effi-
Adjustments t o impellers, made by turning the nut at the top o f the pump shaft, can improve pump efficiency. But that may not necessarily translate into energy savings, unless operating time is reduced.
ciency does not guarantee energy sav- ings. In fact, adjusting or repairing worn pumps may increase energy use unless the operating time of the pump- ing plant is reduced. Sometimes, ad- justing the operating time still will not
save energy if part of the increase in pump output contributes to a signifi- cant total head increase in addition to a capacity increase. With a higher flow rate, pumping plant operators can re- duce operating time, with either less irrigation time per set or greater acre- age irrigated per set. Opportunities for reducing the operating time will de- pend on site-specific conditions, such the irrigation method and its design and management characteristics. If re- ducing the operating time is not pos- sible, the improved efficiency may result in more crop yield and revenue due to more water applied to a field. Both growers and others apparently did not recognize this fact at the Sali- nas meeting.
Multiple pump tests (at least three) of a pumping plant are recommended, to help evaluate possible reasons for low efficiency. Pumping plant opera- tors should also obtain the manu- facturer’s performance curves to use in the evaluation process.
B.R. Hanson is Extension lrrigation and Drainage Specialist, Department of Land, Air and Water Resources, UC Davis.
References
improving pumping efficiency. Cal Ag Hanson BR. 1988. Benefits and costs of
42(4):2 1-2.
Hanson BR. 2000. Irrigation Pumping
Hanson BR, Schwankl LJ. 1998. Water Plants. UC DANR Pub 3377. 126 p.
turbulence disrupts accuracy of some flow meters. Cal Ag 52(1):25-30.