Accurate and Sensitive Quantification of Soy Proteins in
Raw and Processed Food by Sandwich ELISA
i
Markus Lacorn
*, Tina Dubois, Susanne Siebeneicher, Thomas Weiss
R-Biopharm AG, Germany
Copyright©2016 by authors, all rights reserved. Authors agree that this article remains permanently open access under the terms of the Creative Commons Attribution License 4.0 International License
Abstract
Soy belongs to the so called “Big 8” allergens and following food labeling directives of many different countries soy has to be labeled as ingredient if used in food. Allergen labeling statements enable sensitized patients to avoid the intake of food containing soy. The major allergenic proteins in soy are Glycinin (Gly m 6) and ß-Conglycinin (Gly m 5). The sandwich ELISA RIDASCREEN®FASTSoya quantifies these two proteins in unprocessed as well as in processed food. The following performance characteristics were validated: Selectivity, limit of detection, limit of quantification, precision, recovery, and robustness. First results from proficiency test rounds verified these validation results. In summary, the assay shows high precision and very good recoveries for all different types of samples. It is robust against normal occurring variation within a laboratory. Compared to other test-kits on the market, this ELISA is suitable for the recognition of unheated to strongly heated soy proteins in various foods. Therefore the test can be used for most samples on the market that contain intact soy protein.
Keywords
Allergy, Soy, ELISA, Validation, Processed Food, Proficiency Test1. Introduction
Food allergy is one of the most important public health concerns with only a small number of eight major foods accounting for 90 % of all reactions in sensitized consumers: milk, egg, fish, crustacean shellfish, tree nuts, peanut, wheat, and soybean [1]. These important allergens have to be labeled nearly worldwide. In a study, children's serum was tested for IgE reactivity to soy, and approximately 0.4 % were found positive [2]. However, literature does not clearly show if there is only a cross-reactivity to soy, coming from peanut or lentil allergy in these patients. Missing challenge studies indicate that allergic patients against soy are rare. Furthermore, there is a high probability that patients reacting against other legumes, like beans and peanut, develop
cross-reactivity against soy [1].
Nevertheless, the consumption of soy is rising in Western diets as a result of newly described health and wellness attributes and the desire to consume plant-based protein instead of protein of animal origin. Soy is also an important source of nutrition for infants with milk allergy. Therefore, the potential for accidental intake of soy beans as ingredient or contaminant is increasing for sensitized consumers [3].
Soy bean is valued nutritionally for its high protein content (approx. 35%) which comprises approx. 10% albumins and 90% seed storage globulins. The major proteins are glycinin (Gly m 6) with 40%, ß-conglycinin (Gly m 5) with 35% and 6% soybean trypsin inhibitor. Besides its high protein content, soy beans are also rich in fat (approx. 20%) and are widely used in food technology to improve functional properties such as foaming, gelling, or emulsification during processing. Due to the use of same equipment for cereals and soy beans, a contamination with soy is likely in all other crops and need to be checked by the manufacturer.
commercially available test kits in 2013.
The aim of the study was to develop an antibody-based ELISA to quantify soy protein in different types of food samples with special attention to processed and heat-treated samples. The assay should not take longer than one hour from preparation of the sample extract to calculation of results.
2. Materials and Methods
2.1. Test Kit Components
The sandwich ELISA RIDASCREEN®FAST Soya
(R7102; R-Biopharm AG, Darmstadt, Germany) is used for the following validation experiments. It consists of a microtiter plate (48 wells coated with soy-specific monoclonal antibodies), calibrators (corresponding to 0, 2.5, 5.0, 10.0, and 20 mg/kg soy protein), wash buffer (provided as a 10-fold concentrate), a soy-specific monoclonal antibody conjugated to peroxidase (provided as an 11-fold concentrate), substrate-chromogen solution, and stop solution. For sample preparation the test kit also contains an Extractor (solution) and an Allergen extraction buffer (provided as a 10-fold concentrate). Both in combination are necessary to extract soy proteins quantitatively.
2.2. Extraction of Soy Proteins
One gram of homogenized sample material is weight into a vial followed by 2.5 mL of extractor and 17.5 mL diluted Allergen extraction buffer. In case of a liquid sample only 16.5 mL of the diluted Allergen extraction buffer are used. The vial is closed and incubated for 10 min at 100°C in a boiling water bath. After cooling down, the vial is centrifuged (at least at 2500 g for 10 min) or the content is filtered. 100 µL of the clear supernatant or filtrate is diluted with 400 µL diluted Allergen extraction buffer. 100 µL of this diluted sample extract are used for the ELISA procedure. If the sample contains tannins and/or polyphenols (e.g. spices, chocolate, wine, nuts, and coffee) 0.25% casein and 1% polyvinylpyrrolidon (PVP) are added to the diluted Allergen extraction buffer before using the buffer for extraction of these kinds of samples.
2.3. ELISA Procedure
A sufficient number of wells are inserted in the microwell holder. Sample extracts, calibrators, and control sample extracts are pipetted in duplicate on the plate. As the antigen-antibody reaction starts directly after pipetting, only 24 wells (three strips of 8 wells each) should be used. If more wells are required an uncoated pre-plate should be used to pipette all calibrators and sample extracts. The required quick transfer is performed by using an 8-channel pipette. One hundred µL of calibrator solution or sample extract are pipetted in each designated well in duplicate
followed by an incubation of 10 min at room temperature. Afterwards the plate is washed three times using 250 µL of the diluted wash buffer for each well. The antibody-peroxidase conjugate concentrate is diluted appropriately and 100 µL is pipetted in each well followed by a further 10 min incubation step. The plate is washed again three times with diluted wash buffer and 100 µL of ready-to-use substrate-chromogen solution is added to each well. After incubation at room temperature for 10 min in the dark, the enzymatic conversion is stopped by adding 100 µL stop solution. Absorption is read at 450 nm. By applying an appropriate calibration curve fitting procedure (e.g. RIDA®SOFT Win.net, Z9996 from R-Biopharm AG) by
cubic spline function, the concentrations of the samples are determined. If samples were diluted as described in chapter 2.2, results for soy protein concentration of each sample can be read directly from the calibration curve since the concentrations of these calibrators already include the standard dilution factor of 1:100. If a higher dilution is necessary due to high soy protein concentrations not covered by the calibration function, this further dilution needs to be taken into account when sample concentrations are calculated.
2.4. Validation
The validation scheme was according to an AOAC guideline for validation of commercial ELISA test kits to quantify allergens in food [8].
2.4.1. Selectivity
The major soy proteins glycinin, β-conglycinin, and Kunitz soybean trypsin inhibitor are measured in the ELISA system and reactivities are related to the calibrator material which is soy flour with a total protein content of 39%.
Possible cross-reactivities of the antibody-based system are characterized by analyzing possible food components/commodities that may occur together with soy. These components/commodities are extracted and diluted as described in 2.2.
To identify contaminations with soy, the PCR kit SureFood® Allergen ID Soya (R-Biopharm, S3101) was used.
Possible interferants that are known from other validation studies (e.g. polyphenol- and tannin-containing food) were spiked (see 2.4.5.) with known amounts of soy, extracted and analyzed as described (chapter 2.3).
2.4.2. Limit of Detection
polynomial curve fitting for the low concentration calibrators was used to estimate a concentration for each sample. From a mathematical standpoint it can be expected that negative values also occur since a perfect blank is scattered around zero concentration [9]. For each matrix the LoD was calculated as mean plus the threefold standard deviation.
2.4.3. Limit of Quantification
Bread bakery mixture and margarine are used to confirm the limit of quantification (LoQ). All matrices and Allergen extraction buffer (see 2.1) are spiked at 2.5 mg/kg soy protein which is also the concentration of the lowest soy containing calibrator. Ten replicates are analyzed for each matrix and buffer, following the procedures described in 2.2 and 2.3.
2.4.4. Precision
During a single-laboratory validation only repeatability and within-lab reproducibility can be characterized. Determination of reproducibility requires data from a collaborative test. For determination of repeatability, six subsamples of two different margarines each spiked at 5 mg/kg and 8 mg/kg were analyzed as described above. For within-lab reproducibility, three different technicians spiked, extracted and analyzed the same set of margarines as described for repeatability but only as duplicates.
2.4.5. Recovery
To perform spiking experiments, a defined amount of soy protein needs to be added to the sample. Since only mg quantities need to be added, this can only be achieved by a spiking solution of soy proteins. For preparation, soy flour with a known protein content (e.g. 40% determined by Dumas) is suspended at a concentration of 1 mg/mL soy flour in a buffer containing 360.4 g/L urea, 6.8 g sodium chloride, 1.48 g disodium hydrogen phosphate, 0.44 g potassium dihydrogen phosphate, and 1 g Tween 20. This suspension contains 0.4 mg/mL soy protein and is further diluted using the diluted Allergen extraction buffer (see 2.1) 1:4 resulting in a concentration of 0.1 mg/mL soy protein. By pipetting 100 µL of this soy protein containing solution to 1 g sample, the resulting concentration in this sample is 10 mg/kg soy protein.
Recovery was checked for unprocessed matrices such as bakery mixture, ketchup, margarine, nut nougat cream, and sausage. All matrices were spiked at 2.5, 5.0, 10.0, and 20.0 mg/kg soy protein, extracted and analyzed. For analysis of 24 spices and miscellaneous commodities that contain interferants e.g. polyphenols, extraction using casein and PVP was used (see 2.2). Each matrix was spiked at a 10 mg/kg soy protein level. Processed samples such as hazelnut cake and minced cooked meat were spiked before processing at levels between 20 mg/kg and 4000 mg/kg soy protein. The low levels are produced by depleting the high soy level matrix with blank matrix to the desired concentration.
2.4.6. Samples from local retailers
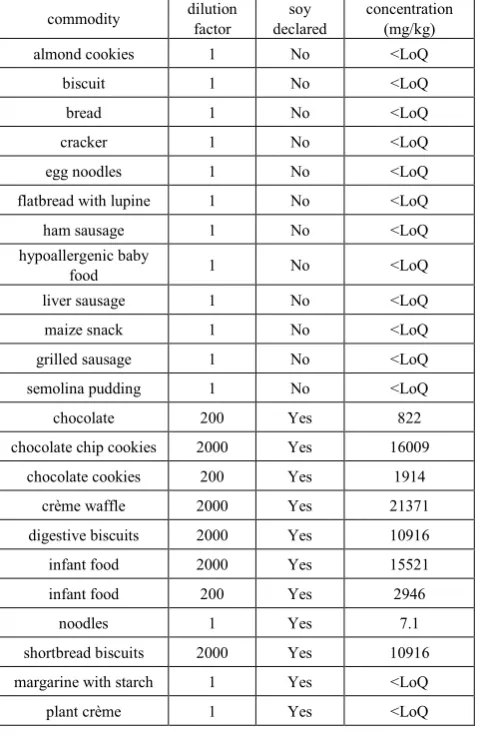
Various samples with and without declaration of soy were collected from the market and analyzed. Since soy is added as an ingredient to some food samples, sometimes very high dilutions before measurement were necessary. 2.4.7. Robustness
Under routine conditions, environmental parameters in a laboratory may change to a certain degree. For testing robustness of the ELISA these parameters were checked to an adequate extent. The parameters tested were incubation temperature (18°C, 23°C, 37°C), ELISA incubation time (9 min, 10 min, 11 min), and sample/calibrator volume (90 µL, 100 µL, 110 µL).
2.4.8. Results from Proficiency Tests
Data of different proficiency test rounds are available. One round (RVEP 150114) was provided by DRRR (Deutsches Referenzbüro für Ringversuche und Referenzmaterialien; http://www.drrr.de/en/) and consisted of 3 different cookie materials (one blank and two contaminated samples). Two rounds (02/2013 and 02/2014) were provided by DLA (Dienstleistung Lebensmittel Analytik GbR; http://www.dla-lvu.de) and consisted in both cases of a bakery product and a boiled sausage. Both provided also an uncontaminated material for the participants. Three rounds (27130, 27147, and 27165) were provided by FAPAS (Food Analysis Performance Assessment Scheme) and consisted of spiked and unspiked wheat flour.
3. Results and Discussion
3.1. Selectivity
Related to the calibrator material, Glycinin,
β-Conglycinin, and Kunitz soybean trypsin inhibitor are detected with 408%, 7.3% and 0.5%, respectively. It can be concluded that the ELISA is specific for Glycinin.
No cross-reactivities to the following commodities were observed:
(1) seeds of cereals and pseudocereals:
Wheat (Triticum aestivum), barley (Hordeum vulgaris), rye (Secale cereal), oats (Avena sativa), rice (Oriza sativa), quinoa (Chenopodium quinoa), kamut (Triticum turanicum), amaranth (genus Amaranthus), buckwheat (Fagopyrum esculentum), spelt (Triticum spelta)
(2) seeds of trees:
Apricot (Prunus armeniaca), chestnut (genus Castanea), cashew (Anacardium occidentale), almond (Prunus dulcis), macadamia (Macadamia ssp.), pecan (Carya illinoinensis), coconut (Cocos nucifera), pistachio (Pistacia vera), brazilnut (Bertholletia excels), hazelnut (Corylus avellana), pine (genus Pinus)
(3) seeds of other plants:
pepo), poppy (genus Papaver), flax (Linum usitatissimum), canola (Brassica napus)
(4) spices:
Yellow mustard seeds (Sinapis alba), black mustard seeds (Brassica nigra), celery leafs (Apium graveolens), celery seeds (Apium graveolens), celery root powder (Apium graveolens), fennel seed (Foeniculum vulgare), anise seed (Pimpinella anisum), caraway (Carum carvi), cumin (Cuminum cyminum), black caraway (Nigella sativa), curcuma (Curcuma zedoaria), onion (Allium cepa), black pepper (Piper nigrum), white pepper (Piper nigrum), chili pepper (genus Capsicum), bell pepper (genus Capsicum), cloves (Syzygium aromaticum), cinnamon (Cinnamomum zeylanicum), savory (Satureja hortensis), basil (Ocimum basilicum), marjoram (Origanum majorana), ginger (Zingiber officinale), nutmeg (Myristica fragrans), cardamom (Amomum subulatum)
(5) other commodities:
Bovine gelatin, porcine gelatin, fish gelatin, skim milk powder, egg lecithin, soy oil (Glycine max), apricot kernel oil, red wine, white wine, kiwifruit (Actinidia deliciosa), cocoa (Theobroma cacao), bovine serum albumin, ovalbumin, fetal calf serum, whole egg powder, roasted coffee (Coffea arabica), margarine, ketchup, sugar.
Botanically, soy belongs to the Fabaceae family also known as Leguminoseae family which also contains some other important edible plants such as lentils, beans, and peas. Therefore these commodities are characterized separated from all other commodities. To avoid confusion only botanical names are given. No cross-reactivities were observered to Lupinus angustifolius, Lupinus albus and Lupinus luteus. In contrast, cross-reactivities were observed against Pisum sativum (dried and fresh seeds), Vicia pannonica, Lens culinaris, Arachis hypogea (roasted and raw), Cicer arietinum, Trigonella foenum-graecum, Trifolium pratense, Phaseolus vulgaris, Phaseolus lunatus, Vicia faba, Phaseolus coccineus, Vigna radiate and Vigna angularis. This was expected since soy is closely related to other members of Fabaceae but from a security standpoint for customers this fact is positive. Many customers sensitized to soy are cross-reacting with these Fabaceae members [1].
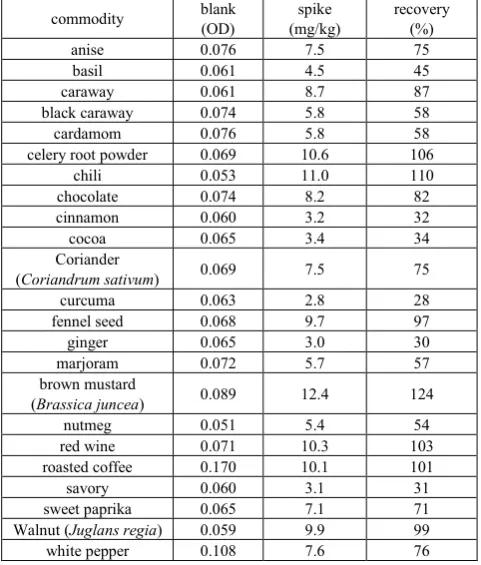
During development of the ELISA it was recognized that polyphenol- and tannin-containing commodities will disturb the immunochemical reaction. Therefore, a special extraction using casein and PVP was developed. Results using this extraction are show in table 1. Except celery (not shown), all spiked materials were detected positive and most of them showed recovery rates of more than 50% which is acceptable for difficult matrices. For diluted extracts of spices (1:10), the recovery will increase (data not shown). This is often described for antibody-based ELISA systems, because polyphenols strongly interact with proteins and are able to precipitate them efficiently [10].
Table 1. Different commodities extracted in the presence of 0.25% casein and 1% PVP to avoid interferences; in parallel the sample extracts were spiked at 10 mg/kg soy protein to verify that the interferences were suppressed in most samples
commodity blank (OD) (mg/kg) spike recovery (%)
anise 0.076 7.5 75
basil 0.061 4.5 45
caraway 0.061 8.7 87
black caraway 0.074 5.8 58
cardamom 0.076 5.8 58
celery root powder 0.069 10.6 106
chili 0.053 11.0 110
chocolate 0.074 8.2 82
cinnamon 0.060 3.2 32
cocoa 0.065 3.4 34
Coriander
(Coriandrum sativum) 0.069 7.5 75
curcuma 0.063 2.8 28
fennel seed 0.068 9.7 97
ginger 0.065 3.0 30
marjoram 0.072 5.7 57
brown mustard
(Brassica juncea) 0.089 12.4 124
nutmeg 0.051 5.4 54
red wine 0.071 10.3 103
roasted coffee 0.170 10.1 101
savory 0.060 3.1 31
sweet paprika 0.065 7.1 71
Walnut (Juglans regia) 0.059 9.9 99
white pepper 0.108 7.6 76
3.2. Limit of Detection
[image:4.595.312.553.118.401.2]Results for the estimation of LoD in bread bakery mixture, chocolate and sausage are presented in table 2 and revealed values of 0.32, 0.15 and 0.23 mg/kg soy protein. The extrapolated concentrations are close to zero and it can therefore be concluded that none of these three matrices have a background effect on the signal. We recommend a possible user of this test kit to verify these LoD values for any unknown matrix as recommended by Koerner et al. [11] for gluten analysis since the matrix may influence the measured signal.
Table 2. Matrix-specific estimation of limit of detection in bread bakery mixture, chocolate, and sausage; Optical densities (OD) values of the zero calibrator are given as reference while mean and standard deviations (SD) in mg/kg are used for calculation the LoD
matrix calibrator 1 (OD) mean (OD) (mg/kg) mean (mg/kg) SD mean + 3 x SD (mg/kg) bread
bakery
mixture 0.061 0.078 0.16 0.055 0.32
chocolate 0.058 0.071 0.04 0.039 0.15
sausage 0.065 0.071 0.11 0.036 0.23
3.3. Limit of Quantification
precision at this low concentration is comparable to values of soy proteins in buffer. The recovery is 100 % for margarine and 116 % for the bread bakery mixture. This procedure to confirm a claimed LoQ is by far the most suitable way to handle this validation parameter but is still not included in the most recent validation guidelines [12].
Table 3. Matrix-specific confirmation of the limit of quantification in bread bakery mixture, chocolate, and buffer compared to the calibrator with a concentration of 2.5 mg/kg soy protein; standard deviations (SD) in mg/kg and coefficient of variation (CV) in percent are used to confirm the LoQ together with the measured concentration which give a measure of recovery at a concentration at or near the LoQ
matrix observed (mg/kg) (mg/kg) SD (%) CV
calibrator 2.5
mg/kg - 0.042 1.7
bread bakery
mixture 2.9 0.106 3.6
margarine 2.5 0.094 3.7
buffer 2.7 0.130 4.8
3.4. Precision
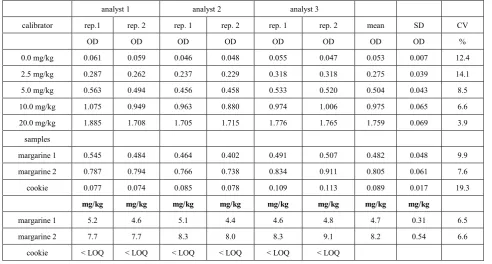
Characterization of repeatability is presented in table 4 for calibrators and samples. It was observed that all CV values for OD values and concentrations were in an acceptable range between 2.0 and 5.3 %. Due to the very low OD readings for the zero calibrators, a CV of 8.7 % is still in the expected range.
As expected, CVs for within-lab reproducibility increased slightly since three persons on different days were involved (table 5). Nevertheless, CVs around 6.5 % are very
good. These results will differ if more persons with different stages of knowledge and training are involved (see Results from Proficiency Tests, table 10.). Acceptable values for repeatability should not exceed values stated in AOAC Appendix K [13]. According to this guidance a sample with a soy protein concentration around 10 mg/kg should not be analyzed with a repeatability of more than 6%. For reproducibility, not more than 11% are allowed for a sample in this concentration range. It is clear, that all CVs are lower than these threshold values.
Table 4. Evaluation of repeatability standard deviation in calibrators and different matrices (n=6)
calibrators mean SD CV
OD OD %
0.0 mg/kg 0.067 0.006 8.7
2.5 mg/kg 0.306 0.007 2.1
5.0 mg/kg 0.551 0.027 5.0
10.0 mg/kg 1.021 0.053 5.2
20.0 mg/kg 1.830 0.039 2.1
samples OD OD %
margarine 1 0.513 0.023 4.4
margarine 2 0.877 0.017 2.0
cookie 0.127 0.006 4.4
samples mg/kg mg/kg %
margarine 1 4.6 0.24 5.3
margarine 2 8.5 0.18 2.1
Table 5. Characterization of within-lab reproducibility standard deviation using data from three different persons, on different days with identical sample materials
analyst 1 analyst 2 analyst 3
calibrator rep.1 rep. 2 rep. 1 rep. 2 rep. 1 rep. 2 mean SD CV
OD OD OD OD OD OD OD OD %
0.0 mg/kg 0.061 0.059 0.046 0.048 0.055 0.047 0.053 0.007 12.4
2.5 mg/kg 0.287 0.262 0.237 0.229 0.318 0.318 0.275 0.039 14.1
5.0 mg/kg 0.563 0.494 0.456 0.458 0.533 0.520 0.504 0.043 8.5
10.0 mg/kg 1.075 0.949 0.963 0.880 0.974 1.006 0.975 0.065 6.6
20.0 mg/kg 1.885 1.708 1.705 1.715 1.776 1.765 1.759 0.069 3.9
samples
margarine 1 0.545 0.484 0.464 0.402 0.491 0.507 0.482 0.048 9.9
margarine 2 0.787 0.794 0.766 0.738 0.834 0.911 0.805 0.061 7.6
cookie 0.077 0.074 0.085 0.078 0.109 0.113 0.089 0.017 19.3
mg/kg mg/kg mg/kg mg/kg mg/kg mg/kg mg/kg mg/kg
margarine 1 5.2 4.6 5.1 4.4 4.6 4.8 4.7 0.31 6.5
margarine 2 7.7 7.7 8.3 8.0 8.3 9.1 8.2 0.54 6.6
[image:5.595.61.554.486.750.2]3.5. Recovery
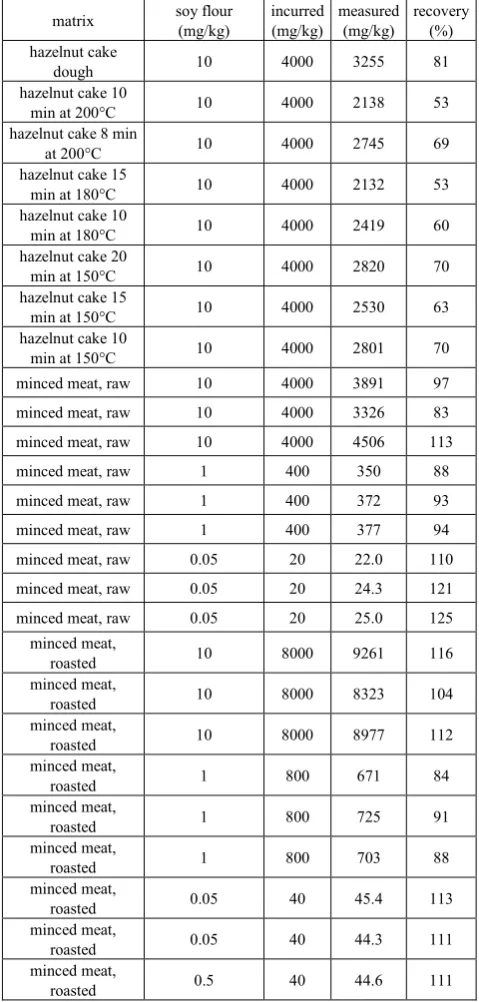
The characterization of recovery is described in table 6 for spiked samples and in table 7 for incurred (processed) samples. Five different types of matrices were spiked at different levels, extracted and analyzed. As can be seen in table 6, the range of recovery varies from 86 to 127 % irrespectively of the concentration and matrix. The spiked buffer control is also included to show that the spiking solution was produced correctly.
Results for processed matrices in comparison to unprocessed original material are shown in table 7. For hazelnut cake, recoveries decrease slightly with increasing temperature and time but are still acceptable for this high degree of processing. In contrast, roasting of minced meat does not affect recoveries. Differences between different spiking levels are more pronounced than differences between raw and roasted materials. According the AOAC Appendix K [13], acceptable levels of recovery for sample with soy protein concentrations around 10 mg/kg should be between 80 and 115%. These levels were nearly always obtained for spiked samples with exception of only a few cases (table 6). Abbott et al. [14] recommended recoveries between 50 and 150% for highly processed samples containing incurred allergens as analyte. As can be seen in table 7, recoveries for highly processed cookies and meat are acceptable due to the recommendations stated above. In contrast to other commercially available ELISA systems [6,7], the ELISA RIDASCREEN®FAST Soya is suitable for quantification of soy proteins in even strongly heated food.
Table 6. Recoveries of different matrices spiked at four different concentration levels
matrix spike (mg/kg) measured (mg/kg) recovery (%)
hazelnut cocoa spread
2.5 2.3 92
5 4.3 86
10 9.0 90
20 18.0 90
cake bakery mix
2.5 2.7 109
5 5.4 109
10 11.7 117
20 23.0 115
margarine
2.5 2.3 92
5 4.6 92
10 9.6 96
20 19.1 95
sausage
2.5 2.2 86
5 4.7 94
10 9.1 91
20 19.4 97
ketchup
2.5 2.5 100
5 5.1 102
10 10.0 100
20 24.2 121
control (buffer)
2.5 2.2 90
5 4.6 92
10 9.2 92
20 18.2 91
Table 7. Recoveries of different incurred matrices spiked before processing with different amounts of soy flour; for heat-processed minced meat a loss of water of 50% was assumed
matrix soy flour (mg/kg) incurred (mg/kg) measured (mg/kg) recovery (%) hazelnut cake
dough 10 4000 3255 81
hazelnut cake 10
min at 200°C 10 4000 2138 53
hazelnut cake 8 min
at 200°C 10 4000 2745 69
hazelnut cake 15
min at 180°C 10 4000 2132 53
hazelnut cake 10
min at 180°C 10 4000 2419 60
hazelnut cake 20
min at 150°C 10 4000 2820 70
hazelnut cake 15
min at 150°C 10 4000 2530 63
hazelnut cake 10
min at 150°C 10 4000 2801 70
minced meat, raw 10 4000 3891 97
minced meat, raw 10 4000 3326 83
minced meat, raw 10 4000 4506 113
minced meat, raw 1 400 350 88
minced meat, raw 1 400 372 93
minced meat, raw 1 400 377 94
minced meat, raw 0.05 20 22.0 110
minced meat, raw 0.05 20 24.3 121
minced meat, raw 0.05 20 25.0 125
minced meat,
roasted 10 8000 9261 116
minced meat,
roasted 10 8000 8323 104
minced meat,
roasted 10 8000 8977 112
minced meat,
roasted 1 800 671 84
minced meat,
roasted 1 800 725 91
minced meat,
roasted 1 800 703 88
minced meat,
roasted 0.05 40 45.4 113
minced meat,
roasted 0.05 40 44.3 111
minced meat,
roasted 0.5 40 44.6 111
3.6. Samples from Local Retailers
[image:6.595.312.552.109.611.2] [image:6.595.60.297.477.743.2]Table 8. Results for different samples from local retailers with and
without declaration of soy on the label.
commodity dilution factor declared soy concentration (mg/kg)
almond cookies 1 No <LoQ
biscuit 1 No <LoQ
bread 1 No <LoQ
cracker 1 No <LoQ
egg noodles 1 No <LoQ
flatbread with lupine 1 No <LoQ
ham sausage 1 No <LoQ
hypoallergenic baby
food 1 No <LoQ
liver sausage 1 No <LoQ
maize snack 1 No <LoQ
grilled sausage 1 No <LoQ
semolina pudding 1 No <LoQ
chocolate 200 Yes 822
chocolate chip cookies 2000 Yes 16009
chocolate cookies 200 Yes 1914
crème waffle 2000 Yes 21371
digestive biscuits 2000 Yes 10916
infant food 2000 Yes 15521
infant food 200 Yes 2946
noodles 1 Yes 7.1
shortbread biscuits 2000 Yes 10916
margarine with starch 1 Yes <LoQ
[image:7.595.59.299.102.470.2] [image:7.595.59.302.512.671.2]plant crème 1 Yes <LoQ
Table 9. Robustness of the ELISA system; variation of incubation time after adding the sample, different sample and calibrator volumes, and different incubation temperatures; a bakery mix sample with a spiked amount of 5 mg/kg soy protein was used
condition mean (mg/kg) SD (mg/kg)
incubation 9 min 4.8 0.3
incubation 10 min 5.0 0.3
inbuation 11 min 4.5 0.3
volume 90 µL 4.5 0.4
volume 100 µL 5.0 0.3
volume 110 µL 4.6 0.4
temperature 18°C 4.9 0.3
temperature 23°C 5.0 0.3
temperature 37°C 4.3 0.3
3.7. Robustness
Table 9 shows the results of robustness experiments. A bakery cake mix containing 5 mg/kg soy protein was used in n=10. All standard deviations were comparable and all mean concentrations were in an acceptable range from 4.3 to 5.0 mg/kg. One significant difference was observed when comparing the results for the 37°C incubation step with the results at 18°C and 23°C. It can be concluded that increasing the incubation temperature higher than 23°C may result in slightly lower concentration values.
3.8. Results from Proficiency Tests
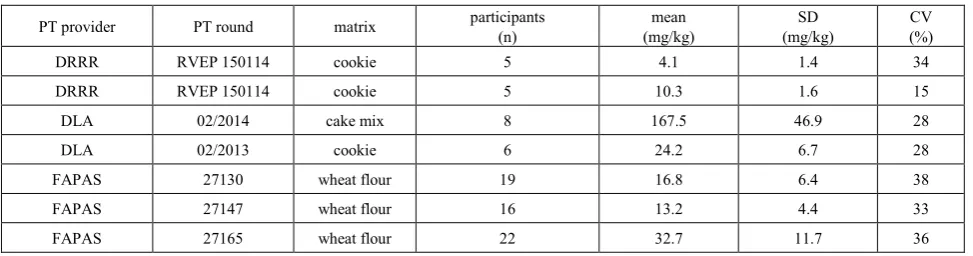
Results from seven different PT rounds are presented in table 10. For FAPAS round 27130 one outlier was eliminated due to a fourfold higher concentration value. This can normally be explained by contamination in the participating laboratory or inhomogeneity of the PT sample. Same is true for FAPAS round 27165 where one outlier was eliminated due to a fourfold higher concentration. As can be clearly seen in table 10, the RIDASCREEN®FAST Soya
ELISA shows acceptable or even better relative reproducibility standard deviations between 15 and 38 % within a concentration range of 4.1 up to 167.5 mg/kg soy protein. This is the normal range where a typical reproducibility standard deviation is expected when several analysts use a commercial ELISA test kit under slightly differing conditions (that does also include different stages of training and knowledge). These high values seem to be in contrast to recommendations given by AOAC [14] but it should be remembered that nearly all commercial allergen assays that are available on the market include a dilution step of the sample before measurement due to the extraction procedure. Therefore, the concentration of the extracted solution should be taken as a basis for comparison and not the concentration of the allergen in the sample [15]. For a concentration of 1 mg/L we could expect an RSDR of 16%
referring to [14]. Compared to this, the lowest calibrator in the ELISA system described in this publication is 0.025 mg/L.
Table 10. Results from seven different proficiency testing rounds provided by DRRR, DLA and FAPAS
PT provider PT round matrix participants (n) (mg/kg) mean (mg/kg) SD (%) CV
DRRR RVEP 150114 cookie 5 4.1 1.4 34
DRRR RVEP 150114 cookie 5 10.3 1.6 15
DLA 02/2014 cake mix 8 167.5 46.9 28
DLA 02/2013 cookie 6 24.2 6.7 28
FAPAS 27130 wheat flour 19 16.8 6.4 38
FAPAS 27147 wheat flour 16 13.2 4.4 33
FAPAS 27165 wheat flour 22 32.7 11.7 36
4. Conclusions
The data presented, clearly show that the sandwich ELISA RIDASCREEN®FAST Soya can be used for a
reliable detection and quantification of soy in food. Besides high recoveries from even highly processed samples, precision values within laboratory were excellent. Data analysis of different proficiency test rounds revealed that even outside the method developer’s laboratory, users were able to produce precise results. One might argue that several cross-reactivities against other members of the Fabaceae family exist and that this narrows the possible areas of use. It should be kept in mind that consumers sensitized to soy also show reactions to those cross-reacting members of the Fabaceae family. From a theoretical point of view, a more selective monoclonal antibody system is possible, but a high selectivity could result in the loss of detection of soy varieties which is much more severe than detecting some plants belonging to the Fabacea family. To clearly identify only soy, real-time PCR is a good possibility to confirm positive results from an ELISA in a qualitative way. Especially during characterization of selectivity, a lot of non-cross-reacting commodities were tested positive at the beginning. Real-time PCR was used to confirm a soy contamination. This clearly shows that during storage, food processing and maybe packaging, soy contaminations are quite regular. This will help sensitized consumers to identify harmful foods but also to obtain suitable food.
At the moment the RIDASCREEN®FAST Soya ELISA
is the only ELISA that quantitates soy in processed food matrices using a quick and easy extraction procedure.
Acknowledgements
R-Biopharm would like to thank RIKILT as the source of the Cell Lines and monoclonal antibodies. Furthermore we would like to thank Ms. Patricia Meinhardt (Washington, MO, United States of America) for proof-reading the manuscript.
REFERENCES
[1] A. K. Verma, S. Kumar, M. Das, P. D. Dwivedi. A Comprehensive Review of Legume Allergy. Clinic. Rev. Allerg. Immunol., Vol.45, 30-46, 2013.
[2] S. H. Sicherer, H. A. Simpson. Food Allergy. J. Allergy Clin Immunol Vol.117 (2 suppl Mini-Primer), S470-S475, 2006. [3] H. Saeed, C. Gagnon, E. Cober, S. Gleddie. Using patient
serum to epitope map soybean glycinins reveals common epitopes shared with many legumes and tree nuts, Mol Immunol., Vol.70, 125-133, 2016.
[4] B. K. Ballmer-Weber, S. Vieths. Soy allergy in perspective, Curr Opinion Allergy Clin Immunol., Vol.8, No.3, 270-275, 2008.
[5] F. Luber, A. Demmel, K. Pankofer, U. Busch, K. H. Engel. Simultaneous quantification of the food allergens soy bean, celery, white mustard and brown mustard via combination of tetraplex real-time PCR and standard addition, Food Control, Vol.47, 246-253, 2015.
[6] A. Scharf, U. Kassel, G. Wichmann, M. Besler. Performance of ELISA and PCR methods for the determination of allergens in food: An evaluation of six years of proficiency testing for soya (Glycine max L.) and wheat gluten (Triticum aestivum L.), J. Agric. Food Chem. Vol. 61, No.43, 10261-10272, 2013.
[7] A. Gomaa, J. I. Boye. Impact of thermal processing time and cookie size on the detection of casein, egg, gluten and soy allergens in food, Food Res. Internat., Vol. 52, 483-489, 2013. [8] M. Abbott, S. Hayward, W. Ross, S. B. Godefroy, F. Ulberth, A. J. van Hengel, J. Roberts, H. Akiyama, B. Popping, J. M. Yeung, P. Wehling, S. L. Taylor, R. E. Poms, P. Delahaut, Validation Procedures for Quantitative Food Allergen ELISA Methods: Community Guidance and Best Practices, J. AOAC Internat. Vol. 93: 442-450, 2010.
[9] P. Koehler, T. Schwalb, U. Immer, M. Lacorn, P. Wehling, C. Don C. AACCI Approved Methods Technical Committee Report: Collaborative Study on the Immunochemical Determination of Intact gluten Using an R5 Sandwich ELISA, Cereal Foods World, Vol.58, No. 1, 36-40, 2013. [10]M. Lacorn, C. Gößwein, U. Immer. Determination of residual
egg white proteins in red wines during and after fining, Am. J. Enol. Vitic., Vol. 62, 382-385, 2011.
Internat. Vol. 96, No. 5, 1033-1040, 2013.
[12]B. Magnusson, U. Örnemark, (eds.) Eurachem Guide: The fitness for Purpose of Analytical Methods – A Laboratory Guide to Method Validation and Related Topics, 2nd ed., 2014, available online at www.eurachem.org
[13]AOAC Official Methods of Analysis (2013) Appendix K: Guidelines for Dietary Supplements and Botanicals. Part I. AOAC Guidelines for Singel-Laboratory Validation of Chemical Methods for Dietary Supplements and Botanicals.
[14]M. Abbott, S. Hayward, W. Ross, S. B. Godefroy, F. Ulberth, A. J. van Hengel, J. Roberts, H. Akiyama, B. Popping, J. M. Yeung, P. Wehling, S. L. Taylor, R. E. Poms, P. Delahaut. Validation Procedures for Quantitative Food Allergen ELISA Methods: Community Guidance and Best Practices, J. AOAC Internat. Vol. 93, 442-450, 2010.
[15]M. Lacorn, R. Ristow, T. Weiss, U. Immer. Collaborative Tests of ELISA Methods for the Determination of Egg White Proteins and Caseins Used as Fining Agents in Red and White Wines, Food Anal. Meth., Vol. 7, 417-429, 2014.
i Dedicated to Ulrike Immer for her pioneer work in allergen analysis